International Journal of Scientific & Engineering Research, Volume 4, Issue 4, April-2013 1743
ISSN 2229-5518
1Department of physics, University college of Science, Osmania University, Hyderabad-500007, Andhra Pradesh, (INDIA).
2Department of physics, University college of Engg, Osmania University, Hyderabad-500007, Andhra Pradesh, (INDIA).
3Department of physics, University college of Science, Osmania University, Hyderabad-500007, Andhra Pradesh, (INDIA).
Tel :+ 91-9676101151 Keywords : Ionic conductivity, composites, E-mail : devishashi5@gmail.com Solid electrolytes, space charge
layer, dispersoid, alumina.
The ionic conductivity of XKNO3 –1-XBa(NO3)2 mixed crystals, σx, has been measured from nearly 360K to close to their melting points. The conductivity in the extrinsic region of Ba(NO3)2 increased as the m/o of KNO3 is increased up to 91m/o and then for 95 m/o the conductivity falls. The further enhancement in conductivity of about three orders is found with the dispersion of Al2O3 to the 91 m/o of KNO3 in Ba(NO3)2. DSC and XRD studies reveal that no new phase is formed. The enhanced conductivity is attributed to the excess cation vacancies generated in the space charge region of the matrix phase surrounding the
alumina particles as a consequence of stabilization of cations at the dispersoid surface due to internal absorption.
The conductivity of many ionic conductors is increased by up to several orders of magnitude when the material is prepared as a composite with a finely dispersed second phase. Ionic conductors containing dispersed second phase particle (DSPP) are called “composite ionic conductors”. The addition of DSPP to normal ionic conductors causes an
increase in the conductivity. This phenomenon has attracted a great deal
of attention from both chemists and physicists, since the pioneer work by Liang in 1973[1]. Conductivity of composites is governed mainly by the ionic transport via interface regions of the ionic crystal [2]. In most cases, the second phase consists of a non conducting material
such as Al2O3 or SiO2 which is insoluble in the host material under the fabrication conditions. Since the discovery of the enhancement in ionic
conductivity in LiI due to dispersion of alumina [1], several other
IJSER © 2013 http://www.ijser.org
International Journal of Scientific & Engineering Research, Volume 4, Issue 4, April-2013 1744
ISSN 2229-5518
researchers have observed the enhancements in various other composites such as polymer electrolytes [3], electrolytes formed by eutectic compounds [4], dispersed solid electrolyte systems of Silver, Lithium, Calcium halides[5], dispersed systems of some alkali nitrates and halides [6-10], silver halides dispersed with different insulating particles [11] and in many other super ionic solids dispersed with insulating second phase [12], alkaline earth nitrate based dispersed systems[13] and in many other cation and anion based conducting solid electrolyte systems[14-20]. Composite solid ionic conductors may not only offer enhanced ionic conductivity, but also superior mechanical properties and low cost. In the previous study we have seen increase in conductivity in the extrinsic region of Ba(NO3)2 as the m/o of KNO3 increased up to 91 m/o and it showed fall of conductivity for 95 m/o. In the present work, we have aimed at enhancing the conductivity of 91 m/o of KNO3 in Ba(NO3)2 by studying the influence of composition , and form of alumina with different particle size. An attempt has been made to identify the conductivity enhancement mechanisms operating in this system.
Ba(NO3)2 and KNO3 were from Qualigens fine chemicals (SQ) of
99.5% purity, is first dissolved in double distilled water and then allowed to grow single crystals. The crystals so obtained are crushed in an agate mortar, sieved and the average size of the particles was estimated to be nearly 50µm. The dispersoid Al2O3 of different particle sizes viz 0.06µm,
0.3µm, 1µm of 99.8% was used, as received from Adolf Meller Co. USA.
Both the powders taken in a particular composition were mixed in the presence of acetone for an hour, manually, until the acetone got
evaporated completely. Pellets were prepared by using a steel die at a pressure of 0.89GPa and were sintered at 2/3 of their melting point for 24 hrs. After cleaning the surfaces an electrode material (silver) was applied for good electrical contact.
Pellet was then mounted in a spring loaded sample holder and annealed at about 150oC for 4 hrs before the data was recorded. A constant rate of heating of 2o C/min was maintained throughout the experiment. The temperature was recorded by Cr-Al thermocouple. A small dc voltage of 1.5V was applied across the sample and the current was measured on a digital dc nano ammeter. Data was recorded on at least three to four samples each of pure and mixed pellets, running a
minimum of three cycles on each sample. Similar experimental conditions were maintained for all the samples and the data showed a reasonably good reproducibility.
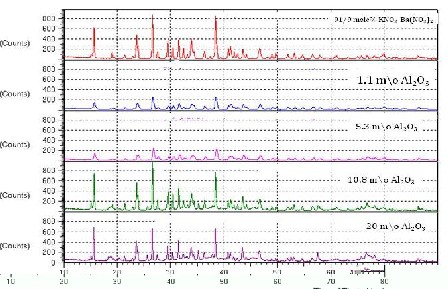
X-ray diffraction data, on pure mixed system (Ba(NO3)2 - 91 m/o of KNO3) and dispersed with 1.1, 5.3, 10.8 and 20 mole percentages of Al2O3(0.06µm) are shown in Fig1. On comparing the patterns of pure mixed system and dispersed systems in figure 1 that there are no new peaks which indicate that no solid solution is formed in these systems. Such observations in case of NaCl- Al2O3 [20], KCl- Al2O3 [21], CsCl- Al2O3 [22], and NaNO3- Al2O3 [23] solid electrolyte systems have also ruled out the formation of solid solutions in them.
IJSER © 2013 http://www.ijser.org
International Journal of Scientific & Engineering Research, Volume 4, Issue 4, April-2013 1745
ISSN 2229-5518
DSC traces of all the said compositions are shown in figure 2. From the figure it is clear that the melting point is practically unaffected in the dispersed systems. Two small humps are observed one at nearly 133oC and
other at 210oC [24]. The first hump is a known transition and the second
could be due to the formation of an amorphous phase within the space charge layer that is expected to form between the host material and the dispersoid particles [25-27]. Similar results were seen when the same system was dispersed with other particle in 0.3µm Al2O3 and 1µm Al2O3. All these results indicate that no new structure is formed in the dispersoid
material and the melting point is unaffected.
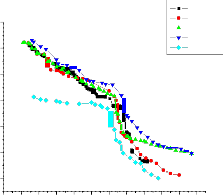
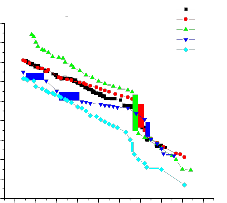
The temperature dependence of dc ionic conductivity from room temperature to nearly the melting point of pure and dispersed with various particle sizes(0.06µm, 0.3µm, 1µm) of Al2O3 are shown in figures 3,4 and
5 respectively.
Conductivity in pure(91 m/o of KNO3 in Ba(NO3)2) can be seen to increase linearly with temperature up to its transition temperature(137oC)
IJSER © 2013 http://www.ijser.org
International Journal of Scientific & Engineering Research, Volume 4, Issue 4, April-2013 1746
ISSN 2229-5518
followed by a bend in the conductivity plot. In the dispersed systems the enhancement in conductivity is observed to increase with mole percentage of Al2O3 for all particle sizes.
03.mAl o
2 3
-2
-4
91 m\o
1.1 m\0
5.3 m\o
10.8 m\o
20 m\o
91 m/o
O
-6
-8
0.06m Al
2 3
-2
-4
-6
-8
1.1 m/o
5.3 m/o
10.8 m/o
20 m/o
-10
-12
-14
1.7 1.8 1.9 2.0 2.1 2.2 2.3 2.4 2.5 2.6 2.7 2.8
1000/T k-1
-10
-12
-14
1.6 1.8 2.0 2.2 2.4 2.6 2.8 3.0
1000/T k-1
IJSER © 2013 http://www.ijser.org
International Journal of Scientific & Engineering Research, Volume 4, Issue 4, April-2013 1747
ISSN 2229-5518
1m Al O
2 3
0
-2
-4
-6
91mo
1.1mo
5.3mo
10.8mo
20mo
the enhancement in conductivity is observed to increase with m/o with a threshold at 5.3 mole percent where from enhancement starts falling with further increase in mole percent. The maximum enhancement at 5.3 mole percent is observed to be about 3 order of magnitude with respect to
pure mixed system in the extrinsic conduction region.
-8
-10
-12
-14
-16
-18
1.8 1.9 2.0 2.1 2.2 2.3 2.4 2.5 2.6 2.7
1000/T k-1
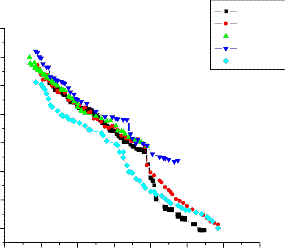
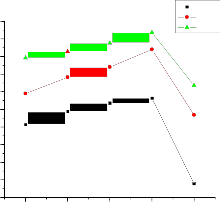
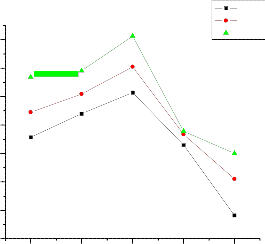
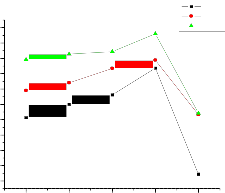
Conductivity versus m/o of the 0.06µm Al2O3, 0.3µm Al2O3 and 1
µm Al2O3 at different temperatures are shown in figures 6, 7 and 8 respectively. The maximum enhancement in conductivity occurs at 10.8 m/o of alumina in 0.06µm Al2O3, 10.8 m/o of alumina in 0.3µm Al2O3, and
5.3 m/o of alumina in 1µm Al2O3. It may be noticed from the plots the
conductivity values at 10.8 m/o in 0.06µm Al2O3 are 7.68 Ω-cm-1 k, 6.3 Ω-cm-1
k, 5.82 Ω-cm-1 k and at 10.8 m/o in 0.3µm Al2O3 are 6.82 Ω-cm-1 k, 6.56Ω-cm-1
- -1
- -1
- -1 -
k, 5.7 Ω cm
-1
k and 5.3 m/o in 1µm Al2O3 are 6.86 Ω cm
k, 5.95Ω cm
k, 4.87 Ω
cm k respectively.
In case of 0.06µm Al2O3 (fig. 3) the enhancement in conductivity is observed to increase with mole percent with a threshold at 10.8 mole percent where from enhancement starts falling with further increase in mole percent i.e for 20 mole percent. The maximum enhancement at 10.8 mole percent is observed to be about 1 order of magnitude with respect to pure mixed system in the extrinsic conduction region. In case of 0.3µm Al2O3 (fig. 4) the enhancement in conductivity is observed to increase with mole percent with a threshold at 10.8mole percent where from enhancement starts falling with further increase in mole percent i.e for 20 mole percent. The maximum enhancement at 10.8 mole percent is observed to be about 1 order of magnitude with respect to pure mixed system in the extrinsic conduction region. And in case of 1 µm Al2O3 (fig. 5)
IJSER © 2013
International Journal of Scientific & Engineering Research, Volume 4, Issue 4, April-2013 1748
ISSN 2229-5518
-5.5
-6.0
0.06m Al O
2 3
428K
453K
473K
-6.5
-7.0
-7.5
-8.0
1 m Al O
2 3
-5
-8.5 -6
-9.0
-9.5
-10.0
-10.5
-7
-8
91m/o 1.1m/o 5.3m/o 10.8m/o 20m/o
-9
91 m/o and differnet mole percentages of Al O
2 3
-10
-11
-12
91m/o 1.1m/o 5.3m/o 10m/o 20m/o
91 m/o and differnet mole percentages of Al O
-5 .5
0.3m Al O
2 3
2 3
428K
453K
473K
-6 .0
-6 .5
-7 .0
-7 .5
-8 .0
-8 .5
-9 .0
-9 .5
-10 .0
-10 .5
91m/o 1.1m /o 5.3m/o 10.8m/o 20m/o
91 m/o and differnet m ole percentages of Al O
2 3
The observed enhancement in the conductivity in these dispersed systems are interpreted in terms of the formation of space charge layer at the interface between the host matrix and the dispersoid. The mechanism of formation of space charge layer is understood as follows. The defect species, which is involved in ionic conduction of the matrix, may be
repelled from or attracted to the interface resulting in the formation of a
IJSER © 2013 http://www.ijser.org
International Journal of Scientific & Engineering Research, Volume 4, Issue 4, April-2013 1749
ISSN 2229-5518
space charge region [11, 13, 28, 29]. Thus in the present system being a Frenkel solid, if the cations are attracted to the interface, the vacancy concentration in the space charge region will be increased relative to the bulk value. Repulsion of cations by the inert phase will increase the concentration of interstitials in the space charge region. Thus space charge region is associated with an increased concentration of defects. Thus additional contribution to the total conductivity from the space charge region accounts for the enhancement in ionic conductivity. The activation energies calculated for pure and dispersed systems erived from logσT versus 1000/T plots are shown in table-I.
minimum for 5.3 m/o Al2O3 in 1µm Al2O3 where we got the maximum enhancement in conductivity. These results lead to the conclusion that the enhanced conductivity in 91 m/o of KNO3 in Ba(NO3)2- Al2O3 composites is due to the increased concentration of cation vacancies [30-31].
When the concentration of Al2O3 is low, all the particles are completely surrounded by the host matrix. Conductivity of the system increases with increasing concentration of Al2O3 because it amounts to the increase in the highly conducting bonds between dispersoid particle and host matrix. Subsequently, when the total volume of the interface layers is most effectively linked together, the total number of highly conducting bonds become maximum, consequently sample would show maximum
conductivity.![]()
Mole percentages 0.06µm
![]()
Al2O3
0.3µm
Al2O3
1µm
Al2O3
As the concentration of Al2O3 further increase, Al2O3 particles cannot be completely covered by the interface layers simply because the
91 m/o of KNO3 in Ba(NO3)2 0.8ev 0.8ev o.8ev
1.1 m/o 0.6ev 0.78ev 0.66ev
5.3 m/o 0.67ev 0.79ev 0.5ev
10.8 m/o 0.41ev 0.64ev 0.82ev
20 m/o 1.11ev 0.85ev 1.47ev
![]()
![]()
The activation energies are calculated in the extrinsic region of temperature. It may be noticed from the table that the activation energy is minimum for 10.8m/o in case of 0.06µm Al2O3 and 0.3µm Al2O3. It is found
available host cannot envelope all the Al2O3 particles, number of non- conducting bonds increase and therefore conductivity decreases[11,29,32-
34].
The composite solid electrolyte 91 m/o of KNO3 in Ba(NO3)2 dispersed with alumina has been investigated through XRD, DSC and two probe dc ionic conductivity techniques. The composite containing 10 m/o of 0.06µm Al2O3 and 0.3µm Al2O3 has the maximum conductivity of about
1 order of magnitude higher than of 91 m/o of KNO3 and in case of 1µm
Al2O3 the maximum enhancement in conductivity of 3 orders is found in
5.3 m/o Al2O3. The enhancement of conductivity is interpreted in terms of
IJSER © 2013 http://www.ijser.org
International Journal of Scientific & Engineering Research, Volume 4, Issue 4, April-2013 1750
ISSN 2229-5518
the formation of space charge region between the host matrix and dispersoid. The formations of cation vacancies are more probable than the interstitials in the interfacial region.
The authors thank the Head, Department of physics, Osmania
University for the experimental facility.
Sons, New York, (1984).
533 (1986).
[7] N.F. Uvarov, V.P. Isupov, G.V. Lavrova, E.F. Hairetdinov; Solid State
Ionics 74 15 (1994).
[8] V.G Ponomareva, N.F. Uvarov, G.V. Lavrova, E.F. Hairetdinov; Solid
State Ionics 55 83 (1996).
[9] V.G. Ponomareva, G.V. Lavrova; Solid State Ionics 55 83 (1996).
[10] N.F. Uvarov, I.V. Skobelev, B.B. Bokhonov, E.F. Hairetdinov, J.Mater; Synth. Process. 4 391 (1996).
[11] J.Maier; Prog. Solid State Chem. 23 171 (1995).
[12] R.C. Agarawal, R.K. Gupta, J. Mater; Sci. 34 1131 (1999).
[13] S. Narender Reddy, A. Sadananda chary, Ch. Gopal Reddy, M.V. Madavarao Rao; Mater. Lett. 58 2949 (2004).
[14] G.V. Lavrova, V.G. Ponomareva, E.B. Burgina; Solid State Ionics 176
767 (2005).
[15] B. Kumar, C. Chen, Chakrapani, Varanasi, J.P. Fellner; J. Power Sources
[16] J.E. Diosa, A. Solis, R.A. Vargas, B.E. Mellander; Solid State Ionics 175
459 (2004).
[17] P.S. Anantha, K. Haraharan; J. Phys. Chem. Solids 64 1131 (2003).
[18] S. Narender Reddy, A. Sadananda chary, K.Saibabu, T. Chiranjivi; J. Mater. Sci. Lett. 11 980 (1992).
[19] K. Shahi, Ashok Kumar, Mater; Res. Bull. 31(7) 877 (1996).
[20] K. Shahi, Ashok kumar Kumar, in: B.V.R. Chowdhary, et al.; (Eds.), Solid
State Ionics: Mater. Appl., World Pub. Co., 433 (1992).
IJSER © 2013 http://www.ijser.org
International Journal of Scientific & Engineering Research, Volume 4, Issue 4, April-2013 1751
ISSN 2229-5518
[21] K. Shahi, Ashok kumar Kumar, in: B.V.R. Chowdhary et al.; Solid State
Ionics Materials, World Scientific Pub.Co., 14-153 (1994).
[22] Ashok kumar, K. Shahi; Material Research Bulletin, 31(7), 877-886
[23] P.S. Anantha, K. Hariharan; J.Of Physics and chemistry of Solids, 64,
1131-1137 (2003).
[24] S. Shashi Devi, B.L.Aruna , S.Narender Reddy, A.Sadananda Chary; Pelagia Research Library, 3(6), 1337-1342 (2012).
[25] N.F. Uvarov, P.Vanek et al.; Solid State Ionics, 90, 201-207 (1996).
[26] N.F. Uvarov, P.Vanek, M.Savinov, V.Zelenzy, V.Studnicka, J.Pezelt; Solid State Ionics, 127, 253-267 (2000).
[27] N.F. Uvarov, P.Vanek,; J.of Material Synthesis and Processing, 8(5/6),
319-326 (2000).
[28] M.V. Madavarao Rao, S. Narender Reddy, A. Sadananda chary; Physica
B: Condensed Matter, 362, 193-198 (2005).
[29] M.V. Madavarao Rao,; Ph.D. Thesis, Osmania University, India, (2004).
[30] Prakash Gopalan, P.Bhandari, A.R.Kulkarni, V.R.Palkar; Materials
Research Bulletin, 37, 2043-2053 (2002).
[31] M.V. Madavarao Rao, S. Narender Reddy, A. Sadananda chary; Physica
B: Condensed Matter, 369, 181-186 (2005).
[32] Shusheng Jiang, J.Bruce Wagner, (Jr.); J.Phys.Chem.Solides, 56(8),
1101-1111 (1995).
[33] Shusheng Jiang, J.Bruce Wagner, (Jr.); J.Phys.Chem.Solides, 56(8),
1113 (1995).
[34] M.V. Madavarao Rao, S. Narender Reddy, A. Sadananda chary; J.of
Non-Crystalline Solids, 352(2), 155-159 (2006).
IJSER © 2013 http://www.ijser.org
International Joumal of Scientific & Engineering Research, Volume 4, Issue 4, April-2013
ISSN 2229-5518
1752
IJSER ©2013
httpllwww i ser orq