basis of coverage and energy consumption.
International Journal of Scientific & Engineering Research, Volume 4, Issue 4, April-2013 382
ISSN 2229-5518
Energy and Coverage Efficient Static Node
Deployment Model for Wireless Sensor Network
Ragib Shakil Rafi, Md. Mizanur Rahman, Nishat Sultana, Mahmud Hossain
Abstract- W SNs are energy constrained, and recent works are being carried out by many engineers and scientists to make the W SNs more energy efficient. Primarily, W SNs can be categorized into two types: random and deterministic. We have concentrated our research interest to design an energy efficient deterministic W SN. In this paper, a Seven Node Hexagonal Deployment (SNHD) scheme is proposed i.e. hexagonal deployment with an additional node at the centre of every hexagon. It has been proved by mathematical analysis and MATLAB simulation that our proposed model is more energy efficient and have higher lifetime compared to Tri-Hexagon-Tiling (THT), Square grid, and LEACH random node deployment. Moreover, by mathematical analysis it has also been shown that SNHD deployment scheme requires less number of nodes to cover any region compared to other methods.
Index Terms- Coverage, Energy Efficient, Hexagonal Deployment, LEACH, Network Lifetime, Node Deployment, W SN.
- - - - - - - - - - - - - - - - - - - -
ireless sensor network (WSN) is a large scale integrated network, composed of low-power, low-cost multifunctional small sensors which are capable of data sensing, processing, and communicating through radio channel with each other. As WSNs are energy constrained networks [1], one elementary way of reducing energy consumption and enhancing lifetime is sensible deployment of sensor nodes within the network area. The deployment of nodes is either static or dynamic depending on their structure and the way of routing. In static or deterministic deployment method, positions of sensor nodes are fixed and they use predefined paths to route their data to the base station (BS). In dynamic routing nodes are moveable throughout the deployed field and routing paths are updated continuously to route data to the sink or BS. In this paper, we emphasize on deterministic node deployment method and propose a deterministic node deployment model, Seven Node Hexagonal Deployment (SNHD). We compared our proposed model to one random Low Energy Adaptive Clustering Hierarchy (LEACH) [2] and two deterministic node deployments: square grid, Tri-Hexagon Tiling (THT) [3] on the
basis of coverage and energy consumption.![]()
- Ragib Shakil Rafi completed his B.Sc. Engg. From ECE Discipline of
Khulna University, Bangladesh.
- Md. Mizanur Rahman is an associate professor of ECE Discipline of
Khulna University, Bangladesh.
- Nishat Sultana completed his B.Sc. Engg. From ECE Discipline of
Khulna University, Bangladesh.
- Mahmud Hossain completed her B.Sc. Engg. From EEE Discipline of
Ahsanullah University of Science and Technology, Bangladesh.
Coverage analysis is based on how efficiently a field can be covered with minimum number of nodes and energy consumption analysis was done to reduce network energy consumption by optimizing the transmitting distance, sequentially changing heads, and applying data aggregation technique.
The reminder of our paper is structured as follows: section 2 is relevant previous works on node deployment and energy aware routing schemes are outlined. Section 3 explains different existing node deployment strategies. In section 4, proposed node deployment model and calculation of the coverage and energy consumption are discussed. In section 5, results and discussions are presented. Finally, conclusion is drawn in section 6 with vision to further improve this work.
Major objective of any node deployment technique is to provide full coverage to a certain region with minimum number of nodes. So, cost and deployment quality is the two factors that come first while considering any deployment technique [4].
Depending on the types of deployed nodes, a WSN can be either homogenous or heterogeneous. In a homogenous sensor network, each node has same energy level, sensing range, and processing capabilities. On the other hand, in heterogeneous sensor network, nodes have different sensing range, energy level, and processing capabilities. Heterogeneous sensor network is complex in nature and more sophisticated protocols with better network manageability are needed to handle this. Recent researches are running on mixing the homogenous and heterogeneous network together to improve
IJSER © 2013 http://w w w .ijser.org
International Journal of Scientific & Engineering Research, Volume 4, Issue 4, April-2013 383
ISSN 2229-5518
the network life-time [5]. Our analyses are based on homogenous network.
Grid deployment method is a part of deterministic deployment scheme of sensor nodes and geometric-shapes
as,![]()
![]()
R Sense =
rrRF 2 (1)
n
like square, hexagon, equilateral triangle are used in grid deployment. In [3], a comparative study is done on two grid deployment methods: Tri-Hexagon-Tiling (THT) and square grid while THT has been suggested as a good deployment
Where RF is the field radius [3]. Here, Sensing radius of a node is equal to the edge length of the square cell. In this scheme, to cover an area of, 4 nodes in a cell exactly cover
4×(1/4)×(π 2 ) areas. So, redundant area covered by 4 nodes is:
method.
It was found in [6] that, to ensure the continuous coverage
(π−1)D
= (π−1)R sense 2 (2)
and connectivity in WSN, sink-hole routing must be avoided.
Therefore, a single node covers 0.54 D
redundant areas,
Phenomenon of dying the nodes nearest to the sink is
addressed as ‘sink-hole routing’. To fulfill this desired
coverage and connectivity, power aware non-uniform
deployment was suggested.
Comparison between multihop and single hop scheme is an
everlasting topic in WSN. Sensor network with multihop
communication has been preferred in [7], [ 8] while in [9], [ 10] single hop communication over multi-hop has been preferred considering practical amplifier characteristics and high end to end data transferring probability. But in [2] multihop routing
has been shown to be better in efficient use of energy.
Clustering is a means of saving energy and designing a
high lifetime network. Cluster can be done in many ways but
it depends on the deployment methods of the nodes and on
expected routing scheme. As was shown in [11], nodes were
clustered in a big hexagon and comparative study on three
different data transmitting schemes: direct reporting,
where D is the edge length of any square cell.
Tri-hexagon-tiling (THT) is formed by using a hexagon and six equilateral triangles with each edge of the hexagon. This pattern can be drawn by placing a hexagon as the center and other six hexagons placed at each corner of the center hexagon and as shown in fig. 1(c) Sensors are placed at every grid point. In THT, sensing radius of each node is equal to the edge length of hexagon and it can be expressed as:![]()
![]()
4rrRF 2
R sense = 3√3 n (3)
Where R F is the field radius [3]. Here, Sensing radius of a node
is equal to the edge length of the square cell. In this scheme, to
cover an area of, 4 nodes in a cell exactly cover 6×1/3×π 2 . So, redundant area covered by 6 nodes 3.69 2 . Therefore, a single
2
reporting via cluster head (CH) situated at the center of the
node covers 0.615D
redundant areas, where D is the edge
hexagon, and reporting via random CH are explained. Hex-
MASCLE algorithm has been proposed in [12] to cluster the
deployed nodes and to improve WSNs’ lifetime.
Rotation of CHs to optimize the use of stored energy of
each node would be a great solution to combat energy
consumption issue. To achieve this CH rotation method
proposed in LEACH [2] has been used to cluster the nodes in
the proposed deployment method.
In the random deployment, the nodes are randomly scattered with respect to the radial and angular directions from the BS as shown in the fig. 1(a) Sensors in the field have equal probability of being positioned independently of the other sensors. Though the, sensor nodes are homogenous, they have some equal parameters like energy, bandwidth etc., but uneven distance among them creates problem. This introduces data latency and uneven energy dissipation throughout the network.
In this deployment scheme, total field is covered with regular square shaped cells as shown in fig. 1(b) If any circular field of
length of any hexagon.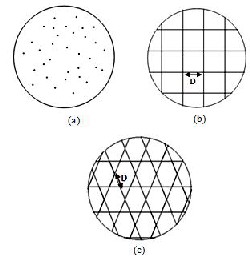
Fig.1. Node deployment techniques. (a) Random, (b) Square grid, (c) THT
Fig. 2 shows the SNHD deployment method. In this proposed scheme, seven regular hexagons form the basic structure by placing one at the center and six others are placed with each
radius RF
is covered with X number of cells, X is
edge of the center hexagon. Nodes are placed at each cross
approximated to, (√n -1) ² [3], where n is the total number of
sensors. So, the sensing equation of each node can be written
section and an additional node is placed at the center of every hexagon.
IJSER © 2013 http://www.ijser.org
International Journal of Scientific & Engineering Research, Volume 4, Issue 4, April-2013 384
ISSN 2229-5518
Fig.2. SNHD deployment
So, every hexagon consists of seven nodes. This additional node is placed to reduce the redundant coverage that exists at other deterministic node deployment method discussed in this paper. For SNHD, relation of sensing radius of a sensor node and edge length of the hexagon is,![]()
D=√3 Rsense 2 (4)
The relation between field radius and sensing radius of a node
is:![]()
8nRF 2
redundant area. On the other hand, multiple sensing of an area creates data loads for the CHs as heads have to receive and aggregate same data for multiple times.
As described earlier, seven hexagons construct a single cluster in the proposed SNHD deployment method. Each hexagonal cell carries seven sensor nodes. The sensor nodes positions can be decided either by GPS or the signaling within themselves and the BS and testing the signal strength or test message energy strength. Centre node of the centre hexagon of any cluster will be the initial CH. For the cluster formation, initial CHs will broadcast cluster formation message to the nodes. Nodes that are situated within 2×D distance of any initial CH, where D is the edge length of any hexagonal cell, will be included in the cluster under that initial head. At 2×D distance, each initial CH will find 6 nodes those are overlapped with another cluster but distance of these nodes from the initial CH of that overlapping cluster will be greater than 2×D. So, the overlapped nodes those lie within 2×D distance from initial CH of any cluster, will be included in that cluster. Other overlapped nodes beyond 2×D distance, receive cluster formation messages from different CHs and will decide which CH has minimum distance from it. If it finds two CHs at a same distance, then it will take decision based on the
n = 3+![]()
9√3 Rsense 2
(5)
distance of the CH from the BS and will consider itself on the
cluster of the head which has less distance than another one.
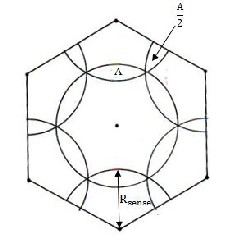
Fig.3. SNHD sensing coverage strategy
![]()
Area of one hexagon cell = (3√3 2)/2. To cover this area in
SNHD method, we used 7 nodes. Coverage area of centre
node is π 2 . For other six nodes which are at each corner, only
one third of their coverage area is taken into account for one
cell.
Moreover, if some nodes, which CHs are at same distance from the base and are found to be on the boundary of two clusters then they will be distributed among the clusters alternately. This method will be followed throughout the deployed network.
Here, in the proposed SNHD method, heads of clusters will be changed synchronously throughout the network.
So, redundant coverage for one cell is 0.5435 2
and this
Fig.4. Cluster head changing method of SNHD
redundant area is covered by 6 nodes. Each node covers extra
2
Fig. 4 explains the changing method of CHs in SNHD.
0.09D
= 0.27R sense 2 . Fig. 3 shows the deployment method
used for redundant coverage calculation for one cell in SNHD
deployment. Redundant coverage is a concerning issue as for
sensing large area nodes use more sensing power to cover the
Suppose clusters are formed as described according to the
cluster formation method described in section 4.1. In fig. 4,
black nodes are in the same cluster. White marked nodes are
IJSER © 2013 http://www.ijser.org
International Journal of Scientific & Engineering Research, Volume 4, Issue 4, April-2013 385
ISSN 2229-5518
into different clusters. In fig. 4, two black color hexagons (an inner and an outer) are drawn using the clustered nodes. Nodes that are situated at the perimeter of these two hexagons are selected as clustered heads. To synchronously choose the heads, nodes are numbered maintaining a synchronism, following the clockwise or counter clockwise rotation. In this example clockwise rotation has been chosen. Every cluster in the network will follow this procedure. So, when node 1 is head in one cluster, node 1 will be the head in other clusters. Number of CHs can be increased further taking the nodes that are in the same cluster but not included in two big hexagons drawn at fig. 4
SNHD follows multihop communication scheme. Sensor nodes will send their data to the CHs through the TDMA slots allocated by the CHs and CHs will communicate with each other by CDMA technique. The clusters will be allocated CDMA codes by the BS. Every head of a certain cluster should use the CDMA code allocated for its cluster. This communication process is explained with the following fig. 5. In fig. 5, there are three CHs and every head has three nodes. In the first step, every sensor node will sense the data and in the second step nodes will send the data to the CH. This 2nd step will be split into 3 time slots and one slot will be allocated to each node to ensure that when one sensor node is sending data others are not sending to avoid collision. Because if collision detection protocol is used and collision occurs, then the corresponding data will be required to be sent for the second time or more times which will cause more loss of energy. At the third step, each CH will aggregate the received data. During 4th step, 1st CH (nearest to the BS) will send the data to the BS. At 5th step, data of 2nd CH will be sent to the
1st CH. 6th step will be used by the 1st CH to send the received data of 2nd CH to the BS.
Fig.5. Data communication process of SNHD
At the same time 3rd CH will send its data which will be received by the 2nd CH. At 7th step data of 3rd CH will reach to the 1st CH and during 8th step it will be transmitted to the BS by the 1st CH. The steps are shown in fig. 6.
Fig.6. Data transmission cycle using 3-hops /heads in SNHD method. (CH= Cluster Head, without data sensing, receiving, and aggregating steps)
Energy consumption is a critical issue of WSN as less energy consumption increases the network lifetime, while more consumption decreases the lifetime. Basically sensor nodes loss their energy in three ways in wireless sensor network: in data sensing, processing, and transmitting that data. Direct transmission of data to the BS wastes more energy [3], [ 8]. Thus by forming clusters and communication through CH is preferred by the researchers and many other techniques are being applied such as data aggregation, rotation of CHs to enhance network lifetime. In SNHD model, we consider multihop communication through CHs and the CHs are being rotated synchronously within every cluster throughout the network as discussed in section 4.3.
The reason behind CH changing is to optimize the energy
utilization of every node in the cluster. Data aggregation
proposed in LEACH is considered in our model also [5]. So,
total energy consumed by a CH in our model is:
E= Er + Ea + Et (6)
Where, Er = receiving energy, Ea = data aggregation energy,
and Et = transmitting energy. Et is calculated following the
equation of first order radio model.
We analyzed the relation between sensing radius of a node and its redundant area covered by every node. Fig.7 is plotted using the simulation values and it shows that for a given sensing radius, a node in SNHD deployment covers less redundant area than other two methods. So, for a given sensing radius, our scheme performs better by covering greater areas with less overlapping regions than square grid and THT. Minimum overlapping regions ensures generation of minimum number of similar data and less sensing energy.
IJSER © 2013 http://www.ijser.org
International Journal of Scientific & Engineering Research, Volume 4, Issue 4, April-2013 386
ISSN 2229-5518
Processing of similar data sent by different nodes will certainly waste more energy of CHs. Thus by reducing overlapping regions and processing minimum number of similar data, energy consumption is reduced at every CH in the proposed node deployment method.
Fig.7. Per node redundant area covered if every node is considered to have equal radius and the sensing radius to edge length ratios are kept unchanged of different deployment techniques
Fig.8. Number of nodes required to cover a circular area of 50m radius for Square Grid, THT and SNHD deployment.
Fig. 8 shows the number of nodes required to cover a certain region for a given sensing radius. We have plotted fig. 8 for different values of sensing radius to cover a circular field of
50m radius. Among the discussed deployment methods, SNHD requires less number of nodes. This is because, in SNHD method, nodes cover less redundant area if equal sensing radius is considered for all deployment techniques. Applying equal sensing radius for a single node and minimum overlapping condition, hexagonal cells in SNHD method cover more area than other methods. Therefore less number of nodes is required in SNHD to cover a given area. So, to cover a given field with less number of nodes compared to other methods proves our method to be more cost effective. Fig.9(a) shows our node deployment technique. 110 nodes are deployed on a 95m×86.6m field. In the figure a single hexagon cell is marked. Fig. 9(b) and fig. 9(c) show the number of alive
and dead nodes after 1400 and 2000 data transmitting rounds.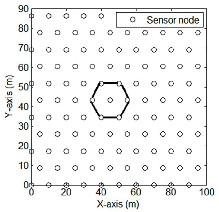
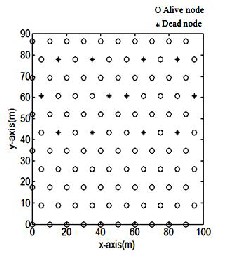
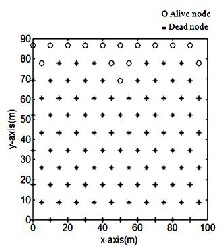
Fig.9.Node deployment in SNHD model. (a) 110 nodes are deployed on a 95m×86.6m field. In the figure a single hexagon cell is indicated. (b) Position of dead and alive nodes after 1400 rounds. (c) Position of dead and alive nodes after 2000 rounds.
Fig.10 shows the network lifetime comparison of our deployment technique with others. From fig.10. It is evident that SNHD node
IJSER © 2013 http://www.ijser.org
International Journal of Scientific & Engineering Research, Volume 4, Issue 4, April-2013 387
ISSN 2229-5518
deployment method ensures greater network lifetime than any other deployment technique as discussed in this paper. It’s always an important issue to make all the nodes in a WSN to work together for more number of data transmission rounds as the network will be fully covered for that period of time. According to the fig.10, SNHD method provides full coverage for longer time than other methods. It’s a prime need to sustain full coverage for a long time. Otherwise, sensed data from the total field will not be collected efficiently and result of monitoring the overall field will be less efficient.
Fig.10. Comparison of Network lifetime of LEACH, SNHD, Square Grid and THT deployment techniques.
Based on the analytical and simulation results, it is proved that, a given area is covered in an energy efficient way with less number of nodes in the SNHD deployment model. In this scheme the nodes are actually placed at equal distances from neighbor nodes, transmission energy is optimized. Moreover, data aggregation and synchronous rotation of the CHs helps in better utilization of the valuable network power.
In this work processing energy consumption was not considered for simplification of the analysis. Delay was not also calculated for the proposed model. In near future, a more detailed WSN model considering processing energy, delay and active-sleep modes of the nodes will be analyzed. Moreover, we also hope to implement and observe the performance of our proposed SNHD WSN deployment model.
[1] Halder Subir, Ghosal Amrita, Sur Sanjib, Dan Avishek, and DasBit Sipra, “A Lifetime Enhancing Node Deployment Strategy in WSN,” Springer Berlin Heidelberg, vol. 5899, pp. 295–307, 2009.
[2] Wendi Rabiner Heinzelman, Anantha Chandrakasan, Hari Balakrishnan, “Energy-Efficient Communication Protocol for Wireless Microsensor Networks,” in HICSS '00 Proceedings of the
33rd Hawaii International Conference on System Sciences, Maui,
Hawaii, vol. 8. January 2000.
[3] Wint Yi Poe, Jens B. Schmitt, “Node Deployment in Large Wireless Sensor Networks: Coverage, Energy Consumption, and Worst-Case Delay,” in AINTEC '09 Asian Internet Engineering Conference, ACM New York, NY, USA, pp. 77-84, 2009.
[4] Gaojuan Fan, Ruchuan Wabg, Haiping Huang, Lijuan Sun and Chao Sha, “Coverage-Guaranteed Sensor Node Deployment Strategies for Wireless Sensor Networks,” Sensors 2010, vol. 10, pp.2064–2087, March 2010.
[5] Femi A. Aderohunmu, “Energy Management Techniques in Wireless Sensor Networks: Protocol Design and Evaluation,” A thesis submitted for the degree of Master of Applied Science in Telecommunication at the University of Otago, Dunedin, New Zealand, March 2010.
[6] Yunhuai Liu, Hoilun Ngan, and Lionel M. Ni, “Power-Aware Node Deployment in Wireless Sensor Networks,” in Proceedings of the IEEE International Conference on Sensor Networks, Ubiquitous, and Trustworthy Computing, Volume 3, Pages 225-241, April2007.
[7] Sinem Coleri Ergen, Pravin Varaiya, “On Multi-Hop Routing for Energy Efficiency,” IEEE Communications Letters - IEEE Commun. Lett., vol. 9, no. 10, pp. 880-881, Oct. 2005.
[8] Szymon Fedor, Martin Collier, “On the Problem of Energy Efficiency of Multi-hop vs One-hop Routing in Wireless Sensor Networks,” in AINAW '07 Proceedings of the 21st International Conference on Advanced Information Networking and Applications Workshops, vol. 2, pp. 380-385, May 2007.
[9] M. Haenggi, “Twelve Reasons not to Route over Many Short Hops,”
in Vehicular Technology Conference, 2004. VTC2004-Fall. 2004 IEEE
60th, vol. 5, pp. 3130 -3134, Sept. 2004.
[10] Uroš M. Pešović, Jože J. Mohorko, Karl Benkič, Žarko F. Čučej, “Single-hop vs. Multi-hop – Energy Efficiency Analysis in Wireless Sensor Networks,” in 18th Tеlеcommunicаtions Forum, TELFOR
2010. Srbija, Beograd, novembar 2010.
[11] Yonas G. Debessu, Hsiao-Chun Wu, Shih Yu Chang, Scott C.H.
Huang, “Lifetime Analysis for Wireless Sensor Network with Hexagonal Clustering,” in Global Telecommunications Conference (GLOBECOM 2011), 2011 IEEE.
[12] Jakob Salzmann, Ralf Behnke, Dirk Timmermann, “Hex-MASCLE – Hexagon Based Custering with Self Healing Abilities,” in Wireless Communications and Networking Conference (WCNC) IEEE 2011, pp. 528 -533, May 2011.
IJSER © 2013 http://www.ijser.org