International Journal of Scientific & Engineering Research, Volume 4, Issue 8, August-2013 1873
ISSN 2229-5518
Empirical Analysis of Iron Extraction Based on Phosphorus Removal and
Leaching Time of Iron Ore in Hydrogen Peroxide Solution
T. O. Chime
Department of Chemical Engineering, Enugu State University of Science
& Technology, Enugu, Nigeria
ABSTRACT
Empirical analysis of iron extraction was carried out based on removed phosphorus concentration and leaching time of iron ore in hydrogen peroxide. A model was derived and used as a tool for the analysis. The model is expressed as;
β = - 0.0002 x2 - 9721 γ2 + 0.0364 x + 9399.5γ - 2192
The validity of the two-factorial model was found to be rooted on the expression β + 2192 = - 0.0002 x2 -
9721γ2 + 0.0364 x + 9399.5γ where both sides of the expression are correspondingly approximately equal. Statistical analysis of the extracted iron concentration as obtained from derived model and experiment for
each value of the leaching time and concentration of removed phosphorus considered shows standard errors of 0.3652 & 0.4090% and 0.1047 & 0.1718% respectively. Furthermore, Iron extractions per unit concentration of removed phosphorus as well as per unit leaching time as obtained from derived model-
predicted and experimental results were 230.225 & 210 as well as 0.023 & 0.021 %/mins. respectively.
Deviational analysis indicates that the maximum deviation of the model-predicted iron extraction (from experimental results) is less than 3%, implying an operational confidence level above 97%.
Keywords: Analysis, Iron Extraction, Phosphorus Removal, Leaching Time, Hydrogen Peroxide, Iron
Ore.
INTRODUCTION
Extraction of metals through leaching of ores in various solutions has been generally accepted to highly
environmental friendly. There has been also increased research interests in exploring optimum methods of achieving balance between high yield and clean atmosphere. A comparative assessment evaluation carried out on the solubility of iron in several organic and inorganic acids has shown that iron oxides and oxyhydroxides can dissolve in hydrochloric and perchloric acids (Sidhu, et al.,1981). Studies have been conducted on the dissolution of goethite in several inorganic acids belonging to the families of the carboxylic and diphosphoric acids in the presence of reducing agents (Chiarizia and Horwitz, 1991). Investigations have been carried out of contact time, acid concentration, temperature, particle size and, the stirring speed on the dissolution of the iron ore during a quantitative leaching of iron ore in hydrochloric acid solution (Alafara et al.,2005). The dissolution rate was found to depend on the hydrogen ion concentration and temperature of the reaction system. The mechanism of dissolution appears to follow an exothermic pathway. The activation energy for the dissolution reaction was 13.63 kJmol-1. About 92% of the total iron in the ore was dissolved within 120 min. by 12M HCl solution and 8000C using 0.1mm particle size at an optimum stirring speed of 300rpm.
Appraisal of results generated from these extraction processes has been carried using various derived models as analytical tools. A model for the evaluation of the concentrations of dissolved iron (relative to the final solution pH and temperature) during leaching of iron oxide ore in sulphuric acid solution has been derived (Nwoye et al., 2008). The model
%Fe = 0.35(α/T)3 (1)
IJSER © 2013 http://www.ijser.org
International Journal of Scientific & Engineering Research, Volume 4, Issue 8, August-2013 1874
ISSN 2229-5518
depended on the values of the final pH and temperature of the leaching solution which varied with leaching time. The positive and negative deviations of the model-predicting values of %Fe (dissolved) from those of the experimental values were found to be within the range of acceptable deviation limit for experimental results.
Calculations of the concentrations of leached iron during leaching of iron oxide ore in sulphuric acid solution has been achieved through application of a model (Nwoye et al., 2009a). The model is expressed as
%Fe = e-2.0421(lnT) (2)
The predicted concentrations of leached Fe were observed to be very close to the values obtained from the experiment. The model shows that the concentrations of leached Fe were dependent on the values of the final leaching solution temperature measured during the leaching process. It was observed that the validity of the model is rooted in the expression ln(%Fe) = N(InT) where both sides of the expression are correspondingly approximately equal.
A model for calculating the concentrations of dissolved iron during leaching of iron oxide ore in nitric acid solution was also derived (Nwoye and Ovri, 2010). It was observed that the validity of the model is rooted on the expression %Fe = N(μ/α) where both sides of the relationship are correspondingly approximately almost equal. The maximum deviation of the model-predicted dissolved %Fe values from the corresponding experimental values was found to be 28%. The model

%Fe = 0.0043 μ (3)
α
was found to be dependent on the value of the mass-input of iron oxide ore and final solution pH measured during the leaching process. Dissolved iron concentration per unit mass of iron oxide ore input evaluated from experimental and model-predicted results were 0.0010%/g and 0.0011%/g respectively, indicating proximate agreement.
A model was successfully derived for predictive analysis of the concentrations of dissolved iron during leaching of iron oxide ore in sulphuric acid solution (Nwoye et al.,2009b).The model expressed as
%Fe = 0.987(μ/T) (4)
was able to predict the concentrations of dissolved Fe with a high degree of precision. It was observed that the model was dependent on the values of the leaching temperature and weight of iron oxide ore added. The validity of the model was found to be rooted in the expression %Fe = N(μ/T) where both sides of the relationship are correspondingly approximately equal. The maximum deviation of the model- predicted concentration of dissolved Fe from those of the experimental values was found to be less than 19% which is quite within the acceptable range of deviation limit for experimental results, hence depicting the usefulness of the model as a tool for predictive analysis of the dissolved iron during the process.
A model for predicting the concentration of iron dissolved during nitric acid leaching of iron oxide ore in oxalic acid solution has been derived (Nwoye et.al., 2009c) to assess how the final solution pH affects the extraction of iron. The model

%Fe = 0.0133 α (5)
μ
was found to depend on the value of the final solution pH and mass-input of iron oxide ore during the experiment. It was observed that the validity of the model is rooted in the expression %Fe = N(α/μ),
IJSER © 2013 http://www.ijser.org
International Journal of Scientific & Engineering Research, Volume 4, Issue 8, August-2013 1875
ISSN 2229-5518
where both sides of the relationship are correspondingly approximately almost equal. Dissolved iron concentrations per unit mass of iron oxide ore input evaluated from experimental and model-predicted results were 0.0058%/g and 0.006%/g respectively, indicating proximate agreement.
Evaluation of the prospect and effectiveness of dissolving iron (from iron compounds) in organic acids such as acetic, oxalic formic, citric and ascorbic acids has shown that oxalic acid is most effective and promising because of its acid strength, good complexing characteristics and high reducing power, compared to other organic acids (Ambikadevi and Lalithambika, 2000).
Applicability of oxalic acid ensures precipitation of dissolved iron from the leach solution as ferrous oxalate, which can be re-processed to form pure haematite by calcinations (Taxiarchour et al.,1997).
Also a model for calculating the concentrations of dissolved iron (relative to the final solution pH and temperature) during leaching of iron oxide ore in oxalic acid solution was derived (Nwoye and Mbuka,
2011) to evaluate the correlations between dissolved iron & both final solution pH and temperature. The model
%Fe = 1.1849(γ/T)3 (6)
was able to calculate the concentrations of dissolved iron being dependent on the values of the final leaching solution pH and temperature measured during the leaching process. It was observed that the validity of the model is rooted in the expression (%Fe/N)1/3 = γ/T where both sides of the expression are approximately equal to 0.2. The maximum deviation of the model-predicted concentration of dissolved iron from the corresponding experimental values was found to be less than 18% which is quite within the acceptable range of deviation limit of experimental results. Concentrations of dissolved iron per unit rise in the solution temperature as obtained from experiment and derived model were evaluated as 0.0011 and
0.0015 %/0C respectively, indicating proximate agreement.
The aim of this work is to take an empirical analysis of iron extraction based on phosphorus removal and leaching time of iron ore in hydrogen peroxide solution. Phosphorus present in the iron ore is locked up with the ore and so during leaching of the iron ore, as phosphorus is being oxidized by oxygen (from hydrogen peroxide) and removed with time, iron is simultaneously being extracted.
MATERIALS AND METHODS
Agbaja (Nigeria) iron ore was mined and collected from the deposit, beneficiated and the resultant
concentrate used for this research work. The iron ore was crushed for the purpose of liberation size. Tyler standard was employed to produce particle size of 250µm . The raw Agbaja iron ore was then sent for chemical analysis using X-ray fluorescence spectrometer and atomic absorption spectrophotometer. Scrubbing process
Scrubbing was carried to remove argillaceous material from the raw iron ore. The iron ore was poured into a head pan and water was poured to a reasonable level. The ore was washed and the water decanted
This was repeated for five times until clear water was observed. At this point 5g of sodium silicate and 25 drops of oleic acid were sprinkled and distributed evenly throughout the ore.20litres of distilled water was also introduced into the pan and content mixed thoroughly..After mixing, the argillaceous materials were
removed leaving behind the iron ore. The residue was washed thoroughly and sun dried for 24 hours.
Some quantities were sent for chemical analysis.
Chemical leaching process
The dried scrubbed iron ore was further pulverized and sieved of 63,90,150,180,and 250µm .Analar
grade of hydrogen peroxide solutions of different moles of 2,4,6,8,and10 were prepared. 50g of particle size of 63µm of scrubbed iron ore was poured into a beaker(reactor). 10ml of 2M of hydrogen peroxide
IJSER © 2013 http://www.ijser.org
International Journal of Scientific & Engineering Research, Volume 4, Issue 8, August-2013 1876
ISSN 2229-5518
was poured into the beaker containing the iron ore .The mixture was thoroughly to ensure homogeneity at
70ºC .The content was allowed to leach for 20,40,60,80 and 100 minutes. At the end of each period, the solution was cooled and filtered. The residue was collected, washed to neutrality with distilled water ,air dried and oven dried at 150o C for 24 hours. The experiment was repeated for different concentrations and particles sizes. The samples were analyzed using atomic absorption spectrophotometer and X-ray fluorescence diffraction spectrometer.
Model Formulation
Experimental data obtained from the highlighted research work were used for the model derivation.
Computational analysis of these data shown in Table 1, gave rise to Table 3 which indicate that;
β + K = - Se x2 - N γ2 + S x + Ne γ (7) Introducing the values of K, Se , N, S and Ne into equation (7)
β + 2192 = - 0.0002 x2 - 9721 γ2 + 0.0364 x + 9399.5γ (8)
β = - 0.0002 x2 - 9721 γ2 + 0.0364 x + 9399.5γ - 2192 (9) Where
(β) = Conc. of extracted iron (%)
(γ) = Conc. of removed phosphorus (%)
x = Leaching time (mins.)
K = 2192, Se = 0.0002, N = 9721, S = 0.0364, Ne = 9399.5
K, Se , N, S and Ne are equalizing constant (determined using C-NIKBRAN (Nwoye, 2008)) Table 1: Variation of iron extracted concentration with leaching time and concentration of removed
phosphorus .
Fe (%) | Leaching time (mins.) | (γ) (%) |
78.22 79.32 79.81 79.80 79.90 | 20 40 60 80 100 | 0.474 0.478 0.480 0.481 0.482 |
Boundary and Initial Condition
Consider iron ore (in a reactor) placed with in hydrogen peroxide solution (oxidant).The reactor
atmosphere is not contaminated i.e (free of unwanted gases and dusts). Initially, atmospheric levels of oxygen are assumed just before the decomposition of H2 O2 (due to air in the reactor). Mass of iron oxide ore:( 50 g), range of leaching time considered: 20-100 mins., concentration of H 2 O2 : 2M, constant treatment temperature: 70oC, ore grain size; 63µm, were also used.
The boundary conditions are: reactor oxygen atmosphere due to decomposition of H2 O2 (since the reactor was air-tight closed) at the bottom and top of the ore particles interacting with the gas phase. At the top of the particles, a zero gradient for the gas scalar are assumed and also for the gas phase at the bottom of the particles. The reduced iron is stationary. The sides of the particles are taken to be symmetries.
RESULTS AND DISCUSSIONS
IJSER © 2013 http://www.ijser.org
International Journal of Scientific & Engineering Research, Volume 4, Issue 8, August-2013 1877
ISSN 2229-5518
The result of the chemical analysis carried out on the beneficiated iron ore concentrate is presented in Table
1. The table shows that the percentage of total Fe in the as-beneficiated ore is 52.67%.
Table 2: Result of chemical analysis of iron ore used
Element/Compound | FeT | P | SiO2 | l2O 3 |
Unit (%) | 552.67 | 0.49 | 8.983 | 6.986 |
Model Validation
The validity of the model is strongly rooted in equation (8) (core model equation) where both sides of the
equation are correspondingly approximately equal. Table 3 also agrees with equation (8) following the values of β + 2192 and - 0.0002 x2 – 9721 γ2 + 0.0364 x + 9399.5γ evaluated from the experimental results in Table 1.
Table 3: Variation of β + 2192 with - 0.0002 x2 - 9721 γ2 + 0.0364 x + 9399.5γ
β + 2192 | - 0.0002 x2 - 9721 γ2 + 0.0364 x + 9399.5γ |
2270.22 2271.32 2271.81 2271.80 2271.90 | 2271.93 2273.01 2273.51 2273.73 2273.78 |
Furthermore, the derived model was validated by comparing the extracted iron concentration predicted by the model and that obtained from the experiment. This was done using various evaluative techniques such as computational, statistical, graphical and deviational analysis.
Computational Analysis
Computational analysis of the experimental and model-predicted extracted iron concentration was carried
out to ascertain the degree of validity of the derived model. This was done by comparing extracted iron per unit leaching time as well as extracted iron per unit concentration of removed phosphorus evaluated from model-predicted results with those from actual experimental results
Extracted iron concentration per unit leaching time βx (%/ mins.) was calculated from the equation;
Βx = β / x (10)
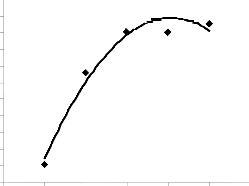
Therefore, a plot of the extracted iron concentration against leaching time as in Fig. 1 using experimental results in Table 2, gives a slope, S at points (20, 78.22) and (100, 79.9) following their substitution into the mathematical expression;
Βx = Δβ / Δx (11) Equation (11) is detailed as
Βx = β 2 – β 1 / x2 - x 1 (12)
Where
Δβ = Change in extracted iron concentrations of β 2 , β 1 at two leaching time values x2, x1. Considering the points (20,
78.22) and (100, 79.9) for (x1, β 1) and (x2, β 2) respectively, and substituting them into equation (12), gives the slope as 0.021 %/ mins. which is the extracted iron concentration per unit leaching time during the actual
leaching process.
IJSER © 2013 http://www.ijser.org
International Journal of Scientific & Engineering Research, Volume 4, Issue 8, August-2013 1878
ISSN 2229-5518
80.2
80
79.8
79.6
79.4
79.2
79
78.8
78.6
78.4
78.2
78
R2 = 0.972
0 20 40 60 80 100 120
Leaching time (mins.)
Fig. 1: Coefficient of determination between extracted iron concentration and leaching time as obtained from experiment
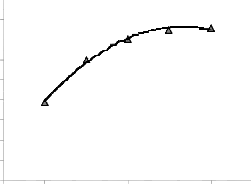
A plot of the concentration of extracted iron against leaching time (as in Fig. 2) using derived model-predicted results gives a slope: 0.023%/mins. on substituting the points (20, 79.9356) and (100, 81.7774) for (x1, β 1) and (x2, β 2) respectively into equation (12). This is the model-predicted extracted iron concentration per unit leaching time.
82.5
82
81.5
81
80.5
80
79.5
79
78.5
78
R2 = 0.9934
0 20 40 60 80 100 120
Leaching time (mins.)
Fig. 2: Coefficient of determination between extracted iron concentration and leaching time as obtained from derived model
Extracted iron concentration per unit concentration of removed phosphorus βγ was calculated from the equation;
βγ = β / γ (13)
Therefore, a plot of the extracted iron concentration against leaching time as in Fig. 1 using experimental results in Table 2, gives a slope, S at points (20, 78.22) and (100, 79.9) following their substitution into the mathematical expression;
βγ = Δβ / Δγ (14) Equation (14) is detailed as
βγ = β 2 – β 1 / γ 2 - γ 1 (15)
IJSER © 2013 http://www.ijser.org
International Journal of Scientific & Engineering Research, Volume 4, Issue 8, August-2013 1879
ISSN 2229-5518
Where
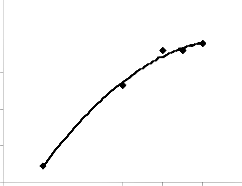
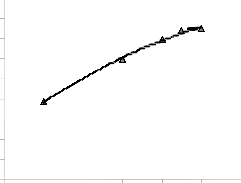
Δβ = Change in extracted iron concentrations of β 2 , β 1 at two values of the removed phosphorus concentration γ2, γ 1. Considering the points (0.474, 78.22) and (0.482, 79.9) for (γ1, β 1) and (γ2, β 2) respectively, and substituting them into equation (15), gives the slope as 210 which is the extracted iron concentration per unit removed phosphorus concentration during the actual leaching process. A plot of the concentration of extracted iron against removed phosphorus concentration (as in Fig. 2) using derived model-predicted results gives a slope:
230.225 on substituting the points (0.474, 79.9356) and (0.482, 81.7774) for (γ 1, β 1) and (γ 2, β 2) respectively into equation (15). This is the model-predicted extracted iron concentration per unit removed phosphorus.
80.5
80
79.5
79
78.5
R2 = 0.9938
78
0.472 0.474 0.476 0.478 0.48 0.482 0.484
Conc. of phosphorus removed (%)
Fig. 3: Coefficient of determination between extracted iron concentration and concentration of removed phosphorus obtained from experiment
82.5
82
81.5
81
80.5
80
79.5
79
78.5
78
R2 = 0.9959
0.472 0.474 0.476 0.478 0.48 0.482 0.484
Conc. of phosphorus removed (%)
Fig. 4: Coefficient of determination between extracted iron concentration and concentration of removed phosphorus as obtained from derived model
A comparison of this set of values for extracted iron concentration (per unit leaching time and removed phosphorus concentration) also shows proximate agreement and a high degree of validity of the derived model.
Statistical Analysis
The standard errors (STEYX) in predicting the extracted iron concentration (using results from derived model and experiment) for each value of the leaching time and removed phosphorus concentration are 0.3652
IJSER © 2013 http://www.ijser.org
International Journal of Scientific & Engineering Research, Volume 4, Issue 8, August-2013 1880
ISSN 2229-5518
& 0.4090% and 0.1047 and 0.1718% respectively. The standard error was evaluated using Microsoft
Excel version 2003.
Also the correlations between extracted iron concentration and leaching time as well as between extracted iron concentration and removed phosphorus concentration as obtained from experiment and derived model considering the coefficient of determination R2 from Figs. 1-4 was calculated using the equation;
R = √R2 (16)
The evaluations show correlations 0.9859 & 0.9967 and 0.9969 & 0.9979 respectively. These evaluated results indicate that the derived model predictions are significantly reliable and hence valid considering its proximate agreement with results from actual experiment.
Graphical Analysis
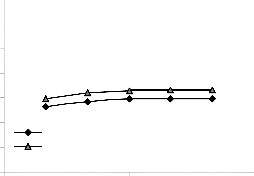
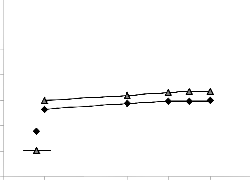
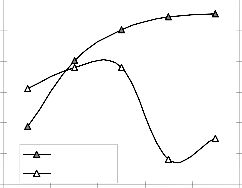
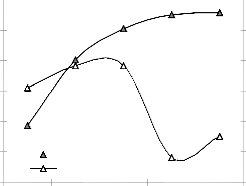
Comparative graphical analysis of Figs. 5 and 6 shows very close alignment of the curves from model- predicted extracted iron concentration (MoD) and that of the experiment (ExD). The degree of alignment
of these curves is indicative of the proximate agreement between both experimental and model-predicted extracted iron concentration.
100
95
90
85
80
75
ExD
70 MoD
65
0 20 40 60 80 100 120
Leaching time (mins.)
Fig. 5: Comparison of the extracted iron concentration (relative to leaching time) as obtained from experiment and derived model
100
95
90
85
80
75 ExD
70 M oD
65
0.472 0.474 0.476 0.478 0.48 0.482 0.484
Conc. of phosphorus removed (%)
IJSER © 2013 http://www.ijser.org
International Journal of Scientific & Engineering Research, Volume 4, Issue 8, August-2013 1881
ISSN 2229-5518
Fig. 6: Comparison of the concentrations of extracted iron concentration (relative to removed phosphorus)
as obtained from experiment and derived model
Deviational Analysis
Analysis of extracted iron concentrations from the experiment and derived model revealed deviations on
the part of the model-predicted values relative to values obtained from the experiment. This is attributed to the fact that the surface properties of the iron ore and the physiochemical interactions between the ore and the oxidant (H 2 O2 ) which were found to have played vital roles during the process were not considered during the model formulation. This necessitated the introduction of correction factor, to bring the model-predicted extracted iron concentration to those of the corresponding experimental values.
Deviation (Dn) of model-predicted removed phosphorus concentration from that of the experiment is given by

Dn = Pv –Ev x 100 (17) Ev
Where
Pv = Extracted iron concentration as predicted by derived model
Ev = Extracted iron concentration as obtained from experiment
Correction factor (Cr ) is the negative of the deviation i.e
Cr = -Dn (18)
Therefore

Cr = - Pv – Ev x 100 (19) Ev
Introduction of the corresponding values of Cr from equation (19) into the derived model gives exactly the extracted iron concentration as obtained from experiment.
82 2.5
81.5
2.4
81 2.3
80.5
2.2
80 2.1
79.5
79
MoD Deviation
20 40 60 80 100
2
1.9
Leaching time (mins.)
Fig. 7: Variation of model-predicted extracted iron concentration with associated deviation from experimental results (relative to leaching time)
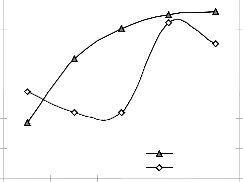
Figs. 7 and 8 show that the maximum deviation of the model-predicted extracted iron concentration from the corresponding experimental values is less than 3% and quite within the acceptable deviation limit of
IJSER © 2013 http://www.ijser.org
International Journal of Scientific & Engineering Research, Volume 4, Issue 8, August-2013 1882
ISSN 2229-5518
experimental results. The figure show that the least and highest magnitudes of deviation of the model- predicted extracted iron concentration (from the corresponding experimental values) are + 2.12 and +
2.42 % which corresponds to extracted iron concentrations: 81.004 and 81.7312 %, as well as leaching
times: 40 and 80 mins., and removed phosphorus concentrations: 0.478 and 0.481 respectively.
82 2.5
81.5
2.4
81 2.3
80.5
2.2
80 2.1
79.5
79
MoD Deviation
0.474 0.478 0.48 0.481 0.482
2
1.9
Conc. of phosphorus removed (%)
Fig. 8: Variation of model-predicted extracted iron concentration with associated deviation from experimental results (relative to removed phosphorus concentration)
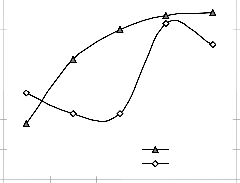
Comparative analysis of Figs. 7-10 indicates that the orientation of the curve in Figs. 9 and 10 is opposite that of the deviation of model-predicted extracted iron concentration (Figs. 7 and 8 ). This is because correction factor is the negative of the deviation as shown in equations (18) and (19).
82 -1.9
81.5 -2
81 -2.1
80.5
-2.2
80 -2.3
79.5
79
M oD Corr.factor
20 40 60 80 100
-2.4
-2.5
Leaching time (mins.)
Fig. 9: Variation of model-predicted extracted iron concentration with associated correction factor to model-predicted results (relative to leaching time)
IJSER © 2013 http://www.ijser.org
International Journal of Scientific & Engineering Research, Volume 4, Issue 8, August-2013 1883
ISSN 2229-5518
82 -1.9
81.5 -2
81 -2.1
80.5
-2.2
80 -2.3
79.5 MoD Corr.factor
79
0.474 0.478 0.48 0.481 0.482
-2.4
-2.5
Conc. of phosphorus removed (%)
Fig. 10: Variation of model-predicted extracted iron concentration with associated correction factor to model-predicted results (relative to removed phosphorus concentration)
It is believed that the correction factor takes care of the effects of surface properties of the iron ore and the physiochemical interactions between the ore and the oxidant (H2 O2 ) which have played vital roles during the process, but were not considered during the model formulation. Figs 8 and 9 indicate that the least and highest magnitudes of correction factor to the model-predicted extracted iron concentrations are –
2.12 and – 2.42 % which corresponds to extracted iron concentrations: 81.004 and 81.7312 %, as well as leaching times: 40 and 80 mins., and removed phosphorus concentrations: 0.478 and 0.481 respectively.
It is important to state that the deviation of model predicted results from that of the experiment is just the magnitude of the value. The associated sign preceding the value signifies that the deviation is a deficit (negative sign) or surplus (positive sign).
CONCLUSIONS
Empirical analysis of iron extraction was carried out based on removed phosphorus concentration and
leaching time of iron ore in hydrogen peroxide. A model was derived and used as a tool for the analysis. The validity of the derived model which is two-factorial nature was found to be rooted on the expression β + 2192 = - 0.0002 x2 - 9721γ2 + 0.0364 x + 9399.5γ where both sides of the expression are correspondingly approximately equal. Statistical analysis of the extracted iron concentration as obtained from derived model and experiment for each value of the leaching time and concentration of removed phosphorus considered shows standard errors of 0.3652 & 0.4090% and 0.1047 & 0.1718% respectively. Furthermore, Iron extractions per unit concentration of removed phosphorus as well as per unit leaching time as obtained from derived model-predicted and experimental results were 230.225 & 210 as well as
0.023 & 0.021 %/mins. respectively. Deviational analysis indicates that the maximum deviation of the
model-predicted iron extraction (from experimental results) is less than 3%, implying an operational confidence level above 97%.
REFERENCES
Alafara, A. Baba, D., Adekola, F. A., Folashade, A. O. (2005). Quantitative Leaching of a
Nigerian Iron Ore in Hydrochloric Acid, J. Appl. Sci. Environ. Mgt. 9(3):15 - 20
Ambikadevi, V. R.., Lalithambika, M. (2000). Effects of Organic Acids on Ferric Iron Removal from
Iron-Stained Kaolinite. Applied Clay Science, 16:133-145.
Chiarizia, R., Horwitz, E. P. (1991). New Formulations of Iron Oxides Dissolution. Hydrometallurgy,
27:339-360. Chime, T. O. (2012)
IJSER © 2013 http://www.ijser.org
International Journal of Scientific & Engineering Research, Volume 4, Issue 8, August-2013 1884
ISSN 2229-5518
Nwoye, C. I., Obasi, G. C., Mark, U., Inyama, S., Nwakwuo, C. C. (2009a). Model for Calculating the Concentration of Leached Iron Relative to the Final Solution Temperature during Sulphuric Acid Leaching of Iron Oxide Ore. New York Science Journal, 2(3):49-54.
Nwoye, C. I. (2008). C-NIKBRAN: Data Analytical Memory
Nwoye, C. I., Amara, G. N., and Onyemaobi, O. O. (2008). Model for Evaluating Dissolved Iron during Leaching of Iron Oxide Ore in Sulphuric Acid Solution, Inter. J. Nat. Appl. Sc., 4(2): 209-
211.
Nwoye, C. I., Ofoegbu, S. U., Obi, M. C., Nwakwuo, C. C. (2009b). Model for Predictive
Analysis of the Concentration of Dissolved Iron Relative to the Weight Input of Iron Oxide Ore and
Leaching Temperature during Sulphuric Acid Leaching. Nature and Science Journal. 7(3):41-47. Nwoye, C. I. and Ovri, J. E.O. (2010). Model for Calculating the Concentration of Dissolved Iron
Relative to the weight-input of Iron Oxide Ore and Final Solution pH during Nitric acid leaching,
Journal of Engineering Science and Technology, 5(2):151-164
Nwoye, C. I., Nwobodo, C. S., Nlebedim, C., Nwoye, U. C., Umana, R., and G. C. Obasi (2009c).
Model for Predicting the Concentration of Iron Dissolved during Nitric Acid Leaching of Iron
Oxide Ore in Oxalic Acid Solution, New York Science Journal, 2(6):1-12.
Nwoye, C. I., Mbuka, I. E. (2011). Model for Calculating the Concentration of Dissolved Iron Relative to the Final Solution pH and Temperature during Oxalic Acid Leaching of Iron Oxide Ore. Journal of American Science, 7(1):12-18.
Sidhu, P. S., Gilkes, R. J., Cronell, R. M., Posner, A. M., Quirk, J. P. (1981). Dissolution of Iron
Oxides and Oxydroxides in Hydrochloric and Perchloric Acids. Clays Clay Minerals, 29:269-276. Taxiarchour, M., Panias, D., Doumi, I., Paspaliaris, I., Kontopoulos, A. (1997). Removal of Iron
from Silica Sand by Leaching with Oxalic Acid, Hydrometallurgy, 46: 215-227.
IJSER © 2013 http://www.ijser.org