with a loss of power that will create some effect on the
efficiency of the transmission line. The corona power loss, has the value
2. Inadequate Size of Conductors of Distribution lines.
International Journal of Scientific & Engineering Research, Volume 6, Issue 4, April-2015 1108
ISSN 2229-5518
Electric Power Transmission and Distribution Losses Overview and Minimization in Pakistan Shahzad Sarwar Bhatti1, Engr. M. Umair Umer Lodhi2, Shan ul Haq3
Engr. Syed Nasir Mehdi Gardezi3, Engr. Muhammad Ahsan Javaid3, Engr. M Zeeshan Raza3, Engr. M. Imran Umer Lodhi4
Abstract— Availability of electric power has been the most powerful source for assisting economic, industrial and social developments of any state. Electric power is transferred by means of transmission lines which deliver bulk of power from generating stations to load centers and consumers. Studying the various types of loses uncounted during electrical transmission .The losses are either Technical losses or Non-technical Losses. The technical losses consist of the Corona loss, Joule effect, Magnetic Losses and skin effect. W hile the Non- technical (commercial ) losses include, theft of electricity, vandalism to electrical substations, poor meter reading, poor accounting and record keeping, etc. For electric power to get to the final consumers in proper form and quality, transmission and distribution losses along the lines must be reduced to the barest minimum.
Index Terms— Technical Losses, Energy, Power Losses, T & D Losses, NTDC, PEPCO, NEPRA, DISCOs, Advance Metering, HVDC
—————————— ——————————
nergy is a basic necessity for the economic development of the nation. There are different types of energy, but the most important type is the
electrical energy. A contemporary and educated society is
so much reliant on the use of electrical energy. Tasks, which
relates to the generation of electricity, transmission and distribution of electricity have to be assign the highest importance in the national planning procedure of any nation because of the importance of electrical energy to the economic and social development of the society. Power plants’ planning in a way to meet the power network load demand is one of the most important and essential issues in power systems. As we know that transmission lines connect generation plants and substations in power network, the exploration, calculation and decrease of transmission and distribution losses in these power networks are of great concern to electrical engineers.
This difference between the generated and distributed units is known as Transmission and Distribution loss.
Distribution Sector considered as the weakest link in the entire power sector. Transmission Losses is approximate
17% while Distribution Losses is approximate 50%.
Transmission and Distribution Losses are categorized into two types.
1. Technical Losses
2. Non-Technical Losses (Commercial Losses)
The technical losses produces because of energy dissipated in the conductors, equipment used for transmission line transformer, sub transmission line and distribution line and magnetic losses in transformers.
Technical losses are normally 22.5%, and directly depend
on the network characteristics and the mode of operation. Technical losses are further divided into two types.
• Fixed losses do not differ according to the current. These losses adopt the form of heat and noise and occur as long as a transformer is energized.
• Between 1/4 and 1/3 of technical losses on
distribution networks are permanent losses. And these
losses on a network can be influenced in the ways set out below.
• Corona Losses.
• Leakage Current Losses.
• Dielectric Losses.
• Open-circuit Losses.
• Losses produced by continuous load of measuring
elements.
• Losses produced by continuous load of control
elements.
Variable losses vary with the amount of electricity distributed and are, more accurately, proportionate to the square of the current. Therefore, a 1% increase in current leads to an increase in losses of more than 1%.
• Between 2/3 and 3/4 of technical (or physical)
losses on distribution networks are variable Losses.
• By increasing the cross sectional area of lines and cables for a specified load, losses will decrease. This leads
IJSER © 2015 http://www.ijser.org
International Journal of Scientific & Engineering Research, Volume 6, Issue 4, April-2015 1109
ISSN 2229-5518
to direct trade-off between cost of losses and cost of capital expenses. It has been recommended that best average consumption rate on a distribution network that considers the cost of losses in its design could be as low as 30 per cent.
• Joule losses in each voltage level.
• Impedance losses.
• Losses caused by contact resistance.
Amongst several reasons of T &D losses, some important reasons are described below;
1. Lengthy Distribution lines.
The value of the ohmic power loss, is given as
𝐿𝑜ℎ𝑚𝑖𝑐 = 𝐼2 𝑅𝐾𝑊 / 𝐾𝑚 / 𝑃ℎ𝑎𝑠𝑒
Where
𝐼 Indicates current along the conductor.
𝑅 Indicates resistance of the conductor.
The formation of corona on transmission line is associated
with a loss of power that will create some effect on the
efficiency of the transmission line. The corona power loss, has the value
2. Inadequate Size of Conductors of Distribution lines.![]()
𝐿𝐶𝑜𝑟𝑜𝑛𝑎 = 242 (𝑓 + 25) 𝛿
2 −5
3. Installation of Distribution transformers away from load![]()
� . �(𝑑
). (𝑉 − 𝑉𝑜 ) . 10
𝐾𝑊
centers.
4. Low Power Factor of Primary and secondary distribution
Where
/ 𝐾𝑚 / 𝑃ℎ𝑎𝑠𝑒
system. In most LT distribution circuits normally the Power
Factor ranges from 0.65 to 0.75. A low Power Factor gives towards high distribution losses.
5. Bad Workmanship which contributes significantly role towards increasing distribution losses.
6. Power utilization of customer fluctuates during the day
and over seasons. Load variation is Called load factor and it varies from 0 to 1.
7. Distribution transformers use copper conductor
windings to induce a magnetic field into a grain-oriented silicon steel core. So, transformers have both load and no- load core losses.
𝑓 Denotes the frequency of transmission,
𝛿 Denotes the air density factor,
𝑟 Is radius of the conductor,
𝑑 Denotes the space between the transmission lines,
𝑉 Is the operating voltage and
𝑉𝑜 Denotes the disruptive voltage.
Taking the total power loss on transmission lines to be the
summation of ohmic and corona losses, we have
𝑇𝐿𝑜𝑠𝑠 = 𝐿𝑜ℎ𝑚𝑖𝑐 + 𝐿𝐶𝑜𝑟𝑜𝑛𝑎
i.e.
𝑟
8. Unequal load distribution among three phases in L.T
system causing high neutral currents.
9. Leaking and loss of power.
10. Over loading of lines.![]()
![]()
𝑇𝐿𝑜𝑠𝑠 = 𝐼2 𝑅 + 242 (𝑓 + 25) 𝛿 . �(
). (𝑉 − 𝑉𝑜 )2. 10−5 𝐾𝑊
/ 𝐾𝑚 / 𝑃ℎ𝑎𝑠𝑒
11. Abnormal operating conditions at which power and distribution transformers are operated
12. Low voltages at consumer terminals causing higher
The general form of equation (4) is given by![]()
𝑇𝐿𝑜𝑠𝑠 = 𝑙2 + 242 (𝑓 + 25) 𝛿
drawl of currents by inductive loads.
13. Poor quality of equipment used in agricultural pumping
in rural areas, air-conditioners, coolers and industrial load in urban areas.
𝐴
Where![]()
� . ��
𝜋𝑑2
� . (𝑉 − 𝑉𝑜 )2. 10−5 𝐾𝑊
/ 𝐾𝑚 / 𝑃ℎ𝑎𝑠𝑒
The main reason for losses in transmission and distribution lines is the resistance of conductors against the flow of current. The creation of heat in conductor as a result of the flow of current increases more temperature in it. This increase in the conductor's temperature further increases the resistance of the conductor and this will therefore rise the losses. This indicates that ohmic power loss is the main component of losses in transmission and distribution lines.
𝜌 Is the resistivity of the conductor,
𝐿 Denotes the length of the conductor and
𝐴 Denotes the cross-sectional area of conductor.
Pakistan’s energy shortage has become the most pressing economic challenge. This is not to say the country’s other structural insufficiencies have been resolved, but simply that the scope of this problem is now so widespread that
IJSER © 2015 http://www.ijser.org
International Journal of Scientific & Engineering Research, Volume 6, Issue 4, April-2015 1110
ISSN 2229-5518
quick-fixes will no longer allow the economy to move forward.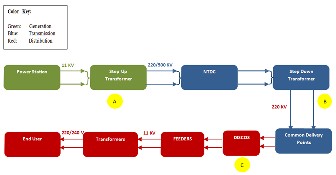
Fig. 1: Power Network in Pakistan.
Loss of energy between point A and point B is technically called “transmission losses”. Previously, National Electric Power Regulatory Authority (NEPRA) allowed National Transmission and Dispatch Company (NTDC) to permit up to 2.5 percent for transmission losses in end-user tariffs. NTDC breached this limit for years and amazingly, rather than asking NTDC to resolve the issue, NEPRA increased the allowable allowance to 3.0 percent in September 2013. Loss of energy from point B onward is called “distribution losses”. NEPRA allows up to 10 percent loss (as distribution losses) in determining end-user charges, it is relevant to comment here, that in this era of technological development, there is no sources in Pakistan of receiving meter readings at point B and C in real time.
PAKISTAN has a extraordinary rate of electric transmission and distribution losses and is ranked the top 14th among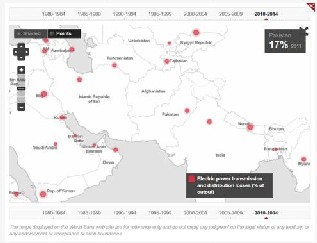
131 countries.
Fig. 2: Percentage of T & D losses Pakistan.
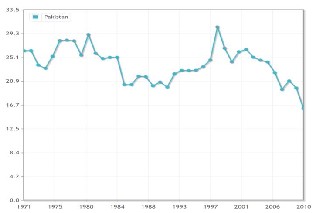
In below figure, the statistics of losses in transmission and distribution is shown from 1971 to 2010 according to World Bank analysis.
Fig. 3: Pakistan’s T & D losses yearly graph.
And during years, 2012-2013 losses in transmission and distribution is clearly described in below figure, according to PEPCO Power Market Survey Report 2012-13.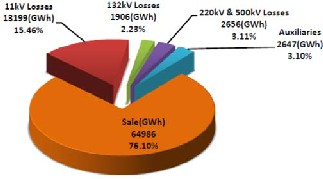
Fig. 4: Historical T & D losses with sale and auxiliary consumption
While the world average is 8.8, transmission and distribution (T&D) losses in the range of 6-8 per cent of energy generated are considered normal.
Another point to flag is that NEPRA recommends a tariff structure that rewards efficient Discos and corrects more ineffective ones, to incentivize the latter to reduce T&D losses. Technically, the entire T&D loss is covered by NEPRA allowed tariffs in Discos, posting less than 10 percent losses (efficient Discos), while Discos making more than 10 percent losses, which are enforced to carry these on their records. However, the unified tariff structure notified by the federal government, neglects this encouragement; as a result, the combined losses of the Discos have to be borne by the federal government.
IJSER © 2015 http://www.ijser.org
International Journal of Scientific & Engineering Research, Volume 6, Issue 4, April-2015 1111
ISSN 2229-5518
whole world’s T & D losses, that all the countries are bearing is also shown in graph from 2005 to 2011.
Based on the work performed by the New York utilities, EPRI, and SAIC, as well as reviews of other industry studies, electric losses can be reduced by system improvements both on the transmission and distribution systems. Generic or case-specific cost/benefit analysis is required to justify required expenditure for these system improvements.
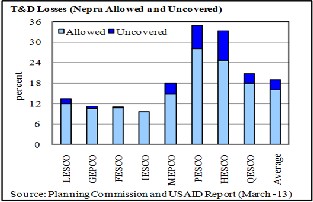
Fig. 5: T & D losses allowed and uncovered by NEPRA
Beyond the inefficiency at the generation stage, the main Discos do not fare too well in terms of transmission & distribution (T&D) losses (Figure 5). The T&D losses in Pakistan’s main power distribution centers varies from 9.5 to 35.1 percent; in overall terms, Pakistan’s T&D losses are well above the global average, even for developing countries. High T&D losses in Pesco can be explained by the fact that this Disco also supplies power to the FATA region, where theft is high because the distributor is unable to monitor and charge individual users.11 On the other hand, Iesco that serves Islamabad and Rawalpindi, posts the smallest T&D losses.
Reducing the T&D losses, or achieving energy efficiency, must be the highest priority energy strategy. A number of policy assessments, technical and administrative actions can be taken by the government to reduce power losses, mainly with extra investments in improving T&D infrastructure and increased operational and management efficiencies—from generation to the end-use.
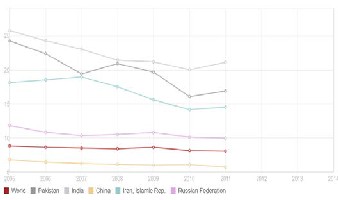
Fig. 6: Comparison of T & D losses of Pakistan vs. different countries.
In above graph, there is a comparison of transmission and
distribution losses of Pakistan with other countries i.e. India, China, Iran and Russia analyzed by World Bank. The
1. Optimization of existing controls for transformer taps, generator voltages, and switched shunt capacitor banks reduces current flow and minimizes losses.
2. Addition of shunt capacitor banks, fixed and switched, at points on the system closest to the reactive load source reduces current flow and minimizes losses.
3. Phase balancing reduces line and neutral conductor losses.
4. Distribution capacitor banks on the feeders to improve
the feeder power factor reduce line losses.
5. Capacitor banks at or near the substation improve the station power factor caused by the substation power transformer VAR requirement, measured at the high side of the power transformer and reduce load losses in the substation transformer.
6. Use of life-cycle evaluation for equipment sizing (initial
installation of distribution transformers and conductors)
reduces transformer core and coil losses.
The electric system grid is dynamic in nature, with constantly evolving technology improvements and enhancements. One consideration for power systems is the impact on losses from technological advancements. The following discussion describes the impact that new technologies could have on losses in transmission and distribution systems.
As data from advanced metering becomes integrated in the utility’s infrastructure, at both the feeder and substation level, as well as the customer level, the load data can be directly assigned to the computer simulation model. In addition, hourly data, including kW and kvar, can be used to calculate energy and peak system losses. This method can produce more precise results by eliminating
IJSER © 2015 http://www.ijser.org
International Journal of Scientific & Engineering Research, Volume 6, Issue 4, April-2015 1112
ISSN 2229-5518
estimations of load allocation and provide added granularity in the results.
An emerging trend being considered is high-voltage direct current (HVDC) lines because of some of the advantages in efficiency. According to an ABB study, HVDC lines provide
25 percent lower line losses, two to five times the capacity
of AC lines at similar voltages, and the ability to precisely control the flow of power.
Historically, the costs have been too high for most
transmission operators to consider HVDC as an option, except in a few long-distance applications. However, with technological improvements and more economical options becoming available, HVDC may be considered more feasible in the near future.
Gas-insulated substations are a possible solution to help reduce losses. Typical substations occupy large tracts of land and are located outside of dense load areas. As a result, lower-voltage lines from substations can go quite a distance before reaching load centers, which increases losses. Gas-insulated substations are encapsulated, with all equipment inside a metal housing, and can be contained in a basement or building close to the load center, which would help in the reduction of losses.
From the above discussions it is found that there are various factors responsible for T & D losses which need to be eliminated. The approaches taken by government over the years in Pakistan has created an inefficient distribution system having very high T & D losses and poor quality and reliability of power supply to consumers. In the ongoing power sector reforms, the focus has rightly been shifted to upgrading the transmission and distribution (T & D) system and improving its efficiency to reduce these losses. To perform this, new technologies should be implemented to reduce losses i.e. advance metering, HVDC, gas- insulated substations. These technologies are implemented in developed countries like China and United States. Finally, this may contribute in the process of overall national development.
Special thanks to Engr. M. Umair Umer Lodhi for arranging a visit for us to grid station and providing us a closer look at transmission system in Pakistan.
[1] PEPCO Power Market Survey Report 2012-13, http://www.ntdc.com.pk/planning.php
[2] State Bank of Pakistan Annual Report 2013–14 http://www.sbp.org.pk/reports/annual/arFY14/Energy.pdf
[3] Engr. Alumona T. L, Nwosu Moses. O, Ezechukwu A. O, Chijioke Jonah, “Overview Of Losses And Solutions In Power Transmission Lines”, Network and Complex Systems, ISSN 2225-0603, Vol.4, No.8,
2014
[4] Total Losses in Power Distribution and Transmission Lines
http://electrical-engineering-portal.com/total-losses-in-power- distribution-and-transmission-lines-1
[5] World bank Indicators http://data.worldbank.org/indicator/EG.ELC.LOSS.ZS/countries?displa y=map
[6] Electric power transmission and distribution losses (% of output) http://www.indexmundi.com/facts/indicators/EG.ELC.LOSS.ZS/compa re?country=pk
[7] No reduction in electricity T&D losses http://www.dawn.com/news/731058/no-reduction-in-electricity-td- losses
[8] M.O. OKE, O.M. BAMIGBOLA, Ado – Ekiti, “Minimization of Losses on Electric Power Transmission Lines”, Mathematical Theory and Modeling. (www.iiste.org) ISSN 2224-5804 (Paper) ISSN 2225-
0522 (Online) Vol.3, No.7, 2013
[9] ABB, “Energy Efficiency in the Power Grid”, 2012;
http://www.abb.com/cawp/seitp202/64cee3203250d1b7c12572c8003b2b
48.aspx
[10] Assessment of Transmission and Distribution Losses in New York http://www.nyserda.ny.gov
[11] Soham Ghosh, “Loss Reduction and Efficiency Improvement: A Critical Appraisal of Power Distribution Sector in India”, International Journal of Modern Engineering Research (IJMER), Vol.2, Issue.5, Sep- Oct. 2012 pp-3292-3297 ISSN: 2249-6645
[12] Anyaka Boniface Onyemaechi, Olawoore Olaoluwa Isaac, “Minimization of Power Losses in Transmission Lines”, IOSR Journal of Electrical and Electronics Engineering (IOSR-JEEE), e-ISSN: 2278-
1676,p-ISSN: 2320-3331, Volume 9, Issue 3 Ver. III (May – Jun. 2014), PP 23-26.
1. Institute of Communication Technologies (ICT), Isb. ssbhatti.engr@gmail.com
2. SDO 500Kv, Transmission Line, NTDCL, Multan.
3. NFC Institute of Engineering & Technology, Multan
4. SDO, Multan Electric Power Company, Multan
IJSER © 2015 http://www.ijser.org