International Journal of Scientific & Engineering Research, Volume 3, Issue 11, November-2012 1
ISSN 2229-5518
Efficient Use of Wireless Sensors for Data
Collection in Precision Irrigation
1M. Marimbi, 1M. Munyaradzi,1B. M. Nyambo, 2E. Mashonjowa
1 Computer Science department, 2Physics department
University of Zimbabwe, Harare, Zimbabwe
bromishmars@gmail.com, mmunyaradzi@science.uz.ac.zw, nyambo@science.uz.ac.zw, emashonjowa@gmail.com
Abstract—This paper looks at how to optimize data collection from the wireless sensor nodes and analysis of this data for an efficient irrigation scheduling in order to optimize water usage. In this research we design a model system which integrates op- timum node placement and data aggregation to see the combined effect on the efficiency of the wireless sensor network (WSN ) that is in terms of latency, power consumption and utilization, network life span (i.e. node mortality). Issues looked into includ- ed the optimum placement of the sensor nodes, traffic aggregation and protocols for cooperative data forwarding. Models of different topologies were designed and evaluated through simulations to come up with the best model that achieves optimum placement to minimize the number of nodes without compromising on the readings as well as incorporating data forwarding and aggregation. The model was cost effective as it displayed significant improvement in efficiency, power utilization, consump- tion, network lifetime and can be adopted for ordinary farmers in developing countries like Zimbabwe.
Index Terms— Wireless Sensor nodes, optimal node placement, data aggregation, power utilization, performance modeling, ZigBee
1 INTRODUCTION
—————————— ——————————
rom the 1980s to present wireless sensor technology has evolved immensely, which have resulted in a new gen- eration of inexpensive compact sensors based on a number of high-density technologies. Advances in IEEE
802.11a/b/g-based wireless networking and other wireless systems such as Bluetooth, ZigBee and WiMax are now facilitating reliable and ubiquitous connectivity [12]. Inex- pensive processors that have low power-consumption re- quirements make possible the deployment of sensors for a plethora of applications. Commercially-focused efforts are now directed at defining mesh, peer-to-peer, and cluster- tree network topologies with data security features and interoperable application profiles [2]. Our study looked at the effect of different topologies on the efficiency of WSN and also it’s combined effect with data aggregation. Our major drive was the application of these WSN technologies in precision irrigation. We envisage a situation where WSN are used to gather field data which can be used for calculat- ing the evapotranspiration and irrigation is done to replace lost water without human intervention. A lot of research has been conducted in this field. For example, in the field of crop monitoring, wireless sensors have been developed to gather data on leaf temperature, chlorophyll content and plant water status. Based on these data, farmers are able to detect problems at an early stage and implement real-time solutions. The major limitation of the WSN networks is their dependency on battery power so efforts have been made to come up with WSN with high energy efficiency, culminating in the thrust on node placement and data ag- gregation techniques that try to reduce network load by
eliminating redundancy.
In this research we designed a model system which inte-
grates optimum node placement and data aggregation to
see the combined effect on the efficiency of the WSN that is
in terms of latency, power consumption and utilization,
network life span i.e. node mortality .Optimum placement
whether dynamically or statically has equal advantages of
maximizing network lifetime, improving network efficien-
cy, reduce number of sensors to be used and increase the
coverage thereby improving data collection which in turn
would have a direct impact on the level of precision in our
precision irrigation system.
2 LITERATURE REVIEW
2.1 Introduction

A lot of research in wireless sensor networks use in auto- mated irrigation has been done already. A wireless solution for intelligent field irrigation system dedicated to Jew’s ear planting was developed in Lishui, Zhejiang, China in 2009. Instead of conventional wired connection, the wireless de- sign made easy installation and maintenance. The hardware architecture and software algorithm of wireless sen- sor/actuator node and portable controller, acting as the end device and coordinator in ZigBee wireless sensor network respectively, were elaborated in detail. It was based on Zig Bee technology, but was not implemented on large scale [19].
In [19], Feliciano et al developed a conceptual model of an
IJSER © 2012
http://www.ijser.org
International Journal of Scientific & Engineering Research, Volume 3, Issue 11, November-2012 2
ISSN 2229-5518
automated irrigation system. They developed a prototype automated irrigation system using wireless modules and in situ root zone soil moistures, capacitance sensors, electro- mechanical and temperature sensors .The wireless sensors were deployed throughout the greenhouse and root zone data was transmitted to a computer control system.
The researchers in [7] designed a model wireless sensor based system with 6 SM200 soil moisture sensors ,3 repeat- ers and a gateway connected to a PC.Mesh topology which supports multipath communication and hence more relia- ble ? was used. The nodes were able to relay data to a re- peater over a 20m distance, but the desired maximum data loss of 5% could not be fulfilled. Battery life, remote access and internet data transport worked well. The system’s weak points were signal losses, sensor performance, high cost and packaging.
Delta T Devices (UK), Netafim (IS), Decagon (US) and
Crossbow (US) are among the major suppliers of wireless
sensor equipment and were very active in the WSN re-
search. However the equipment is still expensive and uses a
lot of energy to overcome the variable damping of electro-
magnetic waves in crops under fluctuating weather condi-
tions [7].
In [20], Zhang, et al proposed a WSN for precision agricul-
ture using Bluetooth. Although challenges such as battery
life and transmission latency exist in his application, his
work gives hopes for the future of WSN in agriculture ap-
plications [16].
In [1], Abhinav V. et al designed a protocol which they
named Distributed Sensor Webs Routing Protocol (DSRP)
and a WSN system which they implemented to monitor
water status and control irrigation for ornamental crops.
However, this system was developed for compatibility with
EM50 data loggers of Decagon Devices Inc which poses a
question of compatibility with other devices from different
vendors.
Most research about the use of WSN in the field of preci-
sion agriculture and horticulture has so far been carried out
in Australia and North America [10].
A number of publications confirm that at the current stage
WSN are not reliable enough, cannot withstand outdoor
climatic conditions, lose communication, are not fault toler-
ant and use too much power despite the fact that a lot of
research has been carried out to address these different is-
sues. This unreliability is caused by many factors which
range from the sensor hardware, software, network infra-
structure, protocols. If it’s in precision irrigation where
data about the field is needed for scheduling and decision
making , we see more dependency on the data collection
(i.e. how efficient and accurate is the data collected). Thus
our main thrust for this research was to focus on efficient
data collection for effective irrigation management and wa-
ter conservation as well as improving on our yield.
In [10] they also confirmed that although automating irri-
gation is easy, automated systems are not necessarily water
efficient. This seems to be true because automation is fully
dependant on the collected data from the sensors, and there
are many factors which can affect the efficient collection of this data which starts from the sensor itself, the network or transmission medium, necessary calculations and pro- cessing of the data, and placement of the sensor nodes in the network etc.
Since battery powered equipment are more favourable, there is need for both equipment and communication pro- tocols improvement so as to conserve energy and increase reliability under outdoor agricultural conditions.
Since we are looking forward to implementation of these systems in large scale agriculture, we need to subdivide the field into regions, taking note of the soil type and any rele- vant data that might help us in our decision making during scheduling for us to get more accurate readings and hence more precise irrigation. FLOW AID for example, made a Decision Support System (DSS) and then used this method [6]. They divided the land into plots and then measured amount of water used against soil type, water availability and yield. They used the 866-868 MHz frequency band for the sensors.
2.2 Data Aggregation
Because of power and transmission range limitations, data dissemination in sensor networks is typically carried out as a collective operation, in which sensors collaborate to get data from different parts of the sensor network to the in- formation sinks. One way of performing power-efficient data collection in sensor networks is to process the data as it flows from information sources to sinks. This technique is commonly referred to as (in-network) data aggregation and can be quite effective at conserving power [4]. Data aggre- gation tries to minimize traffic load (number/length of packets) through eliminating redundancy. In this study we adopted the duplicate suppression algorithm and directed diffusion paradigm. [13], [16], [9].
Let di be the shortest distance from the source Si to the sink in the graph. As per datum the total transmissions needed for Random source model NR is:
N = 𝑑 + 𝑑 + 𝑑 + ⋯ 𝑑 = �𝑢�(𝑑 ) (1)
Let the number of transmissions needed for optimal source
model be 𝑁 .
Then 𝑁 ≤ 𝑁 must hold for it to be better. [8]
Proof:
Doing data aggregation optimally decreases the minimum
number of edges needed compared to when the sources
send information only using the shortest path.
Definition: let X be the diameter of a set S of nodes in a
graph G.
If the source nodes 𝑆 , 𝑆 , 𝑆 … . . 𝑆 have 𝑋 ≥ 1 a diameter the total number of transmissions𝑁 required for optimal
data aggregation satisfies the following bounds:
𝑁 ≤ (� − 1)𝑋 + min(𝑑 ) (2)
𝑁 ≥ (� − 1)𝑋 + min(𝑑 ) (3)
Proof: (2) by constructing a data aggregation tree which
consists of (� − 1) sources sending packets to the remaining
IJSER © 2012
http://www.ijser.org
International Journal of Scientific & Engineering Research, Volume 3, Issue 11, November-2012 3
ISSN 2229-5518
source which is nearest to the sink. This tree has no more than
𝑁 ≤ (� − 1)𝑋 + min(𝑑 ) , edges hence optimum tree must have no more than this.
Definition: Fractional energy saving (FS) in Optimal Source model
and data aggregation was carried out in the quest of trying to address the problem of efficient data collection which is dependent on the efficiency of the whole network. Many deterministic topologies (i.e. star, ring, mesh, kite, linear, pentagonal and some irregular ones) were designed and tested under simulation using OMNeT 4.2.1 simulator. The parameters which we used to test efficiency were latency, as data is propagated from all the sources to the sink. While
𝐹𝑆 = (𝑁 − 𝑁 )⁄(𝑁 )
0 ≤ 𝐹𝑆 ≤ 1 (4)
many published papers aim at maximizing the lifetime, our aim was to maximize utilization efficiency and coverage for
The upper and lower bounds of FS derived from (2) and (3)
are:
optimum data collection.
3.1 Experiment setup
𝐹𝑆 ≥ 1 − ((� − 1)𝑋 + min(𝑑 ))⁄�𝑢�(𝑑 )
𝐹𝑆 ≥ 1 − (min(𝑑 ) + (� − 1)⁄�𝑢�(𝑑 )
(5) (6)
Using OMNeT 4.2.1 simulator, different topologies were simulated, taking note of their effect on the network life-
Assume that all the sources are at the same shortest path distance from the sink i.e.
min(𝑑 ) = max(𝑑 ) = 𝑑
Then we have:


1 − (( ) ) ≤ FS ≤ 1 − ( ) (7)
lim 𝐹𝑆 = 1 − 1⁄�
Sensors monitor the events of interest and send them to a
gateway node where the end user can access it. Due to
power limits and hardware constraints every sensor has a
sensing range of r km and a communication range of 2r km.
Sensor placement is according to their distance from the
gateway node.
Let 𝑆 … . … . . 𝑆 be the number of sensors, where S1 is closest
to the gateway node and SN is furthest from the gateway
node. 𝑆 is the � sensor from the gateway node. Sensor
placement
{𝑑 }𝐼 = 𝐼 According to distance between adjacent sensors
𝑑 should satisfy the following constraints:
i. 0 < 𝑑 ≤ �
ii. 0 < 𝑑 ≤ 2�
iii. for 2 ≤ � ≤ 𝑁 − 1
iv. c0 < 𝐿 − ∑ 𝑑� < � [8]
Yunxia Chen et al proposed a new performance metric,
called lifetime per unit cost, to measure the utilization effi-
ciency of sensors. Optimum placement whether dynamical-
ly or statically has equal advantages of maximizing net-
work lifetime, improving network efficiency, reduce num-
ber of sensors to be used and increase the coverage thereby
improving data collection, which in turn would have a di-
rect impact on the level of precision in our precision irriga-
tion system [8].
3 METHODOLOGY
An investigation into two aspects, namely node placement
time and also delays in packet propagation between nodes
as data was transmitted to the sink. This data was then used
to determine the best node placement and topology based
on the improved lifetime and reduced delays in packet
propagation between hops.
We assumed that the routing technique used is no-trivial and the network has no other constraints affecting it like transmit power and strength of the sensors. The perfor- mance parameters considered in this research were energy saving, delay, robustness, network lifetime and network performance
On energy saving, it is important to note that, aggregating information coming from sources reduces the number of transmissions, which in turn saves energy. The delay or latency associated with data aggregation as data from near- er sources is held at aggregators waiting for data from far sources in order to combine them.
Since energy is saved there is a decrease in marginal energy cost of connecting additional sources to the sink. This pro- vides some degree of robustness to the sensed phenomena. Network lifetime is a measure of the expected energy dissi- pation rate which determines how long the network will run perfectly before the nodes run out of power. Network Performance is measured as the number of events pro- cessed per second. It will be used also to evaluate the to- pology’s efficiency.
3.2 Data aggregation
We chose the best network topology from the ones we de-
signed and compared it with a random control topology
both with aggregation and then without aggregation under
simulation.We analyzed the analytical bounds of the energy
cost and savings brought by data aggregation and found
out that the greatest gains are obtained when the sources
are close together and far away from the sink.
IJSER © 2012
http://www.ijser.org
International Journal of Scientific & Engineering Research, Volume 3, Issue 11, November-2012 4
ISSN 2229-5518
4 RESULTS AND DISCUSSION
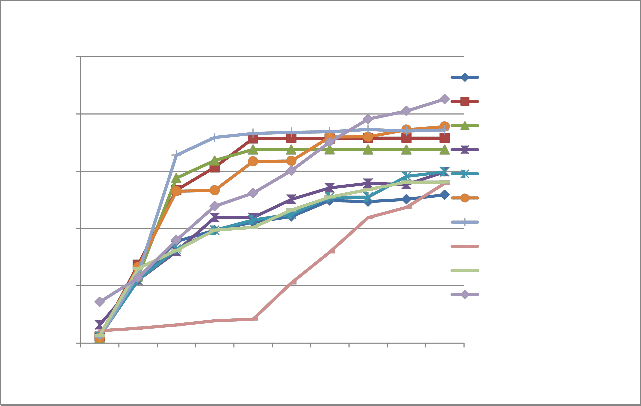
Figure 2 shows delay in ms versus number of hops for dif- ferent node placement topologies. Analyzing Figure 2 shows that linear topology is very good for short distances between source and sink i.e. the number of hops are few so it will be ideal for small areas of less than 10 sensors per
1000 m2. Pentagonal and Topology 1 are almost the same in delays but pentagonal gets poorer as the network size in- creases. Graph also shows field coverage for pentagonal was not in any way better than topology 1.
Topology 2 and 3 increases delays up to 5 hops and then
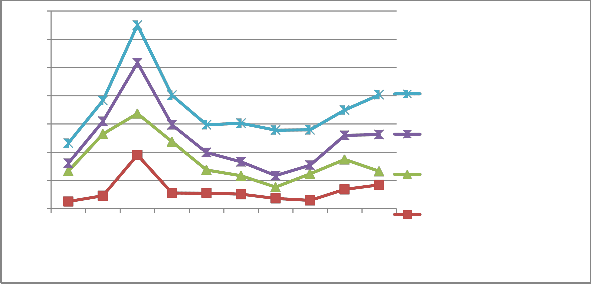
Mesh shows gradual increase in delays as network size in- creases and also as routing table increases and becomes more complex due to many routes to be considered for packet forwarding, more energy will be needed . Mesh is advantageous if we’re only concerned with coverage, and non battery powered wireless networks. The delays for all the topologies increases as the network size increases which means as the network increases there are many bottle necks which come into play, it also shows that the topology itself influence network performance and behavior. Figure 3 shows the efficiency of topology with and without aggrega- tion as a timeline. We observe from Figure 3 that for both topologies the one with data aggregation has better effi- ciency than without .We also observe that optimal topology has more efficiency than the control topology. This brings us to the conclusion that data agregation is ideal for im- proved network performance and resource conservation in WSN.
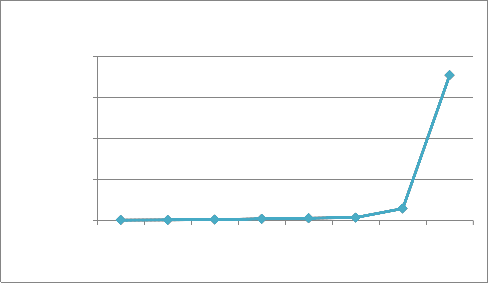
We can observe from Figure 4 that both topologies with data aggregation have lower power utilization than with- out. This is due to the fact that data aggregation reduces network load by eliminating redundancy which degrades the performance of the network by increasing collisions, delay, and energy consumption thereby minimizing trans- mission power [14]. In network processing of data con- sumes less energy than data transmission so we can capital- ize on that. We also investigated under simulation the high rate of death of nodes due to power dissipation and we can also observe that there is less death for up to 100 nodes per square km but for network sizes greater than that we see a
increase in network size becomes insignificant on delays for up to 10 hops, then gradually increases again. We also observed that these two topologies are less efficient than topology 1, topology 4, ring and pentagonal topologies. We see that for less than 10 hops linear topology (Bus) is ideal if we want to sacrifice coverage to network speed, but topolo- gy 1 is better as it has both good network performance and good coverage.
Pentagonal and Ring are also good but they also have one drawback, which is short fall of coverage yet we desire both network efficiency in terms of packets or data for- warding and sensing area coverage. This makes topology 1 ideal.
drastic decrease in network lifetime due to increased node mortality. As number of nodes increases connections be- tween nodes increases more routing and throughput re- quires more energy. Transmission distance increases there- by consuming more energy so that the nodes will lose en- ergy at faster rates [15]. Figure 6 shows that power con- sumption increases insignificantly up to 125 nodes per km2, but above that there is a sharp increase which is constituted by increased interference and in network processing be- tween nodes due to their density [14]
IJSER © 2012
http://www.ijser.org
International Journal of Scientific & Engineering Research, Volume 3, Issue 11, November-2012 5
ISSN 2229-5518
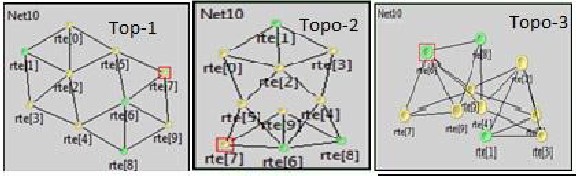
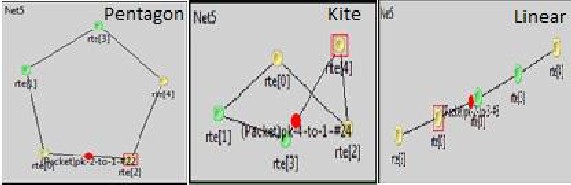
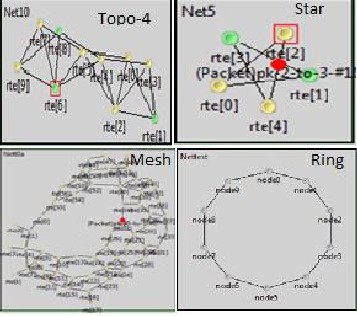
Figure 1: Topologies used in placing sensors in the field.
IJSER © 2012
http://www.ijser.org
International Journal of Scientific & Engineering Research, Volume 3, Issue 11, November-2012 6
ISSN 2229-5518
0.025
0.02
0.015
0.01
0.005
Node Placement Topologies
Topology 1
Topology 2
Topology 3
Topology 4
Ring Topology Star Topology Kite Topology Linear Topology
Pentagonal Topology
Mesh Topology
0
1 2 3 4 5 6 7 8 9 10
Hops
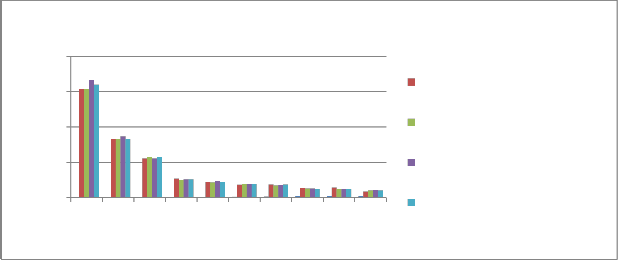
Figure 2: The relationship of delay of various node placement topologies with increase in network size.
200
150
100
50
0
Efficiency
1 2 3 4 5 6 7 8 9 10
time
Control topology with aggregation
Control Topology without aggregation
Optimal topology with aggregation
Optimal topology without aggregation
Figure 3: The efficiency of the optimal and control topologies with time.
IJSER © 2012
http://www.ijser.org
International Journal of Scientific & Engineering Research, Volume 3, Issue 11, November-2012 7
ISSN 2229-5518
70
Power utilisation
60
50
40
30
20
10
0
1 2 3 4 5 6 7 8 9 10
time
Topology without aggregation
optimal without aggregation Topology with aggregation Optimal with aggregation
Figure 4: The relationship of power utilization and time for the optimal and the control topologies, with and without aggrega- tion.
Nodes death
50
40
30
20
10
0
1 2 3 4 5 6 7 8
network size(nodes)
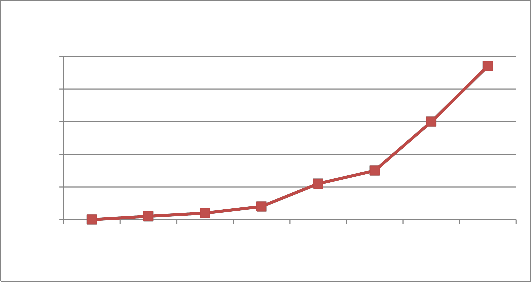
Figure 5: The number of deaths of nodes in relation to the increase in network size.
IJSER © 2012
http://www.ijser.org
International Journal of Scientific & Engineering Research, Volume 3, Issue 11, November-2012 8
ISSN 2229-5518
2000000
power consumption
1500000
1000000
500000
0
1 2 3 4 5 6 7 8
network size(nodes)
Figure 6: The relationship of power consumption with the size of network
CONCLUSIONS
This study shows that, as many wireless sensors detect the same event and try to forward the data to other nodes, data becomes redundant and degrades the performance of the net- work by increasing collisions, delay, and energy consumption. Data Aggregation techniques are used in some applications to reduce the redundancy in forwarded packets. In these tech- niques, packets are aggregated at intermediate nodes and the correlated data is forwarded from one node to another [14]. Also, as sensor nodes are energy constrained, energy efficien- cy is one of the primary concerns in trying to find suitable pro- tocols for these networks.
To enhance the packet-level reliability and reduce energy con-
sumption, we developed a reliable network topology which
incorporates data aggregation using directed diffusion and
duplicate suppression techniques. For WSN, many protocols
have been proposed that provide reliability and good trans-
mission ranges with low power consumption and we found
ZigBee protocol being the best technology to date. It has many
advantages which includes its portability, long range trans-
mission (up to 1 km), free frequency bands and scalability and
low prices. It is based on IEEE802.15.4 MAC and PHY and
have data rate up to 250kbps and provides 16 channels in the
unlicensed 2.4GHz band. It is supported with JN5148 wireless
microcontroller and modules.
Our simulation results show that node placement and data
aggregation techniques improve energy efficiency and the
packet forwarding even in large highly dense WSN. However,
latency tends to increase under congested scenarios because of
increase in collisions, delay, and energy consumption. In gen-
eral, an increase in latency would affect the performance of the
network.
In the future, we would like to extend our research into real
time hardware implementation of these Topologies and data
aggregation techniques.
REFERENCES
[1] Abhinav Valada, David Kohanbash, George Kantor. Design and Development of a Wireless Sensor Network System for Preci- sion Agriculture. Tech. report CMU-RI-TR-10-21, Robotics Insti- tute Carnegie Mellon University Pittsburgh Pennsylvania, June
2010
[2] Adekeyede A. Elusoji, A. U. Rufai, An overview of smart sensor technology. Academic Leadership Online Journal, vol. 9, issue 2, Mar 21 2011
[3] Amitabha Ghosh, Algorithmic Aspects of Throughput-Delay Performance ForFast Data Collection in Wireless Sensor Net- works, PhD thesis, USC Graduate School University Of South- ern California, August 2010
[4] Chong, Chee-Yee and Srikanta P. Kumar (2008). “Sensor Net- works: Evolution, Opportunities, and Challenges”, Proceedings of the IEEE, 91, 8, 1247-1256.
[5] Culler, D.D.Estrin and M.Srivastava (2007). “Overview of Sensor
Networks”, Computer, Washington, DC IEEE Computer Society
40-49.
[6] Hamid Barati, Ali Movaghar, Ali Barati, and Arash azizi mazre- ah.A Review of Coverage and Routing for Wireless Sensor Net- works World Academy of Science, Engineering and Technology
37 2008.13-14
[7] J Balendonk, J Hemming, B A J Van Tuij, L Incrocci, A Pardossi, P Marzialetti, Sensors and Wireless Sensor Networks For Irriga- tion Management under Deficit Conditions (FLOW AID),
2009.3-5
[8] Jamal N. Al-Karaki, Raza Ul-Mustafa, Ahmed E. Kamal: Data
IJSER © 2012
http://www.ijser.org
International Journal of Scientific & Engineering Research Volume 3, Issue 10, October-2012
ISSN 2229-5518
aggregation and routing in Wireless Sensor Networks: Optimal and heuristic algorithms. Computer Networks 53(7): 945-960 (2009)
[9] K.Ramanan and E.Baburaj, data gathering algorithms for wire- less sensor networks: a Survey, international journal of ad hoc, sensor & ubiquitous computing (ijasuc) vol.1, no.4, December
2010doi: 10.5121/ijasuc.2010.1410. 102
[10] Marc Van Lersel and Stephanie Bumett, Using water sensors for efficient irrigation in greenhouse, 2010.4-7
[11] R. Jordan, R. and Abdallah, C.A. (2009). “Wireless communica- tions and networking: an overview,” Report, Elect.And Comp. Eng. Dept., Univ. New Mexico.21-26
[12] Reberto, Localization in Mobile Wireless Sensor Networks,World Academy of Science, Engineering and Technology 63 2010.25-32
[13] Sungrae CHO, Proactive Data Filtering Algorithm for Aggrega- tion in Wireless Sensor Networks,IEICE TRANS. COMMUN., VOL.E91–B, NO.3 MARCH 2008.13
[14] U. Monaco, F. Cuomo, T. Melodia, F. Ricciato, M. Borghini, Un- derstanding optimal data gathering in the energy and latency domains of a wireless sensor network, Computer Networks 50
(2006) 3564–3584
[15] Vamsi Krishna Venkata Naga Nandanavanam, Energy-Efficient
Reliable Sensor-To-Sink
[16] Wei Han, Three-tier wireless sensor network infrastructure for Environmental monitoring Kansas State University Manhattan, Kansas 2011.70-71
[17] ZigBee_PRO_PB v1.2, NXP Laboratories UK Ltd 2010 1-2, http://pdf.directindustry.com/pdf/jennic/product-brief-jn5148- ek010-evaluation-kit/34237-183747.html (accessed 24 Sep 2012)
[18] Zhou Yiming , Xianglong Yang , Wang L, Yibin Ying, A Wireless Design of Low-Cost Irrigation System Using ZigBee Tecchnolo- gy. NSWCTC ’09 conference, 2009.
[19] Feliciano Cayanan, D., Dixon, M. and Zheng, Y. 2008. DEVEL- OPMENT OF AN AUTOMATED IRRIGATION SYSTEM US- ING WIRELESS TECHNOLOGY AND ROOT ZONE ENVI- RONMENT SENSORS. Acta Hort. (ISHS) 797:167-172 http://www.actahort.org/books/797/797_22.htm
[20] W. Zhang, G. Kantor, and S. Singh Integrated wireless sen- sor/actuator networks in agricultural applications. 2nd ACM In- ternational Conference on Embedded Networked Sensor Sys- tems (SenSys), page 317, Baltimore, Maryland, USA, Nov. 2004.
IJSER © 2012
http://www.ijser.org