International Journal of Scientific & Engineering Research, Volume 6, Issue 2, February-2015 140
ISSN 2229-5518
Effect the Beam Section Shape for Different Materials on Buckling Load Using Finite Element Method
Najah Rustum Mohsin1 Younis Fakher Aoda2 Raheem Abd Sayel3
1, 2 & 3 Southern Technical University, Technical Institute-Nasiriya, Mechanical Techniques Department
E-mail: 1 Najahr2000@yahoo.com 2younisfakher@yahoo.com 3raheemabed1960@gmail.com
Abstract— Buckling loads are critical loads where certain types of structures become unstable. So, this study focuses on finding the effect of the beam section shapeon buckling load using finite element software ANSYS R.15. The buckling loads for Rectangular (Rec.), U- channel (Uch.), Solid circle (Scir.) and Hollow circle (Hcir.) cross-section beams are calculated using Eigenvalue and Non-linear analysis for Carbon Steel, Titanium and Aluminum materials. A comparison made between the two methods and the different percentage is not exceeds of 0.27%. The results shows that the Buckling loads are strongly depend on the material properties and the beam shape geometry. Buckling loads are directly proportion with modulus of elasticity, thickness, outer to inner radius ratio and all beam geometry parameters except the beam length.
Index Terms : Buckling load, cross-section, ANSYS R.15, Eigenvalue analysis, Non-linear analysis, Euler.
—————————— ——————————
1 INTRODUCTION
Buckling is characterized by a sudden failure of a structural member subjected to high compressive stress, where the ac- tual compressive stress at the point of failure is less than the ultimate compressive stresses that the material is capable of withstanding. Mathematical analysis of buckling often makes use of an axial load eccentricity that introduces a secondary bending moment, which is not a part of the primary applied forces to which the member is subjected [1].As an applied load is increased on a member, such as a beam, it will ultimately become large enough to cause the member to become unsta- ble and is said to have buckled. Further load will cause signifi- cant and somewhat unpredictable deformations, possibly lead- ing to complete loss of the member's load-carrying capacity. If the deformations that follow buckling are not catastrophic the member will continue to carry the load that caused it to buckle. If the buckled member is part of a larger assemblage of com- ponents such as a building, any load applied to the structure beyond that which caused the member to buckle will be redis- tributed within the structure [2].Buckling is caused by a bifurca- tion in the solution to the equations of static equilibrium. At a certain stage under an increasing load, further load is able to be sustained in one of two states of equilibrium: an unde- formed state or a laterally-deformed state[3].
Beam buckling is a curious and unique subject. It is per- haps the only area of structural mechanics in which failure is not related to the strength of the material. A beam buckling analysis consists of determining the maximum load a beam can support before it collapses. But for long beams, the col- lapse has nothing to do with material yield. It is instead gov- erned by the beam's stiffness, both material and geometric [3&4].
Euler Buckling Theory is the classical theory presented in
textbooks and classrooms. It begins simply by noting that the
internal bending moment in a loaded and deformed beam is (−Py) where P is the compressive load and y is the beam de- flection. So insert (−Py) in formthe beam bending equation
E.I.y′′=M …….. (1)
Where, E modulus of elasticity, I area moment of inertia and
M bending moment, [4, 5&6].
In 1757, mathematician L. Euler derived a formula that gives the maximum axial load that a long, slender, ideal beam can carry without buckling. An ideal beam is one that is per- fectly straight, homogeneous, and free from initial stress. The maximum load, sometimes called the critical load, causes the beam to be in a state of unstable equilibrium; that is, the intro- duction of the slightest lateral force will cause the beam to fail by buckling. The formula derived by Euler for beams with no consideration for lateral forces is given below. However, if lat- eral forces are taken into consideration the value of critical load remains approximately the same [5&6].
where, F maximum or critical force (vertical load on beam),Lunsupported length of beam, Kbeam effective length factor. K,value depends on the conditions of end support of the beam, as follows
K= 2.0 for one end fixed and the other end free to
move laterally
K= 1.0 for both ends pinned (hinged, free to rotate), K= 0.699 for one end fixed and the other end pinned, K= 0.5 for both ends fixed,
Therefore, some researchers interested with the field of
buckling and its effects on the different sides of critical loads to obtain the optimized opinions to design some structures in
IJSER © 2015 http://www.ijser.org
International Journal of Scientific & Engineering Research, Volume 6, Issue 2, February-2015 141
ISSN 2229-5518
mechanical engineering.
Lee and Kim (2001) [1] studied buckling of an axially thin –
walled laminated composite. Avcar (2014 ) [2] was study elas- tic buckling of Carbon Steel columns with three different cross sections, i.e. square, rectangle and circle cross sections, and two different boundary conditions, i.e. Fixed-Free (F-F) and Pinned-Pinned(P-P) boundary conditions, under axial compression has been investigated.Elnashaiand Elghazouli (1993) [3] studied the Performance of composite Carbon Steel/concrete members under earthquake loading. Part i: analytical model, so, the model is calibrated and compared with experimental data from cyclic and pseudo-dynamic tests conducted by the writers on a new ductile partially-encased composite beam-column.
Bhoi and Kalurkar (2014) [4] presented a study of buckling behavior of beam and column subjected to axial loading for various rolled I sections. Mourelatosand Parsons (1987)[5] studied a finite element analysis ofbeamson elastic foundation including shear and axial effects. Lee and Noh (2010) [6] stud- ied the inelastic buckling behavior of Steel members under reversed cyclic loading. Kashani and et at. (2014) [7] were studying the flexural-torsional vibration and stability of beams subjected to axial load and end moment. Yiu (2005) [8] searched a geometrically exact thin-walled beam theory con- sidering in-plane cross-section distortion. Denan and et at.(2010) [9] studied the lateral torsional buckling behavior of beam with trapezoid web Carbon Steel section by experi- mental and finite element analysis. Liu and et at. (2011) [10] studied finite element modeling of beams with surface energy effects.
The aim of the present paper search is to investigate the ef-
fect of the section shape for different material beams on buck- ling load under axial loading using finite element software AN- SYS R.15.
2 Materials and Methods
Beams under axial loading for different materials and section shapes are studied in this paper.
2.1 Specimens Material
The material properties of the beam specimens are taken from Kulkarni [11] and reported in Table 1.
TABLE 1 Material properties of the beam specimens, Kulkarni [11].
2.2 Numerical Solution
Buckling loads are calculated numerically using finite element software ANSYS R14.5 with PLANE188 element as a discretization element. Because of symmetry, half model as shown in Figure (1) is used in all cases. Rectan- gular (Rec.), U-channel (Uch.), Solid circle (Scir.) and Hol- low circle (Hcir.) ANSYS models are shown in Figure 2 with the mesh, elements and boundary conditions while Figure 3 illustrates the dimensions for these cross- sections.
Figure 1 Full and half model are used in numerical solution.
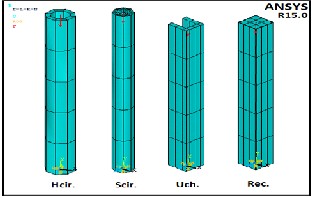
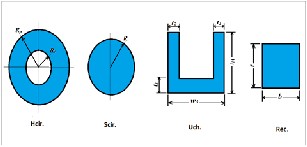
Figure 2 Beam specimens are used with the mesh, elements and boundary conditions.
Figure 3 Types of the beam cross-section specimens with the dimensions parameters.
IJSER © 2015 http://www.ijser.org
International Journal of Scientific & Engineering Research, Volume 6, Issue 2, February-2015 142
ISSN 2229-5518
Generally, there are two procedures for buckling analy- sis as follow
a) Eigenvalue buckling analysis
In this analysis, the structural eigenvalues for the given system loading are computed. It is known as classical Euler buckling analysis.
b) Non-Linear buckling analysis
This analysis based on gradually increases the applied load until a load level is found whereby the structure becomes unstable (a very small increase in the load will cause very large deflections).
2.2.1 BEAM188 Element Description
TABLE 2 The cases studied with the cross-section type and number of Figures.
BEAM188 is based on Timoshenko beam theory which includes shear- deformation effects. The element is a linear, quadratic, or cubic two-node beam element in 3- D.BEAM188 has six or seven degrees of freedom at each node. These include translations in the x, y, and z direc- tions and rotations about the x, y, and z directions. This el- ement is well-suited for linear, large rotation, and/or large strain Non-Linear applications [12]. The geometry, node locations, and the coordinate system for this element are
shown in Figure 4. 3
 1 2
1 2
Figure 4 BEAM188 element type with the geometry,
node locations and the coordinate system, Ansys help [12].
2.3 Validation Test
Timoshenko [13] calculated the critical buckling load for a slender bar with hinged ends subjected to axial load (P). The information data of this bar as below
Length (L) = 200 in, area (A) = 0.25 in2, width (b) = 0.5 in,
thickness (t) = 0.5 in, axial load (P) = 1Ib, modulus of elasticity
(E) = 30e6 Psi and poisons ratio (υ) = 0.3.
Table 3 reported the theoretical and numerical results.
IJSER © 2015 http://www.ijser.org
International Journal of Scientific & Engineering Research, Volume 6, Issue 2, February-2015 143
ISSN 2229-5518
The comparison between the two methods shows that the va-
lidity of the ANSYS R15 is very good due to the different per- centage is not exceeds of 0.005 %.
TABLE3 A comparison between theoretical and numerical so-
lution.
3. Results and Discussions
Buckling load values are numerically calculated using ANSYS R15 for three different materials, four cross-section types and the two analysis approaches (Eigenvalue and Non-Linear analysis) with different cases reported in Table
1. To compute the required results using two mentioned
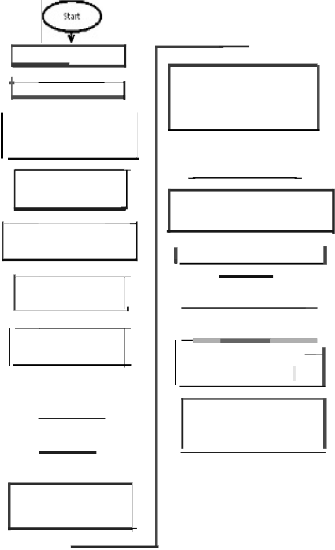
analysis in a faster and accuracy way, programs are written with APDL (Ansys Parameter Design Language). Figures 5
& 6 show APDL flow chart for Eigenvalue and Non-Linear analysis, respectively.
3.1 Eigenvalue analysis
3.1.1 Rec. Cross - Section
Figures7&8 illustrate the variations of critical buckling loads(Pc)with L and t for Rec. type parameters, respective- ly. Three different materials (Carbon Steel, Titanium and Aluminum) (case study 1 & 2) are used. These Figures ex- plain that Pc values are reversed proportion with the beam length and direct proportion with parameter. In all men- tioned Figures, it is found that the Pc values for Carbon Steel are more than that of Titanium and Aluminum.
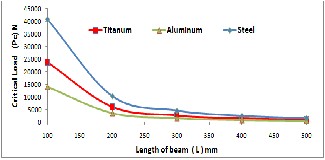
Figure 7 Variation of Rec. beam length with critical load for different materials.
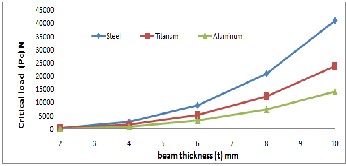
Figure 8 Variation of Rec. beam thickness with critical load for dif- ferent materials for.
3.1.2 Scir. Cross - Section
The variations of Pc with L and R for Scir.type are rep- resented in Figures 9&10, respectively (case study 3 & 4). It can be seen that, Pc values are increase with decrease L and increase R. The Pc values for Aluminum are less than that of Titanium and Carbon Steel.
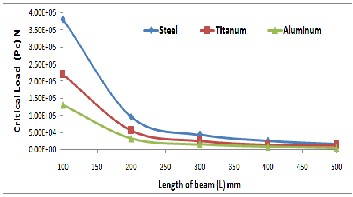
Figure 9 Variation of Scir. beam length with critical load for different materials.
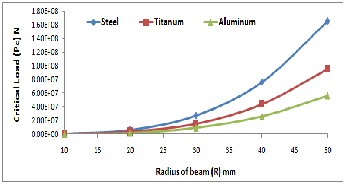
Figure 10 Variation of Scir. Beam radius with critical load for different materials.
3.1.3 Hcir. Cross - Section
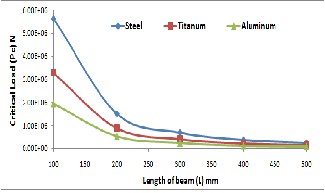
Figure11&12 explain the variations of Pc with L and Ro/Ri ratio, respectively for Hcir. type (case study 5 & 6). It’s clear that increase L and decrease Ro/Ri ratio lead to decrease the Pc values especially when we used Alumi-
num material.
IJSER © 2015 http://www.ijser.org
International Journal of Scientific & Engineering Research, Volume 6, Issue 2, February-2015 144
ISSN 2229-5518
Figure 11 Variation of Hcir. beam length with critical load for different materials.
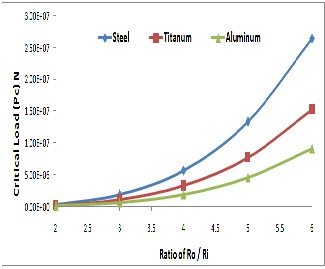
Figure 12 Variation of ratio of outer radius to inner radius for Hcir. beam length with critical load for different materials.
3.1.4 Uch. Cross - Section
The variation of numerically computed Pc for the three of Uch. Different material specimens in 7, 8& 9 cases are shown in Figures13-15, respectively. It can be seen that, the increment in Pc values are become when de- crease L and increase w3 and t1 . As the same of all above mentioned Figures, Pc values for Carbon Steel specimens are greater than that of Titanium and Aluminum specimens.
Figure 13 Variation of Uch. beam length with critical load for different materials.
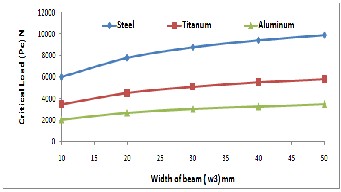
Figure 14 Variation of Uch. Beam width with critical load for different materials.
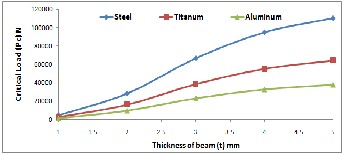
Figure 15 Variation of Uch. Beam thickness with critical load for dif- ferent materials.
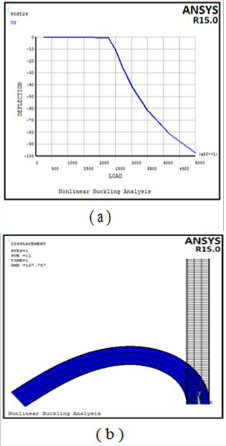
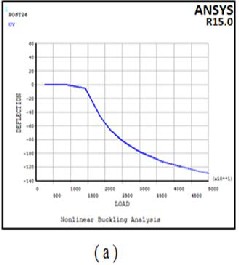
3.2 Non-Linear analysis
Using Non-Linear analysis solution, Figures 16a, 17a, and 18a represent the variation of the Rec. beam deflec- tion with the applied load gradually increases with time until a critical buckling load is found (when occurs a very large deflection).Case study number 10 for Carbon Steel, Titani- um and Aluminum materials are shown in these Figures, respectively. It can be seen (at the same conditions) that the Pc values calculated using this analysis approximately the same with the values calculated using eigenvalue anal- ysis. Table 4shows Pc calculated using these two ap-
proaches with differences is not exceeding 0.27%.
IJSER © 2015 http://www.ijser.org
International Journal of Scientific & Engineering Research, Volume 6, Issue 2, February-2015 145
ISSN 2229-5518
TABLE 4 Buckling load values calculated using Eigenvalue and
Non-Linear analysis.
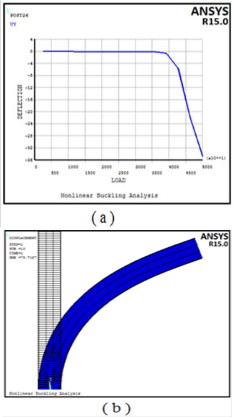
Furthermore, Figures 16b, 17b and 18b graphically illus- trated deformed and un-deformed shape for the Rec. beam specimens represent the case study number 10.
Figure 17 a) Variation of Rec. Steel deflection with the applied load gradually increases with time.
c) Graphically illustrated deformed and un-deformed shape due to buckling load.
Figure 16 a) Variation of Rec. Aluminum deflection with the applied load gradually increases with time b) Graphically illustrated deformed and un-deformed shape due to buckling load.
IJSER © 2015 http://www.ijser.org
International Journal of Scientific & Engineering Research, Volume 6, Issue 2, February-2015 146
ISSN 2229-5518
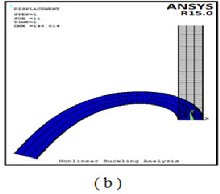
Figure 18 a) Variation of Rec. Titanium deflection with the applied load gradually increases with time b) Graphically illustrated deformed and
un-deformed shape due to buckling load.
4. Conclusions
In light of the results of the current study can be reached the following conclusions
1) Buckling loads are strongly depends on the material prop- erties and the shape geometry of the beam.
2) Buckling loads are directly proportion with modulus of elas-
ticity, thickness, outer to inner radius ratio and all beam ge- ometry parameters except the beam length.
3) Pc values are calculated from the Eigenvalue analysis and
Non-Linear analysis for different cases are approximately same and the difference percentage is not exceeds of 0.27
%.
4) Numerical solution isa suitable to calculate Pc due to it is used for all cases and with regular and irregular shapes.
References
1] J. Lee & S. E. Kim. “Flexural-torsional buckling of thin- walled I-section composites". Journal of Computers & Structures, Vol. 79, pp. 987-995, 2001.
2] M.Avcar. " Elastic Buckling of Steel Columns under Axial Compression". American Journal of Civil Engineering, Vol. 2, No. 3, pp. 102-108, 2014.
3] A. S. Elnashai & A. Y. Elghazouli."Performance of Compo- site steel/ Concrete Members under Earthquake Loading. Part I" :Analytical Model/ Earthquake Engineering and Structural Dynamics, Vol. 22, pp. 315-345, 1993.
4] R. Bhoi& L. G. Kalurkar."Study of Buckling Behavior of Beam and Column Subjected To Axial Loading forVarious Rolled I Sections". International Journal of Innovative Re- search in Science, Engineering and Technology, Vol. 3, pp. 17639-17645,2014.
5] Z.P.Mourelatos & M. G.Parsons. "AFinite Element Analysis
of Beams on Elastic Foundation Including Shear and Axi- al Effects" .Journal of Computers & Structures, Vol. 27, No. 3, pp.323-331, 1987.
6] P. S. Lee & H. C. Noh. "Inelastic buckling behavior of steel members under reversed cyclic loading". Journal of Engi- neering Structures, Vol. 32, pp. 2579-2595, 2010.
7] M. T. T. Kashani, S. Jayasinghe & S. M. Hashemi." The Flexural-Tensional Vibration and Stability of Beams Sub- jected to Axial Load and End Moment" .Journal of Shock and Vibration, Vol. 2014, pp.1-11, 2014.
8] F. You. "A Geometrically exact Thin-Walled Beam Theory Considering in-Plane Cross-Section Distortion" .Ph.D. thesis, 2005.
9] F. Denan, M. H. Osman &S. Saad." The Study of Lateral Torsion buckling Behavior of Beam with trapezoid Web Steel section by Experimental and Finite Element Analy- sis" .Journal of IJRRAS, Vol. 2 (3), pp. 232-240, 2010.
10] C. Liu,R. K. N. D. Rajapakse & A. S. Phani. " Finite Ele- ment Modeling of Beams with Surface Energy Effects". Journal of Applied Mechanics, Vol. 78, pp. 031014-1 –
031014-10, 2011.
11] S. G. Kulkarni. " MachineDesign" . Sixth reprint, The
McGraw-Hill companies, New Delhi, 2012.
12] ANSYS help.
13] S. Timoshenko. "Strength of Materials, Part II, Advanced Theory and Problems" . 3rd edition, D. Van Nostrand co., Inc., New York, 1956.
IJSER © 2015 http://www.ijser.org
International Journal of Scientific & Engineering Research, Volume 6, Issue 2, February-2015 147
ISSN 2229-5518
Appendex: Figure (6) APDL Flow chart for Non-Linear buckling analysis
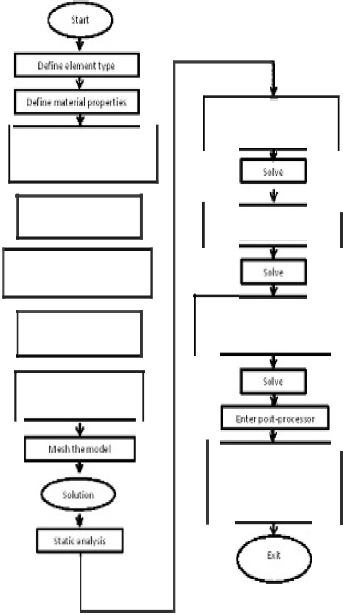
Figure (5) APDL Flow chart for Eigenvalue buckling analysis
·l •rt lt.• l:).irn i•c1r.r>IIIIIJ"'IId
Fre ren mil',' be tt(OiHI!N
UlilPSTAES COlnn1nd
nrr, ··rJ.
·l ;r'! .£..
Ecr•1f, 1£(uf UEf .lr'ld LUAlA
romnr.rl
illf-!JIIhQ rr'r wUiJI
u1e trwdltP! o f i<rd tll.lt;,,rvJ
D:tlne lllo)ic:r11 properties b •lojllf l'i'IK llli'IK!IUIJ\ I , tjEOrJ,,!,IJTOTI IY.1LNH
iele<t lh illll !ieorboo tll)e wl commm:ls.
iECT'rPE SECOIFSET nd'P.ll.loJolo t
JII II'JI e r,
f.la1r1G a1·plnts :w.ll lli\.lrc li
Sgl ct l:i.J(IJI rl.ll·,sls wing
n urr.1 r f\ lliJ("Cpr rnrr\H"""'h
<o r.n.ntod
l rrp.rt hbe lie11ron
)TIIl CI
Pklc( tlt..-n ;,( A ·>linn•
h;:lE'iH PErmun nd
-•
thbJII'I n1odl
j
...
Ap p•:
f y bllgMt1 jrQHIr thn pradld-.:1
f.llmctlzc line 11n1lJbl
li.riliuu r rurrr!Hr

S•l d p.lrHion p.lH nd acHiQS tha
rv.rrnl1r rnnltD "«f:l'l'ldmin£
EJ; ASS & M:<P.ollf D con1mmd
Dct\hkco 1 trtsrdline to d:tte
tllc bc11n lllodj
...
r QLI·d v: Hirrtt I t"vr.Pfl rrocdf
...
l,;:rplh!)).Sr 11ornlti.:rlbOOJine
"
Dl u.:llzrInt o Sllbl
dt.lslcoi\IJm t r ,..
App[V b\l ndJry COI'ldltlol"r;
!tlilpl rr rrl' & FJi'W lc.lr11
•
AFPII' boul'l!»l"\' c ndtbns
lrfiiJ.IAI>'Dt-11)
rirne v ll Jlloxmor
...
RaJ<!hr(a olM • 1-d 11a dln dh
115lng F:rORC£ K. lSOl corrm.md
Llel\i'!'ll'lllure JlrAron m:i
llichrhrloRnrlh.tfl" ml
.U l & PlDI fcmmm:l.
mp r:t:1el1
I Mtsih lhIOOdl I t
....L. Plo t d!f lertim l'orlh re!pKt o
s.lu.t.o.o 11Pid ludd ulire /limo1 r01nrrum
...!...
I Slollft r.lll1 fl I
1' L>il
So;-l;ct tjcnlnQ.il' $dllilol'l LA
tll(>EOMCO!mlll'l!l
I
IJSER lb)2015
http://www.ijserorq