International Journal of Scientific & Engineering Research, Volume 5, Issue 1, January-2014 113
ISSN 2229-5518
Effect of the Waste Weight on Nitrogen Oxides Formation in a non Temperature- Controlled Laboratory Scale Rotary Kiln
Jean Fidele NZIHOU, Salou HAMIDOU, Medard BOUDA
Abstract— Waste incineration, both urban and industrial, is one of the way of reducing their volume and weight. However, environmentally sound waste incineration can only be achieved if done according to well known physico-chemical conditions. This study focused on the formation and reduction mechanisms of nitrogen oxides (NO x ) with a non temperature-controlled laboratory scale rotary kiln. It was found that NO x releases vary with the weight of the waste in the kiln. For temperatures lower than 900 °C, it appears that NO x emissions are strongly influenced by the temperature and the local concentration of oxygen. Experiments show the effect of combustible weight on emissions of nitrogen monoxide (NO). NO 2 was not found for peak temperature less than 1012°C or waste weight less than 3kg. In ours experimental conditions, NO is essentially formed by the mechanism of “fuel NO”. It is highly influenced by local oxygen concentration in the reaction place, but moderately influenced by the temperature. Lack of the kiln’s temperature control implies kiln’s operation temperature variations. We found that these variations are related the combustible load. NO x and residual O 2 concentration in the kiln’s combustion zone where correlated to the combustible weight.
Keywords — Waste, incineration, laboratory scale rotary kiln, nitrogen oxides, temperature, combustible, pollutants.
IJ—————S————— E———————R———
1 INTRODUCTION
Thermal treatment of waste is one of the options adopted in recent decades for their elimination. Considerable
efforts have been made in mastering the combustion process in order to avoid the transfer of pollutants. The main pollutants meet are nitrogen oxides, carbon oxides and sulfur oxides. Much of the waste consists of organic products which lead to formation of non toxic gases (CO 2 , H2 O, N2 ) and toxic substances (NO x , SO x , CO x , Cl2 , HCl,
...) during the combustion process.
These gases cannot be released into the atmosphere
without damage. A good knowledge of their mechanism of formation and destruction (especially for toxic gases), is crucial in order to reduce their releases. These pollutants releases are in one hand linked to poor combustion conditions and in the other hand to the presence of precursor in the raw waste or by-products of combustion. Because experiments with industrial kilns are costly and difficult to carry out, we merely conduct fundamental research with a laboratory scale rotary kiln.
————————————————
• Dr Jean Fidele NZIHOU is currently teaching physics at the University of
Koudougou/Burkina Faso. E-mail: jean_fidele@hotmail.com
• Dr Salou HAMIDOU currently teach at the West African Catholic
University /Bobo-Dsso/ Burkina Faso. E-mail: h_salou@yahoo.fr
• Dr Medard BOUDA is currently a researcher at IRME/University of
Quebec at Abitibi-Temiscamingue / Canada. E-mail: boumeda@yahoo.fr
Several studies have already been carried out with temperature-controlled furnaces. That kind of furnaces
help investigates at various temperatures and allows one to take the operation temperature as parameter. Furnaces with temperature regulation are often electrically heated. However, there are several contexts (for example fuel heated kilns) where kiln’s temperature is not regulated.
Because the laboratory scale rotary kiln we are using
here is fuel heated and has no temperature control
system, parameters that could considerably impact on the temperature should be studied.
Our choice is motivated by the fact that operating temperature of a furnace is one of its driving parameters and the effects of toxic gases on human health and the environment. Given the content of polluting gases from incineration systems, all parameters that might affect operation conditions should be studied in order to avoid pollution transfer when working with a non temperature-controlled rotary kiln.
However the complexity of the involved reactions and the high number of possible interactions between pollutants, has led us to restrict the number of pollutants to be studied in this paper.
This paper mainly focused on the nitric monoxide is
subdivided as follows: firstly, a small survey of
IJSER © 2014 http://www.ijser.org
International Journal of Scientific & Engineering Research, Volume 5, Issue 1, January-2014 114
ISSN 2229-5518
interactions between NO and other gaseous pollutants is done and then follows NO formation and reduction
mechanisms. Secondly we will experimentally study the effect of the fuel weight on the formation of nitrogen monoxide in a thermal rotary kiln. Finally we will discuss our experimental results under the light of existing studies.
2 LITTERATURE REVIEW
2.1 Interactions between pollutants
Studies on formation and reduction mechanisms of gaseous pollutants shows the existence of significant interactions between these gaseous compounds. These reactions involve a large number of reaction species. Below we will briefly summarize the studies on the interaction of nitrogen oxides with other pollutant gases.
2.2 Nitrogen oxides – Carbon oxides interactions Emissions of nitric oxide are strongly influenced by the CO concentration. Work by Glarbrog et al. [1] on the oxidation of HNCO have shown that the presence of CO in the reaction medium significantly promoted the
oxidation of NO by HNCO. At 930 ° C, it is almost
NCl in turn reacts with N° radicals to form dinitrogen
N2 according to the reaction: NCl + N° → N2 + Cl° (3)
Consumption of N° radicals thus limits the formation of
NO. In addition, studies of Mao and Barat [6] have shown that chlorine atoms react with H° radicals to produce HCl, which by a subsequent reaction with the OH° radical limit CO oxidation.
2.5 Formations mechanisms of nitrogen oxides
Nitrogen oxides formation mechanisms in flames study back to the sixties beginnings. It was driven by concerns of air pollution. On a chemical point of view, nitrogen oxides comprise all compounds of empirical formula NxOy with a degree of oxidation of nitrogen ranging from I to V. These compounds are: nitrous oxide (N2 O), nitrogen monoxide (NO), nitrogen dioxide (NO2 , also known as dimer, N2 O4 ), nitrogen trioxide (N2 O3 ) and nitrogen pentoxide (N2 O5 ). Of all these oxides, only NO, NO2 and N 2 O are typically designated as NOx. From
this group, NO and NO2 play an important role in air
IJSER
completely oxidized to NO, N2 O and N2 . N2 O
concentration increases with temperature up to 1000 ° C
and then decreases. The NO concentration is, for its part,
an increasing function of temperature. However, when added to the starting mixture of NO, one finds that the CO leads to a reduction of nearly 60% of the initial NO to N2 O and N2 at temperatures below 1000 ° C. Beyond 1000 ° C, there is an increase in the concentration of NO. The work of Chan et al. [2] showed that the reduction reaction of NO may be heterogeneous or be by direct reaction with CO according to equation:
NO + CO → CO2 + ½N2 (1)
2.3 Reactions between nitrogen oxides and hydrocarbons Work made by Dagaut et al. [3] on the reduction of NO by C2 H6 and Lindstedt et al. [4] on the oxidation of NH3 show the importance of the interaction of hydrocarbons on the reduction of NO. The effectiveness of the reduction of NO is an increasing function of the concentration of hydrocarbon species and temperature. Indeed, the work of Alzueta et al. [5] shows this result.
2.4 Chlorine – nitrogen oxides interactions
The NO content is substantially reduced by the presence of chlorine in the fumes. N° radicals combine with Cl° atoms to produce intermediate NCl according to the reaction:
N° + Cl° + M → NCl + M (2)
pollution [7]. As we will see in the experimental results,
NO2 is only present at high temperature and our
measurement apparatus (Testo 350TM) had no N2 O
measurement cell. We will therefore restrict the study to the mechanisms of formation of NO.
Three mechanisms of formation of nitrogen monoxide during combustion have been identified, namely:
2.6 Mechanism of "thermal NO" (Zel'dovich) [8].
NO is formed from molecular nitrogen of the air during combustion. Production takes place in the flame and requires the provision of a high energy to break the triple bond of dinitrogen molecules. Its formation is possible only at high temperatures above 1250 ° C.
2.7 Mechanism of the "fuel NO" (De Soete) [9], (Miller and Bowman) [10].
NO is formed from the nitrogen contained in the fuel. Its production depends on the richness of the fuel - air mixture and is strongly linked to the local concentration of oxygen in the reaction medium. The nitrogen concentration in the fuel and temperature has little effect on the combustible’s NO production.
2.8 Mechanism of the "early NO" or "prompt NO" (Feminore) [11].
It is actually a combination of the two mechanisms mentioned above. Its formation result from molecular nitrogen of the air likes the thermal NO, but in this case it is subjected to reactions with hydrocarbon radicals. Its
IJSER © 2014 http://www.ijser.org
International Journal of Scientific & Engineering Research, Volume 5, Issue 1, January-2014 115
ISSN 2229-5518
mechanism is similar to that of the fuel NO, but takes place in high temperatures conditions (> 1200 ° C) and in
the presence of high concentrations of hydrocarbon species.
3 MATERIALS AND METHODS
3.1 The rotary kiln
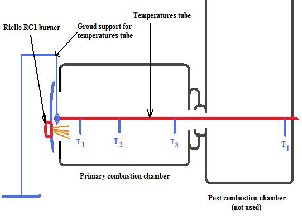
The kiln used here is a co-current one (fuel, air, secondary air and waste are introduced on the same side). It is composed of four main components: the combustion chamber, the afterburner, the chimney and the driving unit.
The combustion chamber consists of a cylinder slightly
inclined (17°), to which is attached the primary burner called burner 1 (RG1). This cylinder has diameter of 88 cm, length of 108 cm, is placed on bearings ball that allow its rotation around its axis of symmetry. In the middle of its axis of symmetry runs a pipe supporting four thermocouples for temperature measure noted T1 , T 2 , T3 and T 4 from RG1 primary
burner to the afterburner chamber (fig. 1).
Data coming from the Testo 350 ™ are sent to the RS232
serial port of the acquisition PC. Four thermocouples are placed inside the primary combustion chamber. These are connected to the centralization box "Clear Signal MX
2000®" with a compensation cable. The centralization box is connected to an analog-digital data acquisition card inserted in an ISA slot of the acquisition PC using a S-1800 cable. Data from the combustion gases and the temperatures of the thermocouples are processed with Tespoint ™ software.
3.3 The household waste model
Direct studies on industrial facilities are not only too expensive, but also difficult to carry out, mainly because of the heterogeneity of real waste. In addition, because of their heterogeneity and varying composition, experiments with real waste are very complex and difficult to master. For the sake of reproducibility of experiments, we use the model of the combustible fraction of household waste of the city Ouagadougou
developed by Nzihou (2005). Composition of the waste
used here is 53% wood, 26% cardboard and 21% plastic. The wood used consist of wood is chips furniture manufacturing facilities. The cardboard is made of 2cm x
2cm pieces cut from cardboard packages. Plastics are
made from mineral water bottles of which were removed labels, glue and printed papers or plastics. The elemental formula of this waste is:
C4.24 H6.16 O2.69 N0.01 S0.005
Fig. 1: primary combustion chamber with thermocouples positions
3.2 Data acquisition unit
The gases from the combustion are analyzed with a Testo
350 ™, which allows to measure:
- The volume percent of oxygen in the combustion gases (0 to 21%),
- The concentration in parts per million (ppm) of NOx, CO
and SO2
- The proportion of CO2 (%), calculated from the concentration of O2 and CO
- The temperature of the gas in the post-combustion chamber.
3.4 Experimental protocol
All experiments were performed according to following procedure:
− measurement of the weight of the waste;
− cleaning the combustion chamber from the previous combustion waste materials;
− preheating furnace to have a temperature of about
150 ° C. If the experiment follows another, this condition is fulfilled if the oven is kept closed after the previous combustion for less than 10 minutes;
− introduction of waste into the furnace, and closing
combustion chamber the door;
− checking and starting up the Testo 350 ™ gases measuring apparatus;
− starting the data acquisition software Testpoint ™ on the PC;
− starting the rotary kiln and the ignition of the waste;
− the combustion process will be considered as complete
IJSER © 2014 http://www.ijser.org
International Journal of Scientific & Engineering Research, Volume 5, Issue 1, January-2014 116
ISSN 2229-5518
and the acquisition stopped when all the following
conditions are met: the residual O2 concentration stabilizes at more than 19.5%, the CO2 concentration is less than 1.5% and the temperature at the right side of the afterburning chamber (T4 ) is less than 150 °C.
4 RESULTS AND DISCUSSION
We conducted four (04) sets of measures in 2005, 2007,
2008 and 2010. These four sets of measures were intended to ensure the reproducibility of experimental results. Taking in account small experimental variations, we can say that the results are reproducible. Table 1 summarizes the cumulative emissions of nitrogen oxides and the observed temperatures at "hot spot" of the kiln for 2008’s set.

Table 1: NO and NO2 releases and temperatures at various loads
Table 2: Mean values and maximum peaks of emission of NO as a function of the load of the fuel
Combustible load (kg) | NO Highest peak (mg/kg) | NO Average value (mg/kg) |
0.5 | 6.0 | 0,6 |
1.0 | 18.0 | 3,65 |
1.5 | 22.0 | 4,87 |
2.0 | 36.0 | 8,19 |
2.5 | 79.0 | 15,91 |
3.0 | 53.0 | 14,39 |
3.5 | 144.0 | 30,28 |
4.0 | 137.0 | 40,51 |
4.5 | 155.0 | 42,11 |
Examination of table 2 shows that:
- The maximum value of NO (peak emission for each
fuel load) increases with the load of the fuel;

- The average NO releases increases with fuel load, except for at 3kg (a decrease).
Table 1 above shows that:
- cumulative emissions of nitrogen dioxide are virtually nonexistent from 0 to 3 kg load of fuel;
- NO emissions are regularly increases;
- temperatures are regularly increasing from 0 to 4kg of fuel;
Table 2 gives the peak and average emissions of NO.

1 Highest maximal (peak) temperature (T3) among the four
(T1, T2, T3 and T4) recorded in the kiln.
2 For N values, the average is calculated with the following
formula : Xav = 1/N ∑Xi
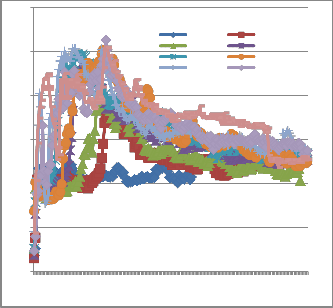
Fig. 2 shows the evolution of the temperature T3 at

different loads. The general shape of the curves is the same. Temperatures are around 400°C without load (0 kg) with changes in temperature of ± 25 °C. Without load, the kiln is only heated by gasoline fuel. Yet the flow of gasoline fuel and primary air doesn’t change at all. This gives us an idea of the variability of temperature and gaseous emissions all over time without noticeable experimental changes. All the curves exhibit a peak temperature. This peak temperature denotes the combustion gases from the pyrolysis of waste constituents [12], [13], [14], [15]. After this peak, temperature decrease exponentially according to Arrhenius law.
Lets us consider in particular the peak temperature
(peak temperature) for each fuel combustible load. This temperature (T3 ) is given by the thermocouple located in the "combustion zone" (Fig. 3).
IJSER © 2014 http://www.ijser.org
International Journal of Scientific & Engineering Research, Volume 5, Issue 1, January-2014 117
ISSN 2229-5518
1200
1000
800
600
400
200
0
0kg 0.5kg
1kg 1.5kg
2kg 2.5kg
3kg 4kg
time( x 5s)
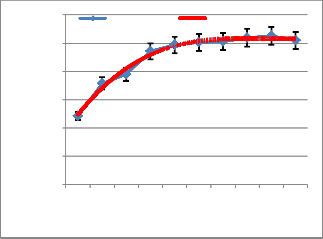
Fig. 3 suggests a correlation between the temperature
(T3 ) and fuel mass (mw )
T3 max (°C) = 1,224mw 3 - 31,92mw 2 + 274,8mw + 250,7
From this fig. 3, the following observations and interpretations can be made:
- The determination coefficient of the tendency curve (R
= 0.992) is quite close to unity. This suggests a good correlation between the mass and temperature.
- The error bars at seven percent (7%) include all points of the tendency curve;
- The peak temperature appears to decrease beyond 4.5 kg.
The explanation for the latter observation is the
following: first the 5 kg mass has not been reached
Fig 2: temperatures variations according to the kiln waste
fuel
Fig. 2 above show the complexity of temperature
experimentally. The rotary kiln was already to the brim at 4.5 kg and few pieces of fuel were thrown out of the kiln by the air blast of the primary burner. This resulted
in a loss of the fuel. This simply confirms that
IJSER
variations over time. Curves are difficult to compare
even if these have roughly sibling shapes. Temperatures fluctuations appear as random. These temperatures variations are the result of the highly complex nature of the combustion process. We looked for other operating parameters values, less prone to random fluctuations and found that the peak temperature for each waste weight is one of these. Fig. 3 depict peak temperature (Temp max T3) reached for each experiment.
temperature cannot indefinitely grow with the rotary kiln used.
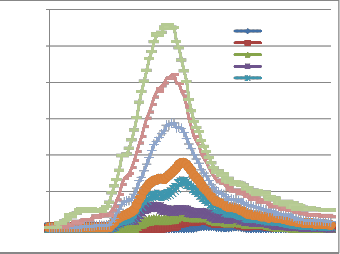
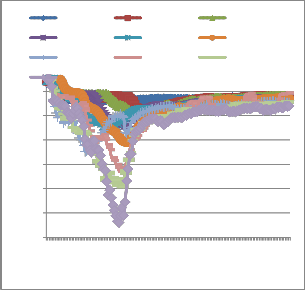
Fig. 4 depicts the evolution of NO emissions during incineration of the combustible fraction of the waste model. To better compare these emissions at each load, we plotted staked curves. Regarding measures batch, achieving end conditions set out in handling the experimental protocol requires more time when mass increases. But that does not diminish the evolution of
NO emissions.
1200
1000
800
600
400
200
0
Temp max T3 Poly. (Temp max T3)
y = 1.2244x3 - 31.927x2 + 274.85x + 250.71
R² = 0.9853
0kg 0,5kg 1kg 1,5kg 2kg 2,5kg 3kg 3,5kg 4kg 4,5kg
Combustible load
600
500
400
NO300 ((mg/kg)
200
100
0.5kg
1kg
1.5kg
2kg
2.5kg
0
Fig. 3: Evolution of the peak temperature T3 depending on
the load
Time ( x 5s)
Fig. 4: Emission of NO in the kiln at different loads
IJSER © 2014 http://www.ijser.org
International Journal of Scientific & Engineering Research, Volume 5, Issue 1, January-2014 118
ISSN 2229-5518
From fig. 4 we can make some observations:
- The start time of measurable emissions of NO decreases as the mass increases (it shift from the right to the left). This is explained by the fact that when the mass of the fuel increases, the thermal power (heat available per time unit) increases. One then more quickly reaches higher temperatures when the mass of fuel increase. In fact, this reflects the fact that the level of NO increases with the reaction temperature [10], [16], [17], [18].
- The area covered by each curve, that is to say, the cumulative emissions of NO increases with the load of the fuel.
Fig. 5 shows the evolution of the residual oxygen in the
reaction medium depending on the load of the fuel over time. From that fig. 5 the following observations can be made:
- The maximum peak oxygen consumption increase as the fuel load increase;
- The oxygen consumption is low and stable after 8 minutes (~ 105x5s) of ignition whatever the fuel load.
Comparison of fig. 4 and 5 shows that the formation of
Fig. 5: Evolution of residual oxygen as function of the
load over time
This confirms the fact that the formation of NO depends more than O2 concentration in reaction medium than of temperature as already shown by De Soete [10] and Miller & Bowman [9].
The used waste model elementary formula doesn’t contain chlorine. We have not found HCl in our flue gaz. It appears that using a model waste has highly helped us lower the complexity of involved reaction in this batch waste incineration experiments.
5 CONCLUSIONS
This study is non exhaustive and is limited to formations mechanisms of nitrogen oxides. It shows some of the complexity of the reactions involved in the process of burning waste. The use of a waste model helped us avoid introducing chlorine in the experiments. We found that, NO emissions are an increasing function of
temperature; those of NO2 appear at high temperatures
IJSER
NO increases in the same direction as the oxygen consumption. We notice a very characteristic peak in fig.
5 giving the oxygen consumption and situated 4 minutes
10 seconds of the start of ignition (5x50 = 250s). This appearance is reflected in the curves of NO formation over time. On the contrary, temperature curves show some stabilization after the 250s of ignition. After 250s, all curves show an exponential decay.
O2-No load O2-0.5kg O2-1kg O2-1.5kg O2-2kg O2-2.5kg O2-3kg O2-3.5kg O2-4kg O2-4.5kg
beyond 1000°C in our case. The effect of temperature
seems parametric and drive the emission levels of NO and NO2 . But the concentration of oxygen consumption is more localized in time, concentrated around 125s from the start of the combustion. Furthermore, temperature appears to be proportional to the mass of the fuel. Therefore we might perhaps consider using the mass of fuel waste as a parameter instead of the temperature in rotary kilns of same type that have no automatic temperature regulator.
Experimental results show that nitric oxide is the largest pollutant in our case. Other oxides of nitrogen are present only in very small quantities.
20
18
16
O2 (%)
14
12
10
8
time (x 5s)
6 REFERENCES
[1] Glarborg P., Kristensen P.G., H. Jensen S.H., Dam- Johansen K. (1994). A flow reactor study of HNCO oxidation chemistry. Combustion and flame. 98(3): 241-258
[2] Chan L.K., Sarofim A.F., Beer J.M. (1983). Kinetics of NO-carbon reaction at the fluidized bed combustor conditions. Combustion and flame. 52: 37- 45.
[3] Dagaut P., Lecomte F. Chevailler S., Cathonnet, M. (1999). The reduction of NO by ethylene in a jet stirred
IJSER © 2014 http://www.ijser.org
International Journal of Scientific & Engineering Research, Volume 5, Issue 1, January-2014 119
ISSN 2229-5518
reactor a 1 atm : experimental and kinetic modeling.
Combustion and Flame. 119:495-504.
[4] Lindatedt R.P., Locwood F.C. and Selim M.A., (1995). A detailed kinetic study of ammoniac oxidation. Combustion Science and Technology. 108:231-254.
[5] Alzueta M.J., Hamalaimen J.P. et Tuummavuori J.L. (1993). Conversion of peat and coal nitrogen through HCN and NH3 to nitrogen oxides at 800°C. Fuel, 72(6):
837-841.
[6] Mao F. and Barat R.B. (1965a). The interaction of fuel bound nitrogen and fuel bound chlorine during air staged incineration. Combustion Science and Technology.
16-117:339-357]
[7] Chovin P., Roussel A. (1973). Physico-chimie et physiopathologie des polluants atmosphériques. Ed. Masson, Paris.
[8] Zeldovich Y.B., (1946). The oxidation of nitrogen in combustion and explosions». Act physicochemical USSR.
21:557-628.
[12] Nzihou J.F. (2005). Modélisation d’un four thermique rotatif : influence des paramètres de
fonctionnement sur la performance thermique et les émissions polluantes en incinérateur. University of Ouagadougou, Ph D Thesis, 165.
[13] Grieco E. andBaldi G. (2011). Analysis and modelling of wood pyrolysis, Chemical Engineering Science. 66 (2011) 650–660.
[14] Prakash N. and T. Karunanithi, (2008). Kinetic Modeling in Biomass Pyrolysis – A Review. Journal of Applied Sciences Research, 4(12): 1627-1636,
[15] Branca, C. and Di Blasi C., 2003. Kinetics of the isothermal degradation of wood in the temperature range, 528-708 K. Journal of Analytical and Applied Pyrolysis, 67: 207-219.
[16] De Soete G.G. (1989). Mécanismes de formation et de destruction des oxydes d’azote dans la combustion. Revue Générale de Thermique. 28 :331-353.
IJSER
[9] De Soete G.G. (1974). Overall reaction rates of NO
and NO2 formation from fuel nitrogen. 15th International
Symposium on Combustion, the combustion institute. 1093-
1102.
[10] Miller J.A., & Bowman C.T. (1989). Mechanism and modeling of nitrogen chemistry in combustion. Progress Energy Combustion Science. 15:287-338.
[11] Fenimore, C.P. (1970). Formation of nitric oxide in premixed hydrocarbon flame» 13th International Symposium on combustion, the combustion institute, 373-
380.
[17] Grcar J.F., Glarborg P., Bell J.B., Daya M.S., Loren A.,
Jensen A.D. (2004). Effects of Mixing on Ammonia
Oxidation in Combustion Environments at Intermediate Temperatures. Proceedings of the Combustion Institute. Vol. 30.
[18] Houshfar .E, Skreiberg Ø, Løvås T., Todorović D., Sørum L. (2011). Effect of Excess Air Ratio and Temperature on NOx Emission from Grate Combustion of Biomass in the Staged Air Combustion Scenario. Energy Fuels, 2011, 25 (10), pp 4643–4654
DOI: 10.1021/ef200714d
IJSER © 2014 http://www.ijser.org