International Journal of Scientific & Engineering Research, Volume 3, Issue 11, November-2012 1
ISSN 2229-5518
Effect of Kaolinite Clay on Properties of Drilling Mud
Gideon Majiyebo Adogbo, Isa Mohammed**
*(Department of Chemical Engineering, Ahmadu Bello University Zaria, Nigeria
Email:adogbogm@yahoo.com)
**(Department of Chemical Engineering, Ahmadu Bello University Zaria, Nigeria)
ABSTRACT
Kaolin Clay minerals was used as ingredient
for drilling mud formulation. Beneficiated Kankara Kaolin clay, barite, starch were used in the preparation of various drilling mud mixtures. Viscosity measurement were taken within 4.3s-1 and 34.1s-1 shear rates, the viscosity values ranged between 0.28Ns/m2 to
42.8Ns/m2, the shear stress values ranged between 34.06N/m2 to 606.908N/m2 for all the
samples. While densities of all the sample
mixture ranged between 1639 to 1792 kg/m3. Barite was observed to have the major effect on building density while the effect of kaolin, starch and water were slightly pronounced at a constant barite content. There were generally higher experimental density values compared to theoretical values. The densities gave hydrostatic pressure range between 32,124 kPa and 35,123 kPa for a well depth of 2000m. The rheological behavior of the fluid was not pseudo plastic thus kaolin clay was not a good additive in the production of drilling mud as it contributed mainly to fluid density.
Keywords: Drilling mud, Kankara kaolin clay, Density, Viscosity.
1. Introduction
Drilling fluid is very important in the oil and gas industry as it provides a conducive environment for carrying out effective and efficient drilling operations as well as improves completion and productivity of wells, it is often classified as water based, oil based and aerated drilling fluids [1], [2]. The selection and maintenance of the best drilling fluid in an oil, gas or geothermal industry is one of the main interests of drilling engineers [3]. Additives are often added to the drilling fluids to give specific properties to the mud especially in regards to the rheological and filtration properties of the mud [4],[5]. The gelling and swelling qualities of clays impart
colloidal properties to drilling mud that makes them different from viscous liquids such as honey or lubricating oil. The actual clays range from those that swell and hydrate very highly to those that do so only slightly [6]. Kaolin is an important industrial clay for economic benefit which is wide spread throughout Nigeria, almost every state in Nigeria has at least one known deposit of kaolin clay. It has fine particle size, inertness, non-toxicity and has a high proportion of alumino-silicate like the bentonite clay although unlike the bentonite clay, it does not have a good swelling ability [7]. Starch constituents are being used as an additive which swells and increases in volume due to free water absorption; it is a component of filtrating deposit which forms polymer-clayey mixture as it decreases the permeability of the deposits and reduces negative action of filtrate on sectors of borehole without drill pipe [8]. Drilling fluids properties such as apparent viscosity, plastic viscosity and yield point play important role in designing efficient and optimized drilling operation which serve the function of cleaning the rock fragments from beneath the bit and carry them to the surface as well as cooling and lubricating the rotating drill string and bit [9],[10],[11],[4]. Drilling muds are often described as thixotropic shear thinning fluids with a yield stress. Due to their complex composition, drilling muds exhibit an internal structure which is liable to modify according to the flowing and shear conditions, which may lead to non homogenous phenomena [4]. Related works carried out on drilling mud includes: [12],[13],[14],[15]. The objective of this research is to develop a drilling mud using some local clay minerals in Nigeria to perform the enumerated functions of a drilling mud since most of the raw materials at present are usually imported.
IJSER © 2012 http://www.ijser.org
International Journal of Scientific & Engineering Research, Volume 3, Issue 11, November-2012 2
ISSN 2229-5518
2. Methods and Materials.
2.1 Beneficiation of Kaolin
Three kilograms of raw kankara kaolin clay was poured into 10 liter of water in a 20 liter bucket and mixed thoroughly in a mixer emulsifier for about 72 hours, the clay was sieved with a 7μm sieve and the filtrate was allowed to settle down while continuously decanting the water. The concentrated clay was then transferred into centrifuge cups and set to rotate in the centrifuge for 30 minutes. The clay was then removed and spread on a pan then allowed to dry in an oven over a 60oC temperature. The dried clay was allowed to cool and was ground to fine sizes with mortar and pestle after which it was sieve with a 75um sieve until less than 75um particle sizes were gotten.
2.2 Making of Starch
Cassava tubers were peeled and cut into smaller sizes; it was then soaked in water and ground using an electric grinding machine to produce a paste. The paste was diluted with water and then sieved with a 75μm sieve while adding copious amount of water, the residue was discarded. The filtrate (suspension) was allowed to settle down while the water layer decanted. Further removal of water was done by centrifugation for 30 minutes and the solid starch spread on a tray and dried under sun. The dried starch was then ground using mortar and pestle while sieving with a 2000μm sieve to get particle sizes less than 2000μm. (API manual, 1979).
2.3 Mixing of Samples
Kaolin, barite and starch were weighed on a mettler balance depending on the amount required; the materials were poured into a
100ml beaker and mixed with a spatula. Water was added, mixed with spatula and transferred to the motor stirrer where the mixture was homogenized for 30 minutes. Viscosity measurements were immediately taken, using the viscometer.
The procedure was repeated for different amount of Kaolin, barite, starch and water for
12 samples of the mud mixture after every
viscosity measurement.
2.4 Viscosity measurement
The freshly mixed sample was transferred to a
50ml beaker (filled to the brim) and then the viscometer spindle was lowered into the mud
mixture. The viscometer was then started with
speed set at 2.5RPM and after 6 rotations of the spindle, dial reading was taken. This was
repeated for speeds of 5, 10, 20 and 50 RPM
with corresponding dial reading taken. Spindle conversion factors were used for the corresponding speeds to convert the dial readings to viscosities in centipoise. The values were recorded.
2.5 Density Determination for Materials Used
Six grams of barite was weighed and poured into a polyethene bag and ensuring that virtually all spaces in the bag were occupied after which it was weighed. The sample was dropped gently into a water filled (to the brim) beaker in a bigger bowl, the displaced water was collected and the volume taken. The density was determined by dividing the actual weight of the barite by the volume of the displaced water. This procedure was repeated for starch and kaolin respectively.
The weight of the 50ml beaker was taken then the prepared sample was poured into it to the brim after which it was reweighed using the mettler balance. An equal volume of water was poured into the 50ml beaker and weighed, the values were recorded. The density of the sample was determined using the equation:

ρ = x 100 (1) Where Wm is the weight of the mud and Ww is
the weight of an equal volume of water with a
density of 1000kg/m3. This gives the density of the samples, the same procedure was applied
for all the samples (A - L) and their various
densities determined.
3 Results and Discussion
The results gotten for the work carried out are as follows:
IJSER © 2012 http://www.ijser.org
International Journal of Scientific & Engineering Research, Volume 3, Issue 11, November-2012 3
ISSN 2229-5518
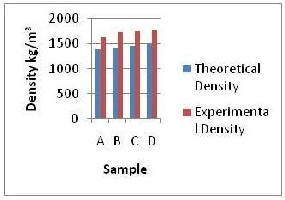
proportional decrease in the kaolin content between 36W% and 18W%. This increase was more pronounced between sample A and B which was due to higher increment in barite content (7W %) between the two compared to sample B and C (6W %) and sample C and D (5W %). This further accentuated the effect of barite as density building material because the decrease in kaolin content showed an almost negligible effect on density increase.
(a)
The experimental densities determined were observed to be higher than the theoretical densities. This could be explained by the fact that on thorough mixing of the samples, the void spaces especially in the tetrahedral layers were filled up with water which resulted in lower total volume of the mixture compared to the theoretical total volume of the mixture, and since the total mass of mixture remains constant, the density increased. The large difference noticed between the experimental and theoretical values (approximately 20%) were due to the high water content (50W %) which definitely showed a more pronounced volume decrease on mixing. The experimental
(b) (b) density values determined gave hydrostatic pressure in the range 32kPa, 124kPa &
34,966kPa for a well depth of 2000m, this hydrostatic pressure range was 60% (least was
10%) more than formation pressure and 28%
less than overburden pressure at this depth, this agrees with literature (Shell’s manual, 1995 and NL Baroid’s manual, 1979).
3.2 Density Variation with Kaolin, Starch and
Water Content being varied.
(c)
Figure 1: Density Variation of Drilling Mud
Samples.
3.1 Density Variation with Barite and Kaolin
Content being varied.
Samples A, B, C and D in fig. 1a shows the experimental density variation in barite and kaolin at a constant 1W% starch and 50W% water. There was a general increase in sample density as the barite content was varied from
13 W% to 31W% with an approximately
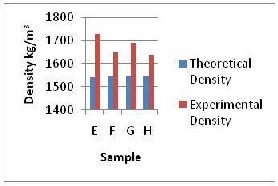
The formulations for samples E, F, G and H in Fig. 1b shows the density variation of the samples as starch, kaolin and water contents were varied with a decrease of 0.5W % in each kaolin and water content respectively and a
1W % increase in each starch content at a constant barite content (20W %). There was a sharp decrease in density from sample E to F, then an increase in density between sample F and G and a further decrease from sample G to H. For the first part (E and F) it was most probably due to the decrease in the amount of kaolin and water which are of higher density than that of the increased starch but it was not the case between sample F and G. The increase could be due to the increasing efforts of starch
IJSER © 2012 http://www.ijser.org
International Journal of Scientific & Engineering Research, Volume 3, Issue 11, November-2012 4
ISSN 2229-5518
as flocculant in the mixture, and it being polar, the positive side attaching itself to the negative face of the clay and the negative side to the positively charged edge of the clay materials. This encourages face to edge combination because of the difference in charges which results in a “card–house” kind of structure with a concomitant decrease in volume of the mixture. This causes increase in density. For samples G and H the reduction could be due to the lesser effect of starch in the volume of the mixture which makes the volume to be constant or slightly higher with a decreasing effect on density. The barite content did not increase the density content since it was kept constant in all the samples.
For the variation of experimental density values with theoretical values, the former were all higher (approximately 9%) than the latter value which was due to the effects of mixing on the volume of the mixture which makes the densities higher than theoretical. But the trends in the experimental values were different which was due to the same argument on the fluctuations in the experimental density values. The experimental values gave hydrostatic pressure ranging between
32,164kPa & 33869kPa at 200m well depth which was 57% (least 10%) above formation
pressure and 27% lower than the earth’s
overburden pressure. These also agree with
literature (Shell manual, 1995 and NL Baroid’s
manual 1979).
3.3 Density Variation with Barite, Kaolin and
Water contents being varied.
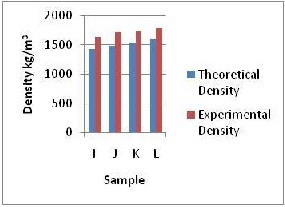
In the samples I, J, K, and L, there was a general increase in density values as the barite content was increased from 10W% to 25w% with a decrease in kaolin and water contents from 44.5W% down to 37.0W%. The non- uniform increment in the density values was due to the difference in density of barite increased and those of kaolin and water decreased and the effect of mixing which aids the filling of void spaces which made the volume of the total sample mixture less. The latter was also responsible for the difference between the experimental values and the theoretical (14%). The highest density for the whole sample range (A – L) was noticed for sample L with a barite content of 25W% which was higher than that of sample D with 31W% barite. This shows the effects of limited kaolin
on density. The content of which was lower in sample D compared to sample L. The densities for these samples gave hydrostatic pressures in the range 32,301 kPa & 35,123kPa at 2000m well depth which was 61% (least 10%) above formation pressure and 23% less than the overburden pressure. These values agree with literature (Shell’s manual, 1995 and NL Baroid’s manual 1979).
(a)
(b)
(c)
Figure 2: Viscosity Variation for Samples of
Drilling Mud.
IJSER © 2012 http://www.ijser.org
International Journal of Scientific & Engineering Research, Volume 3, Issue 11, November-2012 5
ISSN 2229-5518
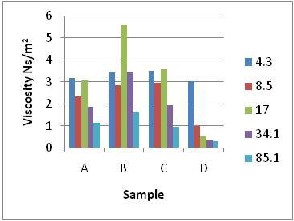
Fig.2a shows a decrease in viscosity from4.3s-1 to 8.5 s-1 shear rate which was due to the effect of increasing shear that decreases the internal resistance to flow as the shear rate increases. But there was a sudden increase in viscosity between 8.5 s-1 and 17.0 s-1 shear rates and then a drop in viscosity between 17.0 s-1 and
85.1 s-1 shear rate. Regression analysis of the values was carried out using the formula:
=k ( ) n –1 (2)
The power regression analysis was carried out by fitting the viscosities at different shear rates for all the samples, k and n values were determined with the correlation coefficient r and the square were tabulated in appendix.
Square of the correlation coefficient showed a
77% change in viscosity caused by a change in shear rate for sample A, 49% change in that of
sample B was caused by a change in shear rate and the higher values of 94% and 92% changes
in viscosity for samples C and D were noticed respectively. The viscosity value were
generally lower for sample D compared to A, B and C which was due to the higher water - kaolin ratio (28%) which reduced the level of
residence of resistance to the sliding movement by mud layers relative to one
another with a resultant decrease in the resistance to flow and a decrease in viscosity. This low viscosity values further agreed with
the k values of 5.419, 98.494, 1,211.967 and
1,176.148 for samples A, B, C and D
respectively. Highest viscosity was noticed at
4.3 s–1 shear rate and the least at 85.1s –1 shear
rate these agreed with literature trend (Shell’s
manual, 1995).
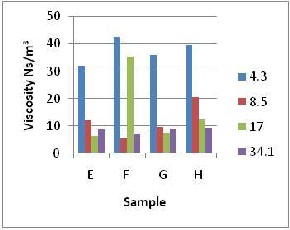
In fig. 2b sample E shows a decrease in viscosity from 4.3s –1 up to 17.0 s –1 shear rate and then increased between 17.0 s–1 and34.1 s-1 which was because of the decreasing resistance to the mud flow by the internal resistance of the mud within this range of shear rate and the resistance setting in again between 17.0 s –1 to
34.1 s –1 range. For samples F and G the decrease was to about 10.0 s –1 shear rate and
sharper increase in the viscosity before
becoming gradual. This was due to the same effect just that the increased starch content must have had a flocculation effect where reaction of the polar starch with the layers (face and edge) of the clay materials encourages face to edge arrangement in the
mud making it rigid, causing a resistance to the relative motion between different mud (fluid) layers with an attendant increase in the viscosity. Sample H showed a general decrease in viscosity with increasing shear rate within
4.3 and 34.1 s –1 shear rate range. Samples F
and G showed more shear thinning between
4.3 and 17.0 s –1 shear rate range.
High viscosity values were noticed for all the samples with the highest for sample F (42.80
Ns/m2) as shown in fig 2b. This was due to the
relatively high amount of kaolin content coupled with the flocculating effect of increased starch content and a constant barite content which made the whole mixture developing a resistance to shearing movement between layers of the mud with an increase in viscosity. The constant barite content implies a constant effect on the viscosity, since it does not react with water; it disperses the water – kaolin - starch matrix formed, with a decreasing effect on viscosity which was noticed in fig 2b as its content was increased.
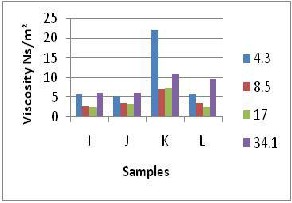
Fig 2c shows a general decrease in viscosity with shear rate increase for sample I, J and K between 4.35 and 10.0 s –1 but for sample L up to 17 s –1 to a minimum before increasing steadily with increasing shear rate up to34.1s –1
The steady increase was due to the increase reduction in the resistance to flow as the shear rate increases. The highest viscosity was noticed as shear rate increases. The highest viscosity was noticed at shear rate of 4.35 s –1. The steady increase was due to the increased reduction in the resistance to flow as the shear rate increases. The highest viscosity noticed at shear rate of 4.3s-1 was for sample K (22.0
Ns/m2) which was far off compared to the other samples seen in fig 2b. Although sample
K has the sample composition with sample E, the difference in the viscosities between them
could not be explained, most probably due to
inherent defect in the viscometer. The lowest viscosities were noticed at shear rate value which agreed with the inverse relationship with shear rate. Also the barite content seems to have effects on the viscosity since the viscosity values are lower compared to those at constant barite content.
The regression analysis taken shows very weak correlation as seen in table 2, so the K and N values were not used for the determination of
IJSER © 2012 http://www.ijser.org
International Journal of Scientific & Engineering Research, Volume 3, Issue 11, November-2012 6
ISSN 2229-5518
shear stresses to really see the variation with shear rate.
4. Conclusion
From the investigation carried out, the following conclusions were drawn:
Barite was the main determinant in the building of density based on the formulation made for this investigation as it was varied between 10W% and
31W%, giving density in the range of
1639 kg/m3 and 1792kg/m3.
Kaolin, starch and water showed marginal effects on density as they were increased at constant barite content.
The effect of barite on density was slightly hindered by dilution (higher water content) within the scope of this investigation.
The densities of the samples were in the range of 1639kg/m3 and
1792kg/m3 which gave hydrostatic
pressures in the range 32,124 kPa and
35, 123kPa at 2000m oil well depth.
The rheological behavior of the fluid was not pseudo plastic thus kaolin clay is not a good additive in the production of drilling mud, it only increases the weight of the fluid.
References.
[1] M.Vikas and V.P Sharma,
“Rheological Study of Water
Based Oil Well Drilling Fluid” Journal of Petroleum Science and Engineering 2004, 123-128.
[2] V.C Kelessidis, D. Marinakis and
C.Tsamantaki,“Laboratory
Assessment Of Drilling Fluid Formation Damage In Sandstone Cores And Mitigation With Lignite Additives For High Temperature Fields” Society of Petroleum Engineers, 2007, pp.1-
12
[3] A.Gursat, E.O Ali and S.Umran,
“Controlling Rheological and Fluid Loss Properties of Sepiolite Based Muds under Elevated Temperatures” Proceedings World Geothermal Congress, 2010, p1-8.
[4] P.Coussot, F. Bertrand and B.Herzhaft, “Rheological Behavior of Drilling Muds, Characterization Using Magnetic Resonance Imaging Visualization” Oil & Gas Science and Technology Vol. 59, 2004, 23-29.
[5] S.Salimi, “The Effects of Polymer Additives on the Rheological Behaviour of Water-Based Drilling Muds”, University of Tehran, 1999.
[6] O.F Joel and C.U Nwokoye, “Performance Evaluation of Local Bentonite with Imported Grade for Utilization in Oil Field Operations in Nigeria” Nigeria Annual International Conference and Exhibition, Tinapa - Calabar, Nigeria, 2010.
[7] B.S Badmus and O.B Olatinsu,
“Geophysical Evaluation and Chemical Analysis of Kaolin Clay Deposit of Lakiri Village, Southwestern Nigeria” International Journal of Physical Sciences, 2009, 592-606.
[8] R.Slawomir, K.B Zbigniew and
U.Malgorzata, “Study on the
Application of Starch Derivatives as the Regulators of Potassium Drilling Fluids Filtration” Chemistry and Chemical Technology, 2009,107-202.
[9] J.O Adeleye, K.K Salam and I.A Adetunde (2009), “Analysis of Rheological Properties of Treated Nigerian Clay Using Factorial Design” European Journal of Scientific Research Vol. 37 2009,
426-438.
[10] T.S Mihalakis, Makri, P.G, Kelessidis, V.C, Christidis, G.E and Foscolos A.E, “Improving Rheological and Filtration Properties of Drilling Muds with Addition of Greek Lignite” Paper presented at the 7th National Congress on Mechanics 2004, pp.1-6.
[11] M.J Badrul, L.L Chiou, Z.Azlina and Z.Juliana ,
“Dolomite as an Alternative
Weighting Agent in Drilling
Fluids” Journal of Engineering
IJSER © 2012 http://www.ijser.org
International Journal of Scientific & Engineering Research, Volume 3, Issue 11, November-2012 7
ISSN 2229-5518
Science and Technology 2007,
164-176.
[12] C.K Vassilios, P.Cassiani and F.Antonios (2008), “Application of Greek lignite as an Additive for Controlling Rheological and Filtration Properties of Water– Bentonite Suspensions at High Temperatures: A Review” International Journal of Coal Geology Vol. 77, 2008, 394-400.
[13] Vikas Mahto , “Development
of Water Based Oil Well Drilling
Fluids
Using Tamarind Gum and Partially Hydrolyzed Polyacrylamide” Mineral Processing Technology” Mineral Processing Technology,2007, 214-
216.
[14] E.E Georges-Ivo, “Kaolin deposits and occurrences in
Africa: Geology, mineralogy and
utilization” Applied Clay Science,
2010, 212-236.
[15] O.Omole , S.Malomo and
S.Akande, “The Suitability of Nigerian Black Soil Clays as Drilling Mud Clays” Applied Clay Science 2003, 357-372.
IJSER © 2012 http://www.ijser.org