International Journal of Scientific & Engineering Research, Volume 6, Issue 4, April-2015 1113
ISSN 2229-5518
ECG Trace Digitization Using Image Processing
Techniques
Hussain K. Khleaf1,3, Kamarul H. Bin Gazali1 ,Ahmed N Abdalla2 , Mithaq Na’ma Raheema3
Abstract— Some of the image processing techniques are developed for an electrocardiogram (ECG) feature extraction and signal regeneration as a digital time series signal. In general the ECG is recorded on a thermal paper which cannot be stored for a long time, because thermal trace over time becomes erased gradually. Some hospitals are saving the ECG thermal papers as scanning images in the electronic equipments (like computers) to maintain medical records, but this method needs to high memory capacity, and use less scanning resolution that gives signal accuracy is less at preview. The main aim of this paper is to extract the 12-lead ECG signals from the thermal paper and converting it to a digital time series signals. Feature extraction and the digital time series signal were tested on 30 of 12-lead ECG paper records from the MIT-BIH arrhythmia database, and the accuracy was between 96.31% and 98.25%. Evaluation of the proposed method for ECG feature extraction was done by comparing the obtained values with manual data and this method offered an accuracy of 98.06%. In addition can be using features extraction to perform an automatic heart disease classification using one of the artificial intelligence methods.
Keywords— Feature extraction; electrocardiogram (ECG); ECG image processing
—————————— ——————————
ecently the thermal paper Electrocardiogram (ECG), has been a common practice in heart disease diagnosis, and became a very helpful tool to assure of the patients help,
and the ECG thermal paper is important pointers to provide helpful information about the waveform shape for the heart, and can be reviewed periodically. For these reasons the hospi- tal managements store the ECG paper based records for the patient history repository. But there are significant challenges to keep these papers for large periods of time in the patient history repository (traditional repository or electronic reposi- tory). In the densely populated countries a huge storage space is required to save the ECG papers, also this method needs long retrieval time, finally the ECG is recorded on a thermal paper which cannot be stored for a long time, because thermal trace over time becomes erased gradually. These are in the traditional repository, and in the hospitals that use electronic repository (electronic equipments) to save the ECG thermal papers as scanning images are needed for high memory capac- ity, and use less scanning resolution that gives signal accuracy is less at regeneration.
The proposed method steps are shown below, and have been carried out in order to feature extraction and regeneration as a digital time series signal.
————————————————
1. Faculty of Electrical and Electronic Engineering, University Malaysia
Pahang, Pekan 26600, Malaysia.
2. Faculty of Engineering technology, University Malaysia Pahang, Gambang
26300, Malaysia.
3. Department of Electrical and Electronic Engineering, University of Tech-
nology, Baghdad, Iraq.
E-mail: eng_h_k_msc@yahoo.com
A. Scanning the 12-lead ECG paper, convert it into gray- scale levels and select the desired signal.
B. Separation of the desired signal from its background
(lines of squares grid).
C. The signal and the background lines must be of finite
thickness (one pixel must represent width lines).
D. Compute the size of the small and large square from
the background (scaling).
E. Signal period identification and find feature extrac-
tion.
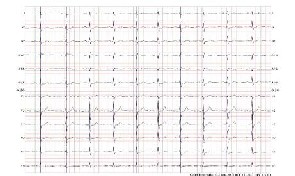
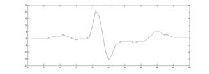
Typically, the 12-lead ECG signals are printed by thermal trace on the paper at 25mm/sec speed [1]. The optical scanning technology was used to scan ECG paper at 200 dpi (pixel or dots per inch) and stored as a color image in many types of format files such as (jpg, gif, …, and gif) [2]. Figure (1) shows the image of the 12-lead ECG paper. The first step was done by using the mouse to select and crop one of the 12-lead ECG signals as shown in the figure (2-a) for cropping III lead, and then converting the cropped color image into grayscale levels as shown in the figure (2-b).
Fig. 1. The color image of 12-lead ECG paper.
IJSER © 2015 http://www.ijser.org
International Journal of Scientific & Engineering Research, Volume 6, Issue 4, April-2015 1114
ISSN 2229-5518
(4)
a) Color image.
b) Grayscale levels
Fig. 2. Cropping the III lead.
This step is to isolate the target object (signal) from its back- ground in the selected (cropped) image and then digitizing it. First, finding the gray threshold. There are many algorithms do a fairly good job of finding the gray threshold such as Mean or Median value, Iterative Method, K-means and Otsu algorithm. In computer vision and image processing, the Otsu's method is used to automatically perform histogram shape-based image thresholding, [3] or, the reduction of a gray level image to a binary image. The algorithm assumes that the image to be thresholded contains two classes of pixels or bi- modal histogram (e.g. foreground and background) then cal- culate the optimum threshold separating those two classes so that their combined spread (intra-class variance) is minimal [4].
The graythresh function uses Otsu's method, which choos- es the threshold to minimize the intraclass variance of the black and white pixels. Multidimensional arrays are converted automatically to 2-D arrays using reshape. The graythresh function ignores any nonzero imaginary part [5, 6].
In the Otsu's method we exhaustively search for the threshold
that minimizes the intra-class variance (the variance within the
class), defined as a weighted sum of variances of the two clas-
ses:![]() (1) Weights
(1) Weights ![]() are the probabilities of the two classes sepa-
are the probabilities of the two classes sepa-
rated by a threshold t and ![]() variances of these classes.
variances of these classes.
Otsu shows that minimizing the intra-class variance is the
same as maximizing inter-class variance [4, 5].![]() (2) Which is expressed in terms of class probabilities
(2) Which is expressed in terms of class probabilities ![]() and
and
class means ![]() . The class probability
. The class probability ![]() is computed from
is computed from
the histogram as t :
![]() (3)
(3)
![]()
while the class mean is:![]()
Where ![]() is the value at the center of the
is the value at the center of the ![]() histogram bin. Similarly, you can compute
histogram bin. Similarly, you can compute ![]() and
and ![]() on the right-hand side of the histogram for bins greater than t.
on the right-hand side of the histogram for bins greater than t.
The class probabilities and class means can be computed itera- tively. This idea yields an effective algorithm.
1- Compute histogram and probabilities of each intensity
level.
2- Set up initial ![]() and
and ![]() .
.
3- Step through all possible thresholds t=1 … maximum in-
tensity.
![]()
a) Update and ![]() . b) Compute .
. b) Compute .
4- Desired threshold corresponds to the maximum ![]() .
.
5- You can compute two maxima (and two correspond- ing thresholds). ![]() is the greater max and
is the greater max and ![]() is the greater or equal maximum
is the greater or equal maximum
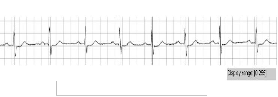
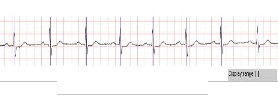
Desired threshold = (threshold1+ threshold2)/2 (5) The final desired threshold is self-calculated from the im-
age by using above algorithm, then using this threshold to
separate between two regions (desired represented by signals
and undesired represented by background grid lines and vice
versa). then convert it into black and white image as shown in
the fig. 3-a. and from this black and white image will be ob-
tained on the digital time series for signal as shown in the fig.
3-b. and redraw as discrete time signal (sampling signal) as
shown in the fig. 3-c.![]()
a
b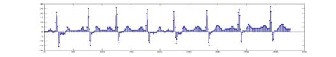
c
Fig. 2. Signal extraction. (a) Black and white image. (b) Digital time series for signal. (c) Discrete time signal.
In any image scanning, the signal lines are several pixels wide, and these pixels cause many values in the amplitude and time that can be read. In this step the method that can be used to achieve the slandering signal line is time slice. The time slice is a vector of pixel positions containing values transmitted by
IJSER © 2015 http://www.ijser.org
International Journal of Scientific & Engineering Research, Volume 6, Issue 4, April-2015 1115
ISSN 2229-5518
the scanner as it scans the signal line. The time lit pixel refers to a pixel whose value is the signal line [7].
After extracting signals now must measure the amplitudes and the periods with standard scale. The standard scale is cal- culated by extracting the background grid lines from ECG image, then computing how many pixels in the large and small squares (pixel scaling) [8].
The digital color image consists of a Red, Green and Blue (RGB) colors. Each pixel has a particular color, that color is described by the amount of RGB in it. If each of these compo- nents has a range (0 – 255), this gives a total of ![]() different possible colors. Such an image is a stack of three matrices rep- resenting the red, green and blue values for each pixel. This means that for every pixel there correspond 3 values [9].
different possible colors. Such an image is a stack of three matrices rep- resenting the red, green and blue values for each pixel. This means that for every pixel there correspond 3 values [9].
In most ECG papers, the signals tracing are drawn in black color and the background grid lines are drawn in red color [10]. By separating the RGB matrices and using some image processing techniques such as gray threshold as men- tion previously and special calculations (special calculation means using some traditional mathematical methods like mul- tiplication and division ..etc). We got the background grid lines and draw it as shown in the fig (3), and scaling each large square in 20 pixels and small square in 4 pixels. Now we have scaled to represent the amplitude axis (y-axis) for each 0.5mV by 20 pixels (vertically in large square) or for each 0.1mV by 4 pixels (vertically in small square), and in the time axis (x-axis) each 0.2Sec by 20 pixels (horizontally in large square) or for each 0.04Sec by 4 pixels (horizontally in small square).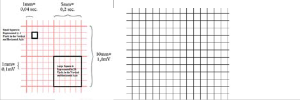
Fig. 3. Section of ECG background grid lines.
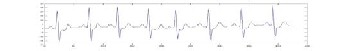
The period for each signal of 12-lead ECG is implemented by finding specific points, such as peaks and bottoms in the ex- tracted signals. Then record the values between these two points (peaks or bottoms) as a vector, and redraw these vector values (pixels) on the zero axis as shown in fig. (4) and com- pute their number. The final vector (sampling signal) is repre- senting period for one of the 12-lead ECG. Finally, feature ex- traction will be calculated from the final result (sampling sig- nal) as shown in the table (1).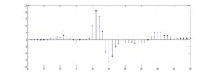
Fig. 4. Period for one of 12-lead ECG and it's sampling rate.
The proposed method is convert's the ECG signals that are stored as an image in the computer into a digital time series, and store them in the electronic files such as Microsoft Excel file and be easy to using it by the various computer programs. and so we were able to achieve the first goal it to minimize the storage file size and increase the storage capacity. The second goal is to redraw the signals as a digital signals series in the computers and then by using sampling signal directly to au- tomatically read and calculate the features. Table 1 shows a comparison between the proposed method and the manual method for one of the 12-lead ECG signals. This method of- fered an accuracy of 98.06%. This accuracy is represent the extent of matching between these two methods for taken the ECG features.
TABLE I.
COMPARISON OF THE PROPOSED METHOD AND MANUAL METHOD FOR ONE OF THE 12-LEAD ECG SIGNALS.
![]()
![]()
Morphology | Manual Method | Proposed Method |
Heart rate | 66 bpm | 65.45 bpm |
P Duration | 0.12 sec | 0.1222 sec |
QRS Duration | 0.11 sec | 0.115 sec |
T Duration | 0.24 sec | 0.24 sec |
PR Interval | 0.16 sec | 0.16 sec |
QT Interval | 0.42 sec | 0.42 sec |
ST Interval | 0.3 sec | 0.3 sec |
P Amplitude | 0.1 v | 0.11 v |
R Amplitude | 0.86 v | 0.85 v |
T Amplitude | 0.3 v | 0.3 v |
![]()
In this work, image segmentation is used for partitioning of an ECG as a digital image into multiple segments (sets of pixels). The goal of segmentation is to simplify and/or change the representation of an ECG image into something that is more meaningful and easier to analyze. Image segmentation is used to locate objects and boundaries (signals, lines, curves, etc.) in ECG images.
The advantage of this process is to self-extract information from an ECG image and convert them into real information that can be used by other processes via computer, such as di-
IJSER © 2015 http://www.ijser.org
International Journal of Scientific & Engineering Research, Volume 6, Issue 4, April-2015 1116
ISSN 2229-5518
agnosis of heart disease using artificial intelligence.
Also can be stored this information in the memory of the
computer devices, in the form of an electronic files that have
small size such as Microsoft Excel, or save as type (.xls, .txt, ...,
elc.). This gives us the liberation of large storage capacity, also
can redraw the signals and self-analysis, and this gives us re-
ducing the time and effort in the process of reading and inter- preting an ECG signal manually.
a.
[1] S. Jayaraman, P. Swamy, V. Damodaran and N. Venkatesh, (2012). "A Novel Technique for ECG Morphology Interpretation and Arrhythmia Detection Based on Time Series Signal Extracted from Scanned ECG Record", Advances in Electrocardiograms - Methods and Analysis, PhD. Richard Millis (Ed.), ISBN: 978-953-307-923-3.
[2] Huy Nhu Vo, (2009). "High-resolution Optical Scanning Holography".
Master Thesis in Electrical Engineering faculty of Virginia Polytechnic
Institute and State University,
[3] M. Sezgin and B. Sankur, (2004). "Survey over image thresholding techniques and quantitative performance evaluation". Journal of Electronic Imaging 13 (1): 146–165.
[4] Otsu, N., (1979). "A threshold selection method from gray-level histograms". IEEE Transactions on Systems, Man, and Cybernetics, Vol. 9, No. 1, 1979, pp. 62-66.
[5] P. Liao, T. Chen and P. Chung, (2001). "A Fast Algorithm for Multilevel Thresholding". JOURNAL of information Science and Enireering, Vol. 17, pp. 713-727.
[6] K. Hawari Ghazali, M.. Marzuki Mustafa, A. Hussain, (2008). "Implementation of Feature Extraction Technique from Gray Level Co- Occurrence Matrix to Classify Narrow and Broad Weed in Oil Palm Plantation". European Journal of Scientific Research, Vol 20, No.1, pp. 68-
75.
[7] H. Akkar, H. Karrem, (2006). " Learning Neural Networks for Detection and Classifcation of Biomedical Signal Section (Ecg)". MSc. Thesis Department of Electrical and Electronic Engineering University of Technology Baghdad / Iraq June 2006.
[8] D. Kumar, D. Thakur, S. Sharma, S. Bhardwaj, (2012). "ECG Paper Records Digitization through Image Processing Techniques". International Journal of Computer Applications". Vol. 48, No.13, pp.0975 – 888, June.
[9] C. Li , C. Xu, C. Gui, (2010). " Distance Regularized Level Set Evolution and Its Application to Image Segmentation ", IEEE Transactions On Image Processing, Vol. 19, No. 12, December 2010.
[10] R. JoyMarti s, C. Chakrabortya, A. Ray, (2009) ( "A two-stage mechanism for registration and classification of ECG using Gaussian mixture model". ScienceDirect journal Pattern Recognition, Vol.42 pp, 2979 – 2988.
IJSER © 2015 http://www.ijser.org