International Journal of Scientific & Engineering Research, Volume 6, Issue 1, January-2015 685
ISSN 2229-5518
Diagnosis of Liver Tumor from CT Images using
Digital Image Processing
Dr. Alyaa H. Ali, Entethar M. Hadi
Abstract— The detection and diagnose of liver tumors from CT images by using digital image processing, is a modern technique depends on using computer in addition to textural analysis to obtain an accurate liver diagnosis, despite the method's difficulty that came from liver's position in the abdomen among the other organs. This method will make the surgeon able to detect the tumor and then easing treatment also it helps physicians and radiologists to identify the affected parts of the liver in order to protect the normal parts as much as possible from exposure to radiation. This study describes a new 2D liver segmentation method for purpose of transplantation surgery as a treatment for liver tumors. Liver segmentation is not only the key process for volume computation but also fundamental for further processing to get more anatomy information for individual patient. Due to the low contrast, blurred edges, large variability in shape and complex context with clutter features surrounding the liver that characterize the CT liver images. In this paper, the CT images are taken, and then the segmentation processes are applied to the liver image which will find, extract the CT liver boundary and further classify liver diseases.
Index Terms— Computed Tomography (CT), Modified K-mean, Irregularity.
—————————— ——————————
1 INTRODUCTION
ccording to recent statistics, liver cancer is one of leading cancerous diseases in Iraq. Thus far, the only definitive test for liver cancer is needle biopsy. However, the nee-
dle biopsy is an invasive technique and generally not recom- mended unless there is an absolute need [1]. To avoid unnec- essary needle biopsy, doctors can take advantage of infor- mation provided by images acquired from various medical imaging systems such as surface texture, object boundary ex- traction, tumor detection, etc. to assist them to improve their diagnosis [2]. In this case, an effective image analysis is im- portant. Although many segmentation methods have been successfully used in medical imaging, it has found that most of them generally do not perform well in segmenting the liver boundary from a CT liver image [3]. This is mainly due to the fact that there are other organs adjacent and close to the liver which makes segmentation more difficult. In addition, the liver itself may also contain tumors such as hepatoma and haemagioma that can obscure the boundary [4]. In order to address these problems, we present an automatic CT liver im- age classification system which can be used to detect four types of liver tumor: hepatoma, haemagioma, cyst and cirrho- sis. The aim of this work is to segment a tumor in a liver; this will make the surgeon able to see the tumor and then will be easy for the treatment.
In this study, the CT images are taken, and then the seg- mentation processes are applied to the liver image which will find, extract the CT liver boundary and further classify liver diseaes.
————————————————
• Dr. Alyaa Hussein Ali/ Baghdad University/ College of Science for Wom- en, Iraq. E-mail: aliahusain@ymail.com
• Entethar Malek Hadi is currently pursuing masters degree program in Science for Women-University of Baghdad in physics (Digital Image Pro- cessing), Iraq. E-mail: entezarmalek@ymail.com
2 MASK CREATION
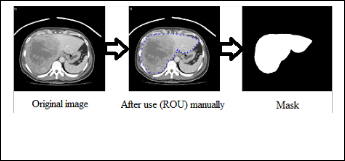
Mask Creation is used to create the binary mask which has the value of 0 or 1’s. This operation is performed by Specify polygonal region of interest (ROI) in MATLAB software [5]. This is used to draw around the edge of the liver manually, making it possible to discard all irrelevant information. Here we can see the result of our own encirclement of the liver:
Figure (1) Shows the mask creation.
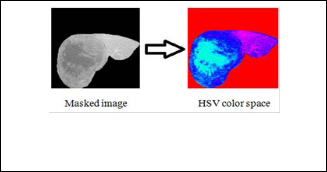
A binary image used as a mask. For masked filtering where the liver is giving the value 1 and the background is given the value 0, the final step involved applying the segmented mask in Figure (1) to the original image (Figure (1)), multiplying the final eroded image with the original image to give the masked image. Colors play an important role for object detection, tracking and recognition, etc. The problem of RGB (Red, Green, and Blue) does not provide the correct information about liver color due to the problem of X-ray effects and the presence of other organs of similar density to the liver, so we converted the masked image to HSV color space this can be seen in Figure (2).
IJSER © 2015 http://www.ijser.org
International Journal of Scientific & Engineering Research, Volume 6, Issue 1, January-2015 686
ISSN 2229-5518
Figure (2) Shows converted the masked image to HSV color space.
3 PROPOSED ALGORITHM FOR CT CLASSIFICATION
The basic principle of the proposed algorithm is integrating the contour with K-means clustering.
1. Read the HSV image.
2. Apply the decorrelation stretching for color separa-
tion.
3. Convert original image from HSV color space type to
L*a*b* color space.
4. Apply modified K-Means Clustering method which
depends on the color and distance for each sub image
of a*b* bands.
5. Depending on the result of clustering, label every pix- el in the image.
6. Create new segmented images depending on color.
7. Depending on the label pixel separate objects in im-
age by color.
8. Output the segmentation nuclei into a Separate Im- age.
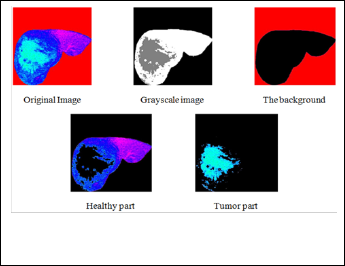
Then programmatically determine the index of the cluster containing the blue objects because K-means will not return the same cluster index value every time. We can do this using the cluster center value, which contains the mean 'a*' and 'b*' value for each cluster. This process can be seen in Figures (3).
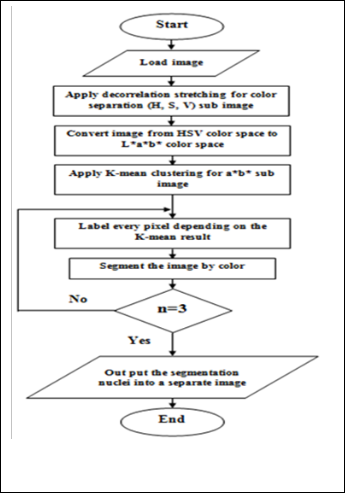
The K-mean clustering segmented the images depending on the distance and the color feature which is a modified K-mean. The traditional K-mean depends only on the distance between the centroid while the modified K-mean depends on both the distance and color. The result aims to developing an accurate and more reliable image which can be used to help the physi- cians for medical diagnosis which can be used in locating liver tumors, measure tissue volume and in more. The advantage of K-means algorithm is simple and quite efficient. It works well when clusters are not well separated from each other. There are different types of tumors in liver, may be as Hepatoma, Haemangioma, Cyst, or Cirrhosis. Suppose if it is a tumor, then K-means algorithm is to extract it from the liver cells. If there is any noise present in the CT image, it is removed be- fore the K-means process. The noise free image is given as in- put to the K-means and tumor is extracted from the CT image, then segmentation using thresholding of output in feature extraction. Finally, approximate reasoning for calculating tu- mor shape. The flowchart of histogram clustering and the k- means clustering is as shown in the Figure (4).
Figure (3) Shows the segmentation result.
Figure (4) Shows the flowchart of histogram and k-means clustering.
IJSER © 2015 http://www.ijser.org
International Journal of Scientific & Engineering Research, Volume 6, Issue 1, January-2015 687
ISSN 2229-5518
4 IMAGE SEGMENTATION USING K-MEAN
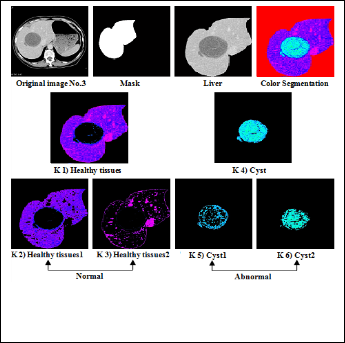
We take four different cases for each of the Hepatoma, Hae- mangioma, Cyst and Cirrhosis. We have implemented K- means clustering algorithm. Which is unsupervised clustering of images based on the color features. This process helps us to distinguish the normal liver tissue from the abnormal. See figure (5), figure (6), figure (7) and figure (8) shows this pro- cess. Also it helps us to distinguish between different types of liver tumors such as malignant tumor, benign tumor, Cyst and cirrhosis from the determination of the geometrical features for each class.
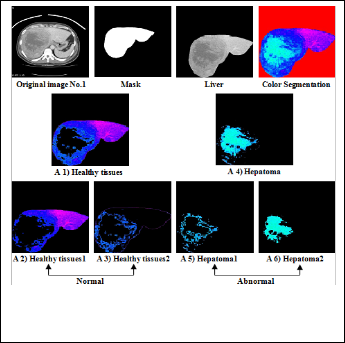
Figure (7) Shows the original image of Cyst with normal and abnormal part.
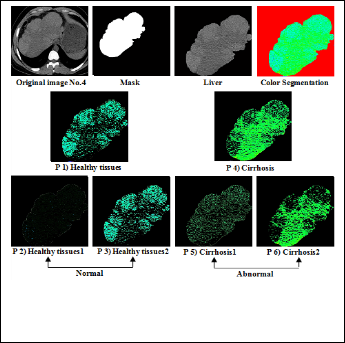
Figure (5) Shows the original image of hepatoma with normal and abnormal part.
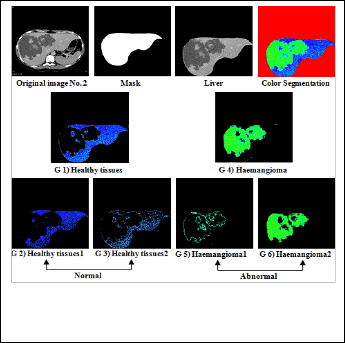
Figure (8) Shows the original image of Cirrhosis with normal and abnormal part.
5 AREA
Area of the segmented tumor is computed by counting, the number of pixels which have the value 1 in the image array. The area (A) in the object is the just a count of the ones in the image array. For computing area, binary image is used [6].
Figure (6) Shows the original image of haemangioma with normal  and abnormal part.
(1)
IJSER © 2015 http://www.ijser.org
International Journal of Scientific & Engineering Research, Volume 6, Issue 1, January-2015 688
ISSN 2229-5518
6 GEOMETRICAL FEATURE
Geometrical features like area, diameter, perimeter, and ir- regularity index have been estimated from the separated liver nodules. The number of pixels having the values (1) in the image array which gives the area of the segmented tumor im- age. The value (0) gives the background of the image which is black. Liver cancer is characterized partially by the irregularity in its tumor border. For this analysis, the irregularities in the tumor are computed by an index [7]:
 (2) Where, P is the perimeter of the tumor and A is area of the
tumor in pixels. The irregularity index is equal to 1 only for
circle and it is < 1 for any other shape. We took the value of each of the area and the perimeter of a tumor from the tables (1) to measure the irregularity index. Table (1) represented the value of the Area and the Perimeter for the tumors.
Average geometrical features for the hepatoma, haemangi-
TABLE 1
SHOWS THE VALUE OF THE AREA, PERIMETER AND IRREGULAR- ITY INDEX.
oma and cyst are included in Table (2). Texture or the contrast features are important features used in the classification of the liver cancers.
TABLE 2
AVERAGE VALUE FOR GEOMETRICAL FEATURES FOR ALL CASES
(ABNORMAL LIVER).
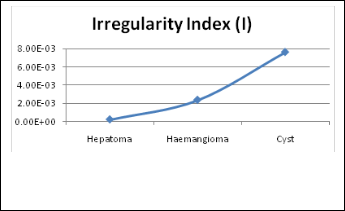
Figure (9) Shows the graph of the Irregularity index of different cases in table (2).
Figures (9) shows that the Hepatoma which has the lowest irregularity because the Liver cancer is characterized partially by the irregularity in its tumor border and it shapes are non homogeneous. The Cyst has the highest value so it shapes is more regularity than the other cases and more homogeneous in the texture than the others.
4 CONCLUSION
In medical field the doctors go for a manual technique to detect and locate the liver tumor, here is an approach to detect the tumor automatically. Tumor detection using CT image has been done using the digital image processing. We have devel- oped an automated method for the detection of tumors in liver CT images using Mask, color map, color segmentation, modi- fied K-means clustering and image processing techniques. The segmentation accuracy is obtained using the modified K- means clustering. Our system has been successfully tested on a large number of tumor images, liver tumor implemented for the discrimination of the normal and pathological tissues. The liver regions related to a tumor can be exactly separated from the liver image. Geometrical parameters which are perimeter, diameter and area have been calculated in order to obtain ir- regularity of tumor, which helps in the diagnosis of the type of tumor that was malignant, benign or Cyst. This system can be applied to detect tumor-like growth much before they are vis- ible to the human eye.
REFERENCES
[1] Upadhyay, Y. and Wasson, V. 2014. "Analysis of Liver MR Im- ages for Cancer Detection using Genetic Algorithm". Interna- tional Journal of Engineering Research and General Science. Vol.2, No.4, PP: 730-737.
[2] Kumar, P. Bhalerao, S. 2014. "Detection of Tumor in Liver Using Image Segmentation and Registration Technique". IOSR Journal of Electronics and Communication Engineering (IOSR-JECE). Vo.9, No.2, PP: 110-115.
[3] Selle, D.; Spindler, W.; Preim, B. and Peitgen, H. O. 2000. "Math- ematical Methods in Medical Imaging: Analysis of Vascular Structures for Liver Surgery Planning". PP: 1-21.
[4] Zimmer, C. and Olivo-Marin, J. C. 2005. "Coupled Parametric
Active Contours". Transactions on pattern Analysis and Ma- chine Intelligence. Vol.27, No.11, PP: 1838-1841.
IJSER © 2015 http://www.ijser.org
International Journal of Scientific & Engineering Research, Volume 6, Issue 1, January-2015 689
ISSN 2229-5518
[5] Chitra, S. and Balakrishnan, G. 2012. "Comparative Study for Two Color Spaces HSCbCr and YCbCr in Skin Color Detection". Applied Mathematical Sciences. Vol.6, No.85, PP: 4229 – 4238.
[6] Gonzalez, R. C.; Woods, R.E. and Eddins, S.L. 2009. Digital Im- ageProcessingUsing MATLAB. Gatesmark Publishing, 2 nd,. Printed in the United States of America.
[7] Patil, S. A. and Kuchanur, M.B. 2012. "Lung Cancer Classifica- tion Using Image Processing". International Journal of Engineer-
ing and Innovative Technology. Vol.2, No.3, PP: 37-42.
IJSER © 2015 http://www.ijser.org