 (1)
(1)International Journal of Scientific & Engineering Research, Volume 6, Issue 1, January-2015 627
ISSN 2229-5518
Diagnosis of DJF Rainfall Climatology and Asso- ciated Circulation Mechanisms over Zambia Libanda Brigadier1, 2*, Banda Noel3, Kapita Prince4
1 College of Atmospheric Sciences, Nanjing University of Information Science and Technology, No. 219 Ning Liu Road, Nanjing, China:
2Zambia Meteorological Department, Kabwe, Zambia
3 Malawian Department of Climate Change and Meteorology Services, Lilongwe, Malawi
4 Zambia National Broadcasting Corporation, Lusaka, Zambia
Abstract: In order for a developing country like Zambia to be able to positively respond to and withstand the social-economic impacts of droughts and floods, scientific analysis of historical rainfall patterns and associated circulation anomalies is significant. In this paper, we describe the rainfall climatology and trends from 1960 – 2010. Monthly rainfall data for 38 meteorological stations archived by the Zambia Meteorological Department (ZMD), monthly precipitation datasets from the Global Precipitation Climatology Centre (GPCC) and reanalysis datasets are used. Composite analysis was deployed to understand the circulation anomalies during the time of study. Analysis of wind, ve- locity potential and divergence/convergence over the study area showed that wet years were characterized by convergence in the lower troposphere implying rising motion and divergence at the upper level. On the other hand, dry years were characterized by divergence in the lower troposphere implying sinking motion and convergence at the upper level. A relationship between variations in rainfall patterns over Zambia and El Niño Southern Oscillation was explored and found. The study found that El Niño conditions (warm phase) bring drier than average conditions in the wet summer months (DJF) in the southern half of the country, whilst the north of the country simultaneously experiences significantly wetter than average conditions. The reverse pattern occurs with La Niña (cold phase) episodes, with dry condi- tions in the north and wet conditions in the south.
Index Terms : Climate, Rainfall, Interannual Variability, ENSO, Anomalies, DJF, Zambia.
—————————— ——————————
Much of the economic, cultural and social life of Zambia is dominated by the onset and offset of the rain season, and the amount of rain it brings. Failure of the rains causes hunger from time to time [1]. Excess of the rains also causes damage to crops and property. Precipitation is thus, one of the most important parameters for the Southern African developing country. With Zambia’s high vulnerability to climate change [2], the study and analysis of factors influencing precipitation have become imperative. It is therefore of great importance to have a good understanding of previous climate events and their impacts so as to make reliable and accurate forecasts to minimize the impact of these extreme occurrences of climate [3]. To improve long range forecasting further, better under- standing of the climate variability of the region and assessing rainy season characteristics and the possible relationships be- tween large-scale climate modes or identifiable regional circu- lation anomalies and dry and wet spell characteristics need to be investigated. [4].
Zambia experiences a sub-tropical climate with three distinct seasons; a dry and hot season from mid-August to November with temperatures in the range between about 26 and 38 °C, a dry and cool season from May to mid-August with tempera- tures in the range between about 13 and 26 °C and a rainy sea- son from October/November to March/April [5]. During the rainy season the temperatures range between about 27 and 34
°C [6]. Over Zambia, annual rainfall totals fall within the range of 500mm and 1400mm. The highest rainfall is in the north, es- pecially the north-west and the north-east, decreasing towards the south; the driest areas are in the far south west and the Lu- angwa River and middle Zambezi River valleys, parts of which are considered semi-arid. None of the country is considered arid or to be desert.
On a mesoscale, topography, temperature, atmospheric pres- sure and evapotranspiration are some of the factors that influ- ence precipitation [7]. The relationship between the El Niño Southern Oscillation (ENSO) and widespread precipitation patterns is one of the most significant factors [8]. ENSO is a major contributor to inter-annual climate variations in Africa and beyond [9]. The Southern African inter-annual rainfall variability is known to be linked to the ENSO. During El Niño, warm episode, Zambia has a high risk of severe drought while during the cold episode, La Niña, most parts of Zambia expe- rience above average rainfall [10, 11, 12, 13, 14).
Rainfall data from 38 Meteorological Stations spread across
IJSER © 2015 http://www.ijser.org
International Journal of Scientific & Engineering Research, Volume 6, Issue 1, January-2015 628
ISSN 2229-5518
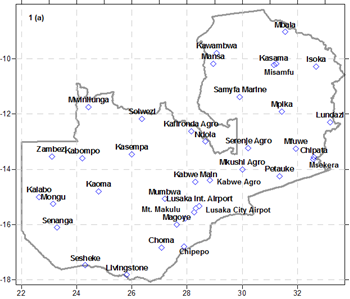
Zambia has been used to compare and validate Global Precipi- tation Climatology Centre (GPCC) data. Figure 1 presents the distribution of the stations used in the study to validate the Climatic Research Unit (CRU) precipitation data. For further analysis, we continued to use the monthly precipitation da- taset from the Global Precipitation Climatology Centre (GPCC). It is calculated from the global station data [15]. GPCC Precipitation data is provided by the NO- AA/OAR/ESRL PSD, Boulder, Colorado, USA. This data is used because the African rain-gauge data has many spatial and temporal discontinuities over large sections of Africa [16,
17]. We also used reanalysis fields from the National Center for Environmental Prediction/National Center for Atmos- pheric Research (NCEP/NCAR) , including zonal and meridi- onal wind and velocity potential, with a horizontal resolution of 2.50 X 2.50.
Pressure is often a convenient vertical coordinate to use in place of altitude [18]. In pressure coordinates the vertical ve- locity is defined as:
(1)
and is commonly called simply omega. Therefore, Omega is defined as a partial differential equation for the vertical veloci- ty which is defined as a Lagrangian rate of change of pressure with time. The equation reads:![]()
) (2)
where ƒ is the Coriolis parameter is the static stability, is the geostrophic velocity vector, is the geostrophic relative vortici- ty, is the geopotential, is the horizontal Laplacian operator and is the horizontal del operator [19]. The units of w are Pa/s (often microbars per second, μb/s, is also used).
Composite analysis is used in this study. It involves identify- ing and averaging one or more categories of fields of a varia- ble selected according to their association with key conditions. Results of the composites are then used to generate hypothe- ses for patterns which may be associated with the individual scenarios [20, 21]. In this study, the key conditions for the composite analysis are wet/flood year and dry/drought year, where the composites for wet and dry years were separately done, especially for wind vector, This is mainly to detect the circulation anomalies associated with wet/dry events over the region. A number of authors, including [22] and [23] have
used composite methods in their analyses over the African continent.
Correlation analysis reveals simple relationship between pairs of variables. In this study, correlation analysis is aimed at es- tablishing whether the areal average DJF rainfall (DJF index) is representative of the different stations used in the study. DJF index is correlated with individual station DJF rainfall over the study area. [24].
In this chapter the results obtained from the various methods that were used to address the objectives of the present study are presented and discussed in their respective sub-sections.
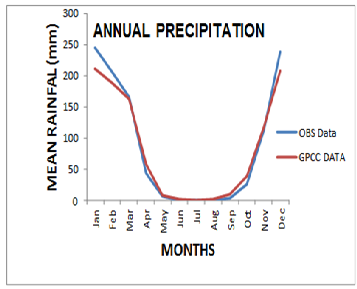
The annual cycle of rainfall over Zambia was examined based on both station rainfall and the Climate Research Unit (CRU) in an attempt to validate the CRU dataset, which was used in subsequent analyses. Results (Figure 2) shows that the two datasets are in agreement, with higher rainfall amount noted between November and March, whereas the least amount is recorded between May and September.
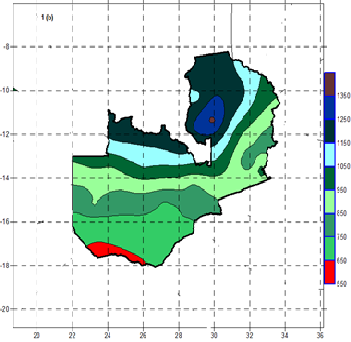
The stations used in the study and their locations are shown in Figure 1(a). Figure 1(b) displays the average seasonal rainfall over the study area. From the figure, it can be seen that the north and northwestern regions such as Samfya, Msekera, Mwinilunga and Mansa, tend to receive more rainfall com- pared to other regions of the country.
IJSER © 2015 http://www.ijser.org
International Journal of Scientific & Engineering Research, Volume 6, Issue 1, January-2015 629
ISSN 2229-5518
The standardized anomaly of December - February rainfall for the study period is shown in Figure 3.
Analysis of the interannual variability of the mean DJF rainfall
(Figure 3) shows that 2004 was a wet year during the period
1960-2010. This year (2004) is further examined in this study
alongside the drought year (1982) in order to understand the
prevailing circulation anomalies in the region during flood
IJSER © 2015 http://www.ijser.org
International Journal of Scientific & Engineering Research, Volume 6, Issue 1, January-2015 630
ISSN 2229-5518
and drought events.
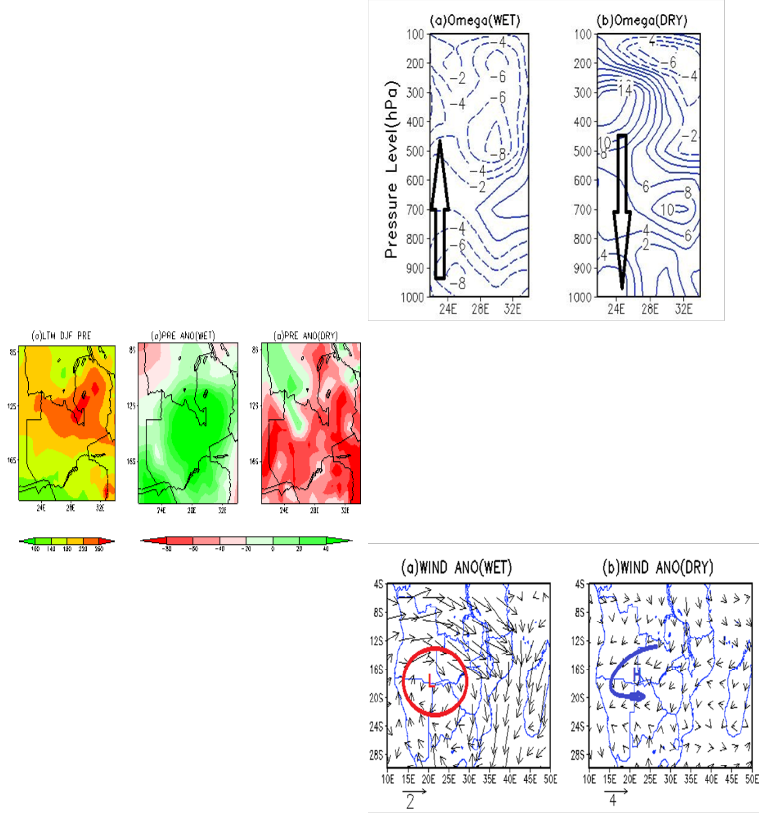
In general, the northeastern and northwestern parts of the country and Copperbelt provinces receive more rainfall com- pared to the rest of the country (Figure 4). The least amount of rainfall is observed in the south eastern and southwestern parts of the country. Further analysis of the spatial distribu- tion of rainfall during wet and dry years shows that the wet year was dominated by positive rainfall anomalies (Figure 4b), as opposed to the dry year which had negative rainfall anoma- lies in most regions of Zambia (Figure 4c).
When we analyzed the anomalous horizontal wind vectors associated with wet and dry events over the region of study, the results showed that at 850 hpa level, there exists an anomalous convergence zone (marked L) over the region in the wet year (Figure 6a). Convergence at low level (850hpa) leads to ascending motion which favors rainfall, hence wet year; 2004. The dry year (Figure 6b) exhibits anomalous high pressure system (H) over the study area, depicting divergence at this level, which suppressed rainfall, hence dry year; 1982.
In order to understand the vertical motion associated with wet and dry events over the region, we investigate the pressure vertical velocity (Omega). Results show that the wet year was dominated by negative anomalies, which depict rising motion (Figure 5a). Rising motion is associated with convergence at low level and divergence at upper level. Dry year on the other hand was characterized by positive anomalies (Figure 5b), which exhibits sinking motion. Sinking motion may be associ- ated with convergence at upper level and divergence at low level. Convergence at low level leads to vertical stretching, whereas divergence leads to vertical shrinking which sup- presses convection due to subsidence [25].
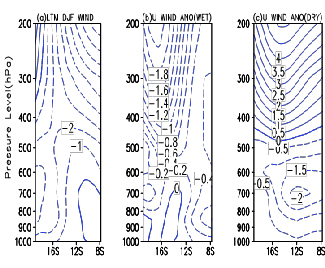
The zonal wind is further investigated to understand its behavior during wet and dry events. Results (Fig.7) show that the climatology of zonal wind is characterized by easterly flow (Fig. 7a), except at low level. During wet year, this flow is re- versed with westerlies dominating at the lower level and east- erlies on high level as observed in the anomalous vertical cross section of the zonal wind (Fig. 7b). This flow is reversed dur-
IJSER © 2015 http://www.ijser.org
International Journal of Scientific & Engineering Research, Volume 6, Issue 1, January-2015 631
ISSN 2229-5518
ing dry year (Fig. 7c), with easterlies dominating below 500 hpa, as westerlies dominate above this level.
Results reveal that from 1960 to 2010, Zambia experienced an equal number of wet and dry years. However, the intensity of the wet events was more than that of the dry events. Analy- sis of the drought and flood years with respect to the different variables including wind, velocity potential and diver- gence/convergence vectors revealed that the drought (flood) years were characterized by divergence (convergence) in the lower troposphere and convergence (divergence) at the upper level, implying sinking (rising) motion, especially over the western Indian Ocean and the study area. The anomaly con- vergence zone was identified within (outside) the region of study during flood (drought) years.
The study also showed that the observed atmospheric circula- tion associations with wet and dry events can be monitored in future to avert the losses associated with wet and/or dry events.
Profound gratitude goes to the Jiangsu Provincial Government of the People’s Republic of China Scholarship Council for the financial support and the Zambia Meteorological Department for providing the station data used in this research work. The authors are profoundly grateful to Climatic Research Unit (CRU) and National Center for Environmental Predic- tion/National Center for Atmospheric Research
(NCEP/NCAR) and ECMWF for the provision of reanalysis datasets used in this study and Nanjing University of Infor- mation Science and Technology for the provision of the re- quired facilities for data analysis.
The author declares no conflict of interest.
1. Barnett T. The effects of HIV/AIDS on farming sys- tems and rural livelihoods in Uganda, Tanzania, and Zambia. FAO project TSS/1 RAF/92/TO/A, 1994, 164–279
2. Hachigonta S. and Reason CJC. Interannual variabil- ity in dry and wet spell characteristics over Zambia. Clim Res,
2006, 32, 49–62
3. Ogwang BA, Guirong T, Haishan C. Analysis of Sep-
tember - November Drought and the Associated Circulation
Anomalies Over Uganda. Pak. J. Meteorol. 2012, 17, 11-24.
4. Glantz M.H, Katz R.W, Nicholls NCane M.A. Fore-
casting El Niño with a geophysical model. In Teleconnections
linking worldwide climate anomalies. UK: Cambridge Univer-
sity Press. 1991, 345–369..
5. Jury MR, Pathack B. A study of climate and weather
variability over the tropical southwest Indian Ocean. Meteor-
ology and Atmospheric Physics, 1991, 47, 37-48.
6. Goddard L, Mason S.J, Zebiak S.E, Ropelewski C.F,
Basher R, Cane M.A. Current approaches to seasonal to Inter-
annual climate predictions. Int. J. Climatol. 2001, 21, 1111–
1152
7. Hoerling M. Detection and Attribution of Twentieth-
Century Northern and Southern African Rainfall Change. J.
Climate, 2006, 19, 3989-4008
8. Reason CJC, Landman W, Tennant W. Seasonal to de-
cadal prediction of Southern African climate and its links with
variability of the Atlantic Ocean. Bull. Amer. Meteor. Soc.
1996, 87, 941-955.
9. Lindesay JA, Harrison MSJ, Haffner MP. The South-
ern Oscillation and South African
rainfall. S. Afr. J. Sci., 1986, 82, 196-198
10. Washington R, Preston A. Extreme wet years over
southern Africa: Role of Indian Ocean sea surface tempera- tures, J. Geophys. Res, 2006, 11, D15104
11. Nicholson SE, Kim J. The relationship of the El Nino- Southern Oscillation to African rainfall. Int. J. Climatol.,
1997a, 17, 117-135
12. Nicholson SE. An analysis of the ENSO signal in the
tropical Atlantic and western Indian Oceans. Int. J. Climatol.,
1997b, 17, 345-375.
13. Glantz M.H, Katz R.W, Nicholls Cane M.A. Forecast-
ing El Niño with a geophysical model. In Teleconnections link-
ing worldwide climate anomalies. UK: Cambridge University
Press. 1991, 345–369.
14. Cane M, Eshel G, Buckland R. Forecasting Zimba- bwean maize yield using eastern equatorial Pacific sea surface temperature. Nature, 1994, 370, 204-205.
15. Schneider U, Becker A, Finger P, Meyer-Christoffer A, Ziese M, Rudolf B. GPCC's new land surface precipitation cli-
IJSER © 2015 http://www.ijser.org
International Journal of Scientific & Engineering Research, Volume 6, Issue 1, January-2015 632
ISSN 2229-5518
matology based on quality-controlled in situ data and its role in quantifying the global water cycle. Theor Appl Climatol,
2013, 115(1-2): 15-40
16. Schreck JC, Semazzi FHM . Variability of the Recent
Climate of Eastern Africa. Int J Climatol, 2004, 24: 681 - 701.
17. Ogwang BA, Chen H, Li X, Gao C. The influence of
Topography on East African October to December climate: Sensitivity experiments with RegCM4. 2014, doi.org/10.1155/2014/143917
18. Singh and Rathor Reduction of the Complete Omega
Equation to the Simplest Form. Pure Appl. Geophys, 112, 219-
223
19. Holton JR. An Introduction to Dynamic Meteorology,
Academic Press, 1992, 166-175
20. Folland CK, Knight J, Linderholm HW, Fereday D,
Ineson S, Hurrel JW, The summer North Atlantic oscillation:
past, present, and future. J Climate, 2009, 22(5): 1082-1103.
21. Folland CK Regional-Scale Interannual variability of
climate. A north-west European perspective. Meteorol Mag,
1983, 12: 163-187
22. Okoola RE A diagnostic study of the East African
monsoon circulation during the northern hemisphere spring
season. Int J Climatol, 1999, 19: 143-169
23. Ininda JM. Numerical simulation of the influence of
sea surface temperature anomalies on the East African season-
al rainfall. PhD Thesis, 1995, University of Nairobi, Kenya
24. Wilks SD Statistical Methods in the Atmospheric Sci-
ences. 2nd edn, Academic Press, 2006, San Diego.
25. Barnston AG, Livezey RE Classification, seasonality
and persistence of low-frequency atmospheric circulation pat-
terns. Mon Weather Rev, 1987, 115: 1083-1126.
IJSER © 2015 http://www.ijser.org