International Journal of Scientific & Engineering Research, Volume 4, Issue 8, August-2013 1863
ISSN 2229-5518
Masime Jeremiah O*, Wanjau Ruth, Murungi Jane, Onindo Charles
Department of Chemistry, Faculty of Science, Kenyatta University, Nairobi, Kenya
Abstract
1.0 INTRODUCTION
Nitrate is an inorganic chemical that is highly soluble in water. It is a well-known contaminant of ground and stream water as well as an important environmental and human health analyte, thus its detection and quantification are considered to be essential [8]. Major sources of nitrate in drinking water include fertilizers, sewage, rodenticides (to kill rodents), food preservatives [16], animal manure, malfunctioning septic systems and construction sites using explosives. They may also enter water via fertilizers from agricultural runoffs, during thunderstorms and lightning [1]. Most nitrogen containing materials in natural waters tend to be converted to nitrate which are actually the products of aerobic stabilization of organic nitrogen [1]. This ion also occurs naturally in the environment, in mineral deposits, soil, seawater, freshwater systems, and the atmosphere [1].
Nitrates and nitrites are commonly used as a preservative and
for color enhancement of processed meats, although the
amounts added to these products have been substantially reduced from the levels once used. Sodium and potassium nitrates are used as fumigants in canisters, which are placed underground in rodent dens and holes, and then ignited to explode and release gases that kill the rodents [16].
Likely exposure pathways for children include ingesting contaminated drinking water, most commonly of concern for private wells [16]; and foods containing preservatives, particularly cured meats such as hot dogs and lunch meats [16]. Nitrates have also been detected in fruits and vegetables [16]. The nitrate and nitrite ions are important indicators of pollution by organic materials as nitrogen from decomposing organic substances often ends up as nitrate or nitrite ions. The determination of nitrate is often difficult because of the low levels found and the distinct possibility of interfering materials being present. Their concentrations in surface and ground water vary within wide limits depending on geochemical conditions, human and animal waste management practices
and on industrial discharge of nitrogen compounds [1].
IJSER © 2013 http://www.ijser.org
International Journal of Scientific & Engineering Research, Volume 4, Issue 8, August-2013 1864
ISSN 2229-5518
Nitrate is a health hazard because of its conversion to nitrite. Nitrate poisoning in children has been reported from drinking water containing between 15 and 250 mg/l of nitrate. Infants are especially susceptible because their stomach juices are less acidic and therefore conducive to the growth of nitrate reducing bacteria [3]. Babies generally consume large quantities of water relative to their body weight, especially if water is used to mix powdered or concentrated formulas or juices. Infants under three months of age are especially susceptible to nitrate toxity [3].
Once ingested, conversion of nitrate to nitrite takes place in the saliva of people of all age groups, and in the gastrointestinal tract of infants. Infants convert approximately double, or 10 percent of ingested nitrate to nitrite compared to 5 percent conversion in older children and adults. The health hazards from consuming water with nitrate are related to the direct toxicity of nitrite—that is, its ability to directly oxidize hemoglobin, changing it to methemoglobin, which cannot bind oxygen. Accumulation of methemoglobin (methemoglobinemia) occurs if this oxidation process overwhelms the protective reduction capacity of the cells. This reaction takes place in the saliva of humans at all ages and in the gastrointestinal tracts of infants during the first three months of life [2].
The best-known effect of nitrite is its ability to react with haemoglobin (oxyHb) to form methaemoglobin (metHb) and nitrate:
As a consequence of the formation of metHb the oxygen delivery to tissue is impaired.
This causes a bluish colouration of the skin and mucus membrane, situation which may lead to death. This condition
occurs when nitrate in the water is converted to nitrite which is
absorbed into the bloodstream and bond with the hemoglobin in the blood. This prevents the hemoglobin from carrying oxygen resulting in an oxygen deficiency in the infant [4]. A high level of nitrate is also believed to cause esophagus cancer [5]. A study conducted in Russia, revealed that children are more sensitive to nitrate than adults. There were clear relationships between the nitrate contents in potable water and the methemoglobin contents in blood. A thickened bluish grey colour of the skins or a cyanotic lesion around the mouth was identified both in children and the adults as well, who were drinking the nitrate containing water. In children the situation was more apparent than in most of the adults [5]. Numerous studies have suggested a link between the consumption of water containing elevated concentrations of nitrate with various forms of cancers such as stomach, bladder and brain [7]. Nitrate itself is generally considered to be harmless at low concentrations. The specter of a cancer risk posed by nitrite and nitrate is invariably accompanied by concern about exposure to preformed N-nitrosamines or N-nitrosamines formed in the stomach from ingesting foods enriched in nitrite and nitrate. Nitrites react with amines or other nitrosatable substances present in food to produce N-nitroso compounds in the body. These nitrosamine are known to cause cancer. Nitrates also cause brain damage and even deaths in some infants [8]. Several authors have suggested that the risk for the development of stomach cancer is positively correlated with three factors: the nitrate level of drinking water, the urinary excretion of nitrate and the occurrence of atrophic gastritis. Epidemiological studies have not provided any evidence that there is an increased risk of cancer related to high nitrate intake from sources other than vegetables. In some cases
studies revealed a negative correlation between nitrate intake
IJSER © 2013 http://www.ijser.org
International Journal of Scientific & Engineering Research, Volume 4, Issue 8, August-2013 1865
ISSN 2229-5518
and gastric cancer, because vegetables are an excellent source of vitamins, minerals and biologically active compounds [19].
The U.S. Environmental Protection Agency (EPA) maximum contaminant level (MCL) for nitrate in drinking water of 10 mg/L nitrate-nitrogen (nitrate-N) (equivalent to 45 mg/L as nitrate) and the World Health Organization (WHO) guideline [17] of 50 mg/L as nitrate (equivalent to 11 mg/L as nitrate-N) were promulgated to protect against methemoglobinemia, or “blue baby syndrome,” to which infants are especially susceptible [18].
Food is usually the major source of nitrate exposure. Nitrate intake from a typical US diet provides an average of 75 to 100 milligrams per day (mg/day) of nitrate. Nitrate can be found at high concentrations, ranging from 200 to 2500 mg/kg, in vegetables and fruits. Vegetables constitute a major source of nitrate, providing over 85% of the average daily human dietary intake. Many vegetables have been reported to contain high levels of nitrate, including lettuce, spinach, red beets, fennel, cabbage, parsley, carrots, celery, potatoes, cucumbers, radishes and leeks [22]. Infection and illness can cause the body to produce even greater levels of nitrate. When the average concentration of nitrate in food from the United Kingdom total diet studies were combined with the corresponding consumption from the 13 clustered diets, total dietary exposure ranged from 58 to 218 mg per day [21]. Vegetables such as beets, celery, lettuce, radishes and spinach contribute about 85 to 90% of an adult's dietary intake of nitrate, with nitrate levels ranging from 1700 to 2400 mg/kg food [20].
If a starchy food grain is fermented, it produces enzymes,
which start to break the starch down into sugar. This is how
growing plants derive energy; and this is how people release sugar from grains so that they can make alcohol from them, by brewing the grains into beer. In the nineteenth century, brewing was the usual process of making alcoholic beverages in most parts of East Africa; mostly the grain used was finger millet (elevisine) but some people used sorghum. Busaa is prepared from cereals, chang’aa is a distilled brew consumed in most parts of Kenya [14]. They are made from a variety of grains - malted millet and malted maize being the most common. It has a pleasant sweet flavour and contains at least 50% alcohol [9]; miti is prepared from boiled roots and honey, while muratina is prepared from sugarcane or honey, which is fermented using sausage plant (Kigelia african). The conditions and raw materials used to prepare these homemade brews/spirits may introduce toxic materials into the alcohols and hence the need for continuous monitoring of the levels of nutrients in the alcohols to make sure that the population is not exposed to dangerous levels.
In the twentieth century, maize has become a common ingredient in the making of alcoholic brews [9]. Sorghum also has been the basis of traditional African beers such as the clear beers of West Africa (dolo and pito) and the opaque beers of southern Africa. There are many other raw materials as well, which include bananas, coconuts, palm fluid, honey, pineapples, paw paws and many other fruits. Some of the techniques used are by no means new. Other techniques like those for distilled brews are new [10]. Brewing from grain takes several days. In most cases there is no attempt to control the yeast other than the constant reuse of the same containers for brewing. Once brewed, the beer lasts for only a day or two; as a ‘live’ brew, spoils quickly, and if not drunk within about forty-
eight hours it will be spoiled. Nor can it be transported any
IJSER © 2013 http://www.ijser.org
International Journal of Scientific & Engineering Research, Volume 4, Issue 8, August-2013 1866
ISSN 2229-5518
great distance, for the continuing fermentation produces gases, which make it impossible to seal the beer in a container [9].
Sixteen (16) stations were targeted in slum areas around Nairobi County and small towns around it where homemade brews are used. Ten samples of each brew, the raw materials needed in the making those homemade brews and tap water as a blank were selected. A total of one hundred and thirty two (132) home-made alcoholic beverages, forty eight (48) water and eighteen (18) raw materials samples were analyzed for nitrate. Samples of maize, millet, sorghum, honey, jaggery and muratina were selected. Three samples of each raw material (total 18) were obtained from various places in the sixteen stations. These samples were randomly collected from various parts of Nairobi and its outskirts, taking into account the requirements for the preparation of the homemade brews. This information was obtained by questioning the people who sell as well as from those who use the homemade brews.
These sample of raw materials were acquired from market places nearest to the beverage sampling stations. The solid
raw material samples were crumbled by a teflon blender and the flours were put in nylon bags with shackles to prevent contamination with air and therefore the effect of humidity on nitrate content of the samples was deterred. All samples were stored at –20 °C until the analysis [10].
For each sample, 10 g of ground raw materials were used for the nitrate analysis. 40 ml hot water was added on the sample and blended for 5 min in a blender. The mixtures were heated to 75ºC for the prevention of ascorbic acid interference. The solutions were transferred to a volumetric glass and 50 ml hot water and 12 ml sodium hydroxide (2% w/v in water) was added and blended again for another 10 mins. 10 ml of zinc hydroxide (7.2% w/v in water) was added and the mixture was shaked for 5 min. The next step was to add 5 ml sodium hydroxide and the mixture was blended for 5 min. Distilled water (83 ml) was added and mixed for 5 min. The last volume was 200 ml. The mixtures were filtered using filter paper (Whatman No. 1) until the filtrate was completely clear. The filtrate solution was used for determination of nitrates.
All chemicals for nitrate analysis were analytical reagent grade. Double distilled water was used in the preparation of all solutions in the experiments. Working standard solutions were prepared by appropriate dilution. Sulfanilic acid (0.5 g in 100ml water) and methyl anthranilate (0.5 ml in 100 ml of alcohol) were used. The following reagents were prepared by dissolving appropriate amounts in water 2 M of HCl and 2 M NaOH [8].
Nitrate stock solution (1000 µg/l) was prepared by dissolving
0.7220 g potassium nitrate in water and diluting to 100 ml. The
100 ml of 10 mg/l (ppm) stock nitrate solution was diluted using serial dilution of E-pure water from the standard 1000 mg/l
IJSER © 2013 http://www.ijser.org
International Journal of Scientific & Engineering Research, Volume 4, Issue 8, August-2013 1867
ISSN 2229-5518
nitrate solution provided. Store this solution in a labeled plastic bottle [17]. Using 10 mg/l stock of the nitrate solution, prepared volumetrically, five 100 ml standard solutions of concentrations
0, 4, 8.12, 16 and 20 mg/l were prepared. After preparation the plastic bottles labeled and stored in a refrigerator. The absorbances of the standard solutions were measured and used to prepare the calibration curve. The points on the calibration curve yielded a straight line as shown in section 2.5.
Nitrate was analyzed using, a SHIMADZU (Model No. UV-
2550) UV-Visible spectrophotometer with 1 cm matching quartz cell was used for the measurements of the absorbance.
To get the following readings a standard calibration curve for
nitrates had to be constructed using the standards in table
2.4.1.
The homemade brew sample bottles (acid-washed, 125 ml polythene bottle) were rinsed 3 times before sampling. Filled to approximately 2/3 full, tighten cap and freeze cruise, cast Niskin bottle number were recorded on the bottle and data sheet. All the brew sample bottles were first rinsed with the alcohol before the brew samples were collected. The samples were then filtered, the residue discarded and the filtrates from homemade brews were decolorized using activated charcoal and re-filtered until the colour disappeared.
In the sample pretreatment, modified procedures for washing and drying proposed by Santos et al. [11] and Kawashima & Soares [12], respectively, were used. First, each raw material
samples were rinsed with distilled water to remove dirt and
other debris. Then the maize, millet, sorghum and jaggery samples were grated with a polypropylene grater into porcelain containers. The containers with the raw material samples were dried in a laboratory oven at 65 ± 5 ºC for 24 h or until reaching constant weight. Immediately afterwards, the samples were stocked in polypropylene beakers and covered with a PVC film. Finally, they were stored in a desiccators awaiting digestion.
About 10 g (with precision of 0.01 g) of the raw material was weighed and placed into a 200 ml conical flask and 100 ml of hot distilled water (about 65oC) added. The flask was heated
for 10 minutes on a water bath, with frequent mixing.
Thereafter it was transferred into a 200 ml measuring flask, cooled and diluted using distilled water to the mark. The resulting mixture was filtered and the filtrate solution was used in the determination of nitrate levels.
No digestion is performed on unfiltered samples prior to analytical determinations. Portions of 20 ml of the neutralized filtered brew samples were evaporated to dryness in separate beakers. The residues were each cooled and extracted with 1 ml phenol disulphonic acid {prepared from 25 g of phenol crystals (BDH Chemicals Ltd, Poole, UK), 150 ml of concentrated H2 SO4 (Fischer Chemicals, UK), 75ml of fuming H2 SO4 (Fischer Chemicals, UK)} and each mixture heated for
2 hours on water bath. All samples (homemade brews, water,
raw materials) and blanks (n=3) were digested and diluted using the same procedure. The samples were decolorized as per section 2.4.
IJSER © 2013 http://www.ijser.org
International Journal of Scientific & Engineering Research, Volume 4, Issue 8, August-2013 1868
ISSN 2229-5518
Samples were analyzed using UV-Visible spectroscopy. The maximum holding time for NO3 -N was 48 hours. The concentration of the nutrients in solution was determined by measuring the absorbance. Nitrate was analyzed at 493 nm against reference samples, then applying the Beer-Lambert law the concentrations of the nitrates were obtained.
This was done according to specification in the Eurasian
Journal of Analytical Chemistry 4(2): 204-214, 2009, Pgs 204-
214 [13].
The calibration curve using experimental data is shown in
figure 2.4.1. Approximate concentrations of nitrate were evaluated from the calibration curve and the precise value from the linear regression. The results were then also recalculated to 100 g of plant material in order to take into account of the volume of the sample used.
P-values, F–tests and ANOVA were used in data analysis.
In this study the standard calibration curve for nitrate was considered; research apparatus and standard analytical reagents as recommended by Association of Official Analytical Chemists (AOAC) were used. Standard solutions prepared using the standard methods, standard analytical methods applied, significant values considered using the (ANOVA test, t-test and p-values) and international MCL standards were also considered.
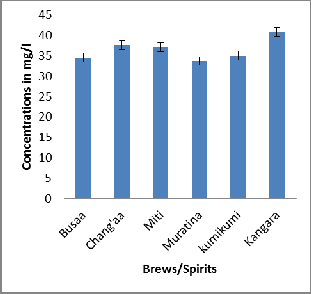
The levels of nitrate-N in home - made brews/spirits and tap water was determined using UV-visible spectroscopy and the result obtained for various stations are presented in Table
3.2.2 and Figure 3.2.2 below.
The average levels of nitrates were generally high in homemade brews/spirits. The highest levels of nitrate were obtained in Muratina from Gikomba which had the concentration of 46.50 ± 5.42 mg/l. The lowest nitrate levels were obtained in Muratina from Githurai with a concentration of
13.10 ± 1.06 mg/l. Busaa from Kibera, Kariobangi, Kawangware, Gikomba, Githurai, Uthiru, Mathare and Kangemi had high levels of nitrate ranging from 32.70 ± 0.46 mg/l from Githurai to 44.10 ± 0.87 mg/l from Mathare. Some of these homemade brews were not immediately available, this is because they were considered as illegal at the time of the research. The nitrate levels in the brews/spirits were generally lower than the recommended levels of 50 mg/l for water [7]. Kenya Bureau of Standards does not have standards for nitrates in alcoholic beverages. Kangara had the highest mean concentration of NO3 -N at 40.90 ± 1.05 mg/l, followed by Busaa at 39.54 ±3.26 mg/l, Chang’aa had 37.58 ± 3.84 mg/l and Muratina registered the lowest mean on 33.71 ± 11.81 mg/l. All the homemade brews indicated concentrations slightly below the maximum allowable limit set by Kenya Bureau of Standards of 50 mg/l [7].
As shown in the table 3.2.2.1 the probability of the between- treatments MS being ≥ 0.783 times the within-treatments MS, if the null hypothesis is true, is p = 0.570. The mean was
36.8343, the median 38.3 and the SD was 6.447. We can therefore conclude that there were no statistically significant differences between the concentrations of nitrates in the brews
IJSER © 2013 http://www.ijser.org
International Journal of Scientific & Engineering Research, Volume 4, Issue 8, August-2013 1869
ISSN 2229-5518
means as determined by one-way ANOVA (F = 0.783, p =
0.570).
281.30 ± 10.44 mg/kg, while Maize had the lowest values at
215.50 ± 33.00 mg/kg. The levels of nitrate in all materials were found to be below the maximum allowable limits of 500 mg/kg of nitrate set by the World Health Organization [14]. Differences in species, strain and agrotechnical operations as well as environmental pollution could account for the differences in nitrate levels in the raw materials used. Hence the raw materials could have played a role in elevating the levels of this nutrient in the homemade brew. The high concentrations of nitrates in the raw materials can be attributed to the use of fertilizers, environmental pollution and to some extent, during fermentation raw materials breaks down into amino acids and are eventually converted to nitrates. Raw materials may not have been from the same region, where the brews were being made. They were bought in market places within the sampling areas. It is good to note that for Nairobi County most of its agricultural feeds come from upcountry.
As shown in table 3.2.4.1, the mean was 276.233, the median
2.76.85 and the SD was 37.104. A P-value of 0.000 is less than the significance level (0.01) and F (14.535) is greater than F critical (14.47103), hence the concentrations of the raw materials used did not affect significantly the concentrations of nitrate.
The nitrate-N levels were generally low in the homemade brews/spirits and were found to be below the maximum contamination levels of 50 mg/l set by the WHO [7]. On the other hand the raw materials had high levels though slightly lower than the WHO standard of 500 mg/kg [14]. This means that the source of contamination for the brews/spirits must have been the use of contaminated water or the addition of additives during the brewing process. Current epidemiological data provide conflicting evidence regarding the potential long- term health risks of nitrate levels encountered in the diet, it is widely accepted that the reduction of dietary nitrate is a desirable preventive measure. The maximum allowable nitrate levels in foods should not exceed levels that reflect good agricultural practices [20].
IJSER © 2013 http://www.ijser.org
International Journal of Scientific & Engineering Research, Volume 4, Issue 8, August-2013 1870
ISSN 2229-5518
A calibration curve for nitrates was constructed using the on table
2.4.1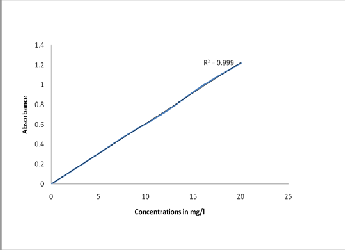

BREW PLACE | KUMI KUMI [n = 3] | KANGA RA [n = 3] |
KIBERA | 35.00 ± 1.27 | NA |
KARIOBA NGI | NA | NA |
KAWANG WARE | NA | NA |
GIKOMBA | NA | NA |
GITHURAI | NA | NA |
UTHIRU | NA | NA |
KANGEMI | NA | NA |
MATHARE | NA | NA |
KIAMBU | NA | NA |
KILIMANI | NA | NA |
BARICHO | NA | NA |
RUNDA | NA | 40.9 ± 1.06 |
MEAN | 35.00 ± 0.1 | 40.90 ± 1.06 |

IJSER © 2013 http://www.ijser.org
International Journal of Scientific & Engineering Research, Volume 4, Issue 8, August-2013 1871
ISSN 2229-5518
Parameter Value
Mean 36.8343
SD 6.4477
SEM 1.0899
N 35
90% CI 34.9914 to 38.6771
95% CI 34.6194 to 39.0491
99% CI 33.8607 to 39.8078
Minimum 13.1
Median 38.3
Maximum 46.5
SS | df | MS | F | p | |
Between | 160.686 | 5 | 32.137 | 0.783 | 0.570 |
Within | 1,231.85 | 30 | 41.062 | ||
Total | 1,392.54 | 35 |
The mean levels of nitrate in raw materials used in the homemade brews are represented in the Figure 3.2.4 below.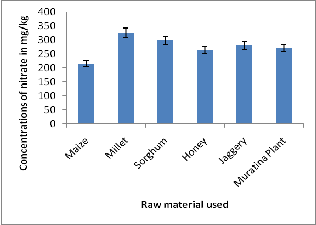
SS | df | MS | F | p | |
Between | 20,650.5 40 | 5 | 4,130. 108 | 14.53 5 | 0.000 |
Within | 3,409.82 9 | 12 | 284.15 2 | ||
Total | 24,060.3 69 | 17 |
Parameter Value
Mean 276.233
SD 37.104
SEM 15.148
N 6
90% CI 245.710 to 306.757
95% CI 237.295 to 315.172
99% CI 215.156 to 337.311
Minimum 215.5
Median 276.85
Maximum 326.2
The author wishes to express his sincere gratitude to the Chief chemist, Government chemist and the chief engineer Maina, Ministry of Public Works, and Materials branch for support during the entire research period when there was inadequate funding. The good co-operation of the deputy government chemist, Mrs. Okado and the Head of Departments in both foods and water and government chemist staff is highly acknowledged. Special thanks go to Professor Jane Murungi and Dr. Charles Onindo of Kenyatta University for their supervision of the thesis that resulted in the presentation of the data obtained, your hard work and your patience. I greatly
appreciate the typing assistance of my loving wife Mrs. Rosalia
IJSER © 2013 http://www.ijser.org
International Journal of Scientific & Engineering Research, Volume 4, Issue 8, August-2013 1872
ISSN 2229-5518
Masime. Lastly, I thank the Teachers Service Commission for granting me study leave with pay, my lecturers, Dr. Ruth Wanjau, Professor Gerald Muthakia, Dean (SPAS), Dr. Richard Musau, (Chairman, Chemistry Department), Prof.Hudson Nyambaka and Dr. Koga (Academic registrar) all of Kenyatta University, for their support.
[1]. WHO., Technology for Water Supply and Sanitation In
Developing Countries, WHO, 1st Edition, 1987, 23.
[2]. Chitlange, S., Introduction to Validation of Analytical
Methods, Anonymous, 2007, 1-7
[3]. USEPA., Fresh Water” Global Environmental Outlook
UNEP, Chapter 2, 2000a , 1 - 2.
[4]. Garness, J., Water Quality, Garness Engineering Group
Limited, USA, 2007,1 - 2.
[5]. Elytingon, A., Scientific Review of Soviet Literature on Toxicity and Hazards of Chemicals, Centre of International Projects USSR State Committee for Science and Technology, AUNEP Moscow, 1st Edition, 1983, 27.
[6] SOS., Nitrate Concentrations in Saskatchwen Rural Drinking Water, Saskatchwen Health Provincial Laboratory, North America, Regina, 2005, 1 & 2.
[7] Tom T., Nitrate Concentrations in Saskatchwen Rural Drinking Water, Saskatchwen Health Provincial Laboratory, North America, Regina, 2000, 1 & 2.
[8] UNEP., Our Planet, Vol 14 No. 4 UNEP, Nairobi, 2004, 16
& 32.
[9]. KEBS., Drinking Water – specification, Kenya standard, KS
459-1: 2007b, Third Edition, 1-7
[10] Experiment 6b., Determination of NItrate by UV – VIS Spectrophotometry and Ion Chromatography, http://pages.towson.edu/larkin/210DOCS/exp6b.pdf; 2013
Department, College of Medicine, University of Nigeria, Enugu
Campus, Nigeria, 2006, 1- 8
[15]. Thoedore, B., Interpreting Drinking Water Quality
Analysis: What Do The Numbers Mean? New Brunsweick,
[16]. TEACH Chemical Summary, Nitrates and Nitrites,
U.S. EPA, Toxicity and Exposure Assessment for Children’s
Health, http://www.epa.gov/teach/, 2006, 1 – 14
[17]. WHO, Guidelines for Drinking Water Quality. 3rd Ed, Vol.
1, Recommendations. Geneva:World Health Organization
[18]. EPH, Drinking-Water Nitrate and Health—Recent Findings and Research Needs, http://www.ncbi.nlm.nih.gov/pmc/articles/PMC1310926/, Environ Health Perspect. 2005 November; 2005, 113(11):
1607–1614
[19]. Pietro Santamaria, Nitrate in vegetables: toxicity, content, intake and EC regulation, Journal of the Science of Food and Agriculture, J Sci Food Agric 2006:10–17
[20]. Health Canada, Nitrite/Nitrate, http://www.hc- sc.gc.ca/ewh-semt/pubs/water-eau/nitrate_nitrite/index- eng.php; 1987
[21]. IARC, Ingested Nitrate and Nitrite, http://monographs.iarc.fr/ENG/Monographs/vol94/mono94-
6.pdf, IARC Monographs Volume; 2012 94
[22]. Health Canada, Nitrite and Nitrate in Drinking Water, http://www.hc-sc.gc.ca/ewh-semt/consult/_2012/nitrite- nitrite/draft-ebauche-eng.php; 2013
[11]. Santos, E., Lauria, C. and Porto Da Sileria, L., Assessment of Daily intake of Trace Elements Due to Consumption of Food Stuff by Adults in Habitants of Rio De Janeiro City, Science Total Environment 327: 2004. 69-79.
[12]. Kawashima, M. and Soares, V., Mineral profile of Raw and Cooked Leafy Vegetables Consumed in Southern Brazil, J. Food Composition Analysis, 2003 16: 605-611.
[13]. Narayana, B. and Sunil, L., A spectrophotometric method for the Determination of Nitrite and Nitrate, Eurasian Journal of Analytical Chemistry 4(2): 2009, 204-214.
[14]. Ikechukwu E., Contents of Nitrate and Nitrite in Some Nigerian Food Grains and their Potential Ingestion in the Diet – A Short Report, Nutrition Unit, Medical Biochemistry
IJSER © 2013 http://www.ijser.org