INTERNATIONAL JOURNAL OF SCIENTIFIC & ENGINEERING RESEARCH, VOLUME 4, ISSUE 1Ř, EMBER-2013
ISSN 2229-5518
1896
Determination of Ground Water Potential in Mirpur AJ&K Pakistan; using Geoelectric Methods (vertical electrical sounding)
Abrar Niaz, Rustam Khan, Fahad Hameed, Aamir Asghar, Sohail Mustafa
Institute of Geology University of Azad Jammu & Kashmir Muzaffarabad Pakistan.
ABSTRACT— A resistivity survey was carried out in Mirpur AJ&K to study ground water potential such as depth, thickness, resistivity and sediments in which water can be obtained. The geo-electrical methods used in the survey are Vertical Electrical Sounding, with the aim of determining groundwater potential. Twenty seven Vertical Electrical Soundings were conducted using the Schlumberger configuration covering the entire area. Thus VES data were subjected to an iteration software (IPIwin2) which showed that the area is composed of top soil, clay, sandy clay and sand. The apparent resistivity, longitudinal conductance and aquifer thickness maps were also prepared. Favorable resistivity and thickness was found in areas with sand and sandy clay, along the traverse with resistivity ranging between 53Ωm to 143Ωm.
—————————— ——————————
KEYWORDS: Groundwater potential, Vertical Electrical Sounding (VES)
Groundwater is the largest available reservoir of fresh water. A majority of fresh water is locked away as
supply and irrigation in food production (Zekster and
Everett 2004). Naturally, 53% of all population relies on
IJSER
ice in the polar ice caps, continent ice sheets and glaciers beneath the ground. Water in the rivers and lakes accounts only for less than 1% of the world's fresh water reserves (Environmental Agency, United Kingdom). There must be space between the rock particles for groundwater to flow. The earth's material becomes denser with depth. Essentially, the weight of the rocks above condense the rocks below and squeeze out the pore water found in the deeper levels of the earth, that is why groundwater can only be found within a few kilometers of the earth's surface. Observations show that groundwater comes from the rain, snow, sheet and hail that soak into the ground and becomes groundwater responsible for the spring, wells and bore holes (Oseji et al., 2005).
Groundwater is water located beneath the ground surface in soil pore spaces and in the fractures of lithologic formations. A unit of rock or an unconsolidated deposit is called an aquifer when it can yield a usable quantity of water. The depth at which soil pore spaces or fractures and voids in rock become completely saturated with water is called water table. Groundwater is often withdrawing for agricultural, municipal and industrial use by constructing and operating extraction wells.
Groundwater is also widely used as a source for drinking
groundwater as source of drinking water (Stanley N.
and Davis, 1996) in rural areas generally the figure is higher.
Mirpur district of AJ&K is located in the North- East region of Pakistan with dense population. Its inhabitants are facing a continuous problem of gaining the ground water at different depths. Electrical resistivity method is the most commonly used technique for the evaluation of ground water potential. VES is a common Geoelectrical method to measure vertical alterations of electrical resistivity. The method has been recognized to be the most suitable for hydro geological survey of sedimentary basins (Kelly and Stanislav, 1993).
The electrical resistivity technique involves the measurement of the apparent resistivity of soils and rocks as a function of depth or position. During resistivity surveys, current is injected into the earth through a pair of current electrodes, and the potential difference is measured between a pair of potential electrode. The current and potential electrodes are generally arranged in a linear array. Common arrays include dipole- dipole array, pole-pole array, Schlumberger array and the Wennar array. The bulk average resistivity of all soils and rock influence the
current. It is calculated by dividing the measured the
IJSER © 2013
INTERNATIONAL JOURNAL OF SCIENTIFIC & ENGINEERING RESEARCH, VOLUME 4, ISSUE ŗŘǰȱ ȬŘŖŗřȱ
ISSN 2229-5518
1897
potential difference by the input current and
multiplying by a geometric factor specific to the array being used and electrode spacing. (Stanley N. and Davis, 1996).
In a resistivity sounding, the distance between the current electrodes and the potential electrodes is systematically increased, thereby yielding information on subsurface resistivity from successively greater depth. The variation of resistivity with the depth is modeled using inverse and forward modeling computer software. Geophysical investigation involves electrical resistivity to investigate the nature and status of subsurface water contamination. The VES method was chosen for this study because the instrument is simple, field logistics are easy and straight forward while the analysis of data is less tedious and economical (Ako and
Olorunfemi, 1989). It also has the capability to
of recent sediments underlie the area. The geological
entities in the area are Chinji, Nagri, Dhok Pathan and Soan Formations of the tertiary age. These formations consist of Himalayan molasse deposits which are sandstones, sediments of clay and unconsolidated sands. While the alluvial deposits consist of coarse clay, unsorted sand either gravels or pebble beds.
IJSER
distinguish between saturated and unsaturated layers.
The Schlumberger configuration has a greater penetration than the Wenner configuration. In resistivity method, Wenner configuration discriminates between resistivities of different geoelectric lateral layers, while the Schlumberger configuration is used for the depth sounding (Olowofela et al, 2005). Geoelectrical method is oftenly used in delineating the depth, thickness and boundary of an aquifer (Omosuyi et al, 2007, Asfahani, 2006, Ismail Mohaeden, 2005). It is also used in determination of groundwater potential (Oseji et al., 2005), exploration of geothermal reservoirs and estimation of hydraulic conductivity of aquifer (El- Qady, 2006).
The study area is located in State of AJ&K, Pakistan. The geological setting of the study area reveals that it lies within the Kashmir basin adjacent to the extensive Potowar basin. The basin extends almost through the entire province of Punjab. It is sedimentary basin whose thickness increases from north to south (down dip) and from east to west. The molasse deposits
area which is the source of the recharge of the aquifers in
the area. The study area lies at low altitude than the water reservoir and aquifers are continuously recharged by this water source.
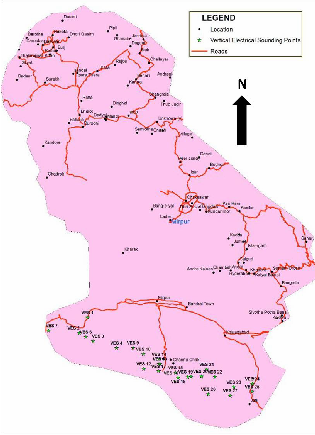
The instrument used in the research work is the ABEM terrameter SAS 4000 Sweden and its accessories. The accessories include hammers, stainless electrode, cables, and measuring tape. The electrical resistivity method was used for the investigation. In all a total of twenty seven VES station were surveyed in the study area. All these twenty seven stations are within the Mirpur District. By using Schlumberger configuration a total of 27 VES were carried out in the study. VES points are represented in the figure 1. Fifteen days field work arranged in the study area to collect the data using Schlumberger configuration upto maximum of 350m spacing. The current is applied to the ground using two electrodes and resulting potential is measured with the help of two potential electrodes. Spacing of the electrode is symmetrically increased, two electrodes at a time for subsurface coverage.
The acquired data is then subjected to the iteration software IPI win2 to delineate thickness true resistivity and depth of the subsurface layers.
IJSER © 2013
INTERNATIONAL JOURNAL OF SCIENTIFIC & ENGINEERING RESEARCH, VOLUME 4, ISSUE ŗŘǰȱ ȬŘŖŗřȱ
ISSN 2229-5518
1898
3.1 Data Interpretation
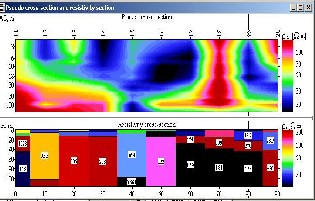
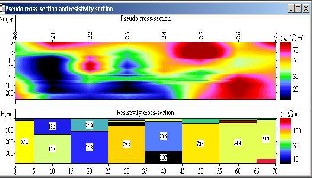
An iteration software (IPIWIN2) is used to iterate curves of VES 1-27. The smooth curves taken through the set of data points were interpreted quantitatively by the method of partial curve matching. Layer resistivity and thickness were gotten from VES1 to VES27. The typical electrical resistivity curve obtained from analysis of the data are shown in figure 2 while the true resistivity and thickness of the layers delineated in the study area are shown in the Table 1. Isoresistivity map at 60 m depth and 3D maps were prepared using GIS and surfer packages and they were interpreted and thicknesses of various subsurface layers. Based on VES interpretation results longitudinal conductance map and aquifer thickness map were prepared. Pseudosection of the profiles presented in the figure 3 shows the agreement with the geology of the area. The resistivity section shows that subsurface layers are divided into three distinct zones that are high medium and low resistivity zones as sown in the figure 3 (a, b, c). The interpretation of resistivity data indicates that there are three to four layers
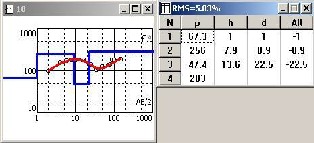
under study area figure 2.
The top layer shows diversity of resistivity values ranging from 14.5 ohm m to 220 0hm m and can be classified as loose soil. The thickness of the layer differ from one location to other ranging from 1m to 12.5m the resistivity of second layer ranges from 10 ohm m to 389 ohm m, interpreted as clayey sand to sandy clay. At the location of VES4, VES6, VES7, VES 25 the resistivity values are 1091ohm m 756 ohm m, 1034 and 641 ohm m respectively which are interpreted as compact sandstone. The third layer has resistivity ranges from 3.02 ohm m to
420 ohm m interpreted as fine sand coarse grains and gravels with thickness ranges from 5 m to 131 m. There is the evidence of the ground water accumulation in second and third layers. The thickness of aquifer ranges from
5.14 m to 260 m. The high values at VES 2 and VES 11 are
2388ohm m and 9069 ohm m show the compact sandstone in the area. The fourth layer resistivity ranges
between 2.5 ohm m to 123 ohm m typical sandy clay.
IJSER © 2013
INTERNATIONAL JOURNAL OF SCIENTIFIC & ENGINEERING RESEARCH, VOLUME 4, ISSUE ŗŘǰȱ ȬŘŖŗřȱ
ISSN 2229-5518
1899
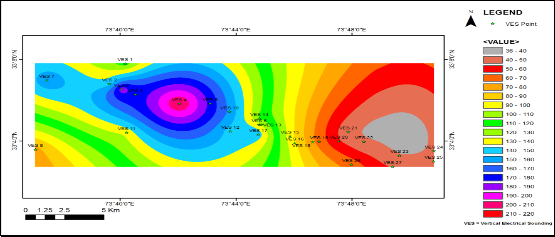
3.2 Apparent resistivity
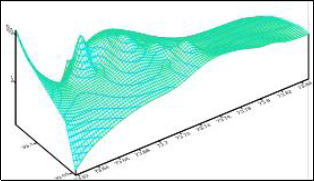
The apparent resistivity values at 60 m ranges from 11.641 to 412.69ohm m and corresponding contour map is given in figure 4a the highest apparent resistivity values are observed at the northeastern and central portion of map. Figure 4b shows few peaks representing the compact sandstone in northeastern and central portion of map.
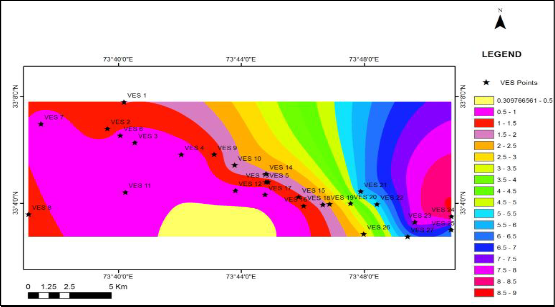
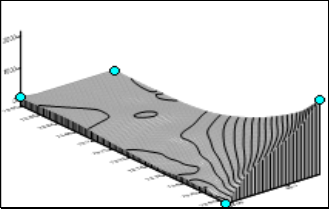
3.3 Longitudinal conductance
The ratio of different layers to their respective resistivities is known as longitudinal conductance. The properties of the conducting layers determined in terms of longitudinal conductance and resistive layer by transverse resistance (Yungul, 1996). Figure 5 depicts the total longitudinal conductance contour map.
The conductance values ranges from0.81 to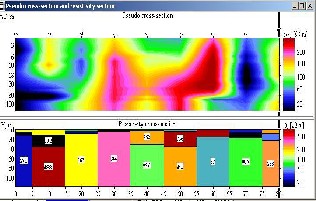
13.88 Siemen. Conductance values increases in the north western as well as south eastern portion of the map. As the conductance increases resistivity naturally decreases pointing towards the groundwater potential aquifers (Gowd 2004).
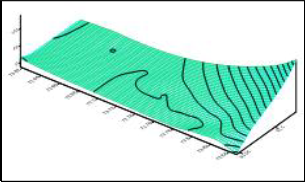
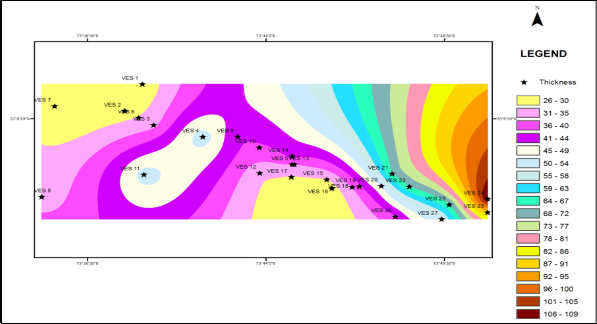
3.4 Aquifer unit (s) thickness map
The aquifer thickness map shown in the figure
6 can be used in ranking geology formation because volume of water from each VES station is the function of aquifer thickness.
The entire area can be classified as good to moderate ground water potential zone. The study reveals that productive water bearing categorized as good potential occurs at the south eastern portion of the study area with thickness values 82 to 109 m. The moderate ground water potential zone has a range of an aquifer thickness 20 to 82 m lies in the central and south western part of the study area.
IJSER © 2013
INTERNATIONAL JOURNAL OF SCIENTIFIC & ENGINEERING RESEARCH, VOLUME 4, ISSUE ŗŘǰȱ ȬŘŖŗřȱ
ISSN 2229-5518
1900
IJSER
IJSER © 2013
INTERNATIONAL JOURNAL OF SCIENTIFIC & ENGINEERING RESEARCH, VOLUME 4, ISSUE ŗŘǰȱ ȬŘŖŗřȱ
ISSN 2229-5518
1901
IJSER
IJSER © 2013
INTERNATIONAL JOURNAL OF SCIENTIFIC & ENGINEERING RESEARCH, VOLUME 4, ISSUE ŗŘǰȱ ȬŘŖŗřȱ
ISSN 2229-5518
1902
to be drilled in these two layers of different locations.
Boreholes for water scheme are recommended
The presence of thick aquiferious zone assures the area of adequate water resource. The study will also guide the borehole program of the state city and provide additional data base for ground water development and utilization in the study area.
Based on the interpretation of Geo-electrical data, ground water potential zone are delineated. The productive ground water zones are identified in the central eastern and south eastern part of the area. Analysis of the data indicate that the water bearing formation exist in second and third layers within the
area under study.
1. Ako A O; Olorunfemi M O (1989) Geoelectric survey for groundwater in the newer basalts of Vom Plateau satae.
2. El-Qady, G, 2006 Exploration of a geothermal reservoir using geoelectrical resisity injversion case study at Hammam Mousea, sinai, Egypt case study at hummam moouse siniai, egypt, J Geophys, Eng 3:114-
121.
3. Gowd SS (2004). Electrical resistivity survey to delineate the ground water potential aquifers in peddavanka watershed, anantapur district, Andhra Pradesh, India. J. envir. Geol., 46: 118- 131.
IJSER © 2013
INTERNATIONAL JOURNAL OF SCIENTIFIC & ENGINEERING RESEARCH, VOLUME 4, ISSUE ŗŘǰȱ ȬŘŖŗřȱ
ISSN 2229-5518
1903
4. Kelly W.E and M. Stanisly 1993 Applied geophysics
in hypgeological and engineering practice. Parctice. Elsevier, Amesterdam pp: 292
5. Olorunfemi. M.O and Meshida, E.A,(1987). Engineering geophysics and its application in engineering site investigation. The Nigerian Engineer,
22(2): 57-66.
6. Olowofela, J.A., V.O. Jolaosho and B.S Bandmus,
2005. Measuring the electircal resistivity of the earth using a fabricated resistivity meter. Eur. J. Phys., 26:
501-515.
7. Omosuyi, G.O., A Adeyemo and A. o Adegoke, 2007. Investigation of groundwater propect using geoelectric and electromagnetic sounding at afunbiowo near akure. Asouthwestern Nigeria Pacfic J Sci Technol, 8.172-182.
8. Oseji, J.O E.A Atakpo and Okolie 2005. Geoelectric investigation of the aquifer charateristics and groundwater potential in Kwale.
9. Stanley N. Davis (1996) Hydrogeology .p.280-286.
10. Yungul SH (1996) Electrical methods in geophysical exploration of sedimentary basin. Chapman and Hill, U.K.p.152.
11. Zekster is everentt LPG (Eds) Groundwater resources of the world and their use, IHP-VI, series on Groundwater no 6 UNESCO (united Niations
Educational, Scientific and Cultural Organization).
IJSER © 2013