International Journal of Scientific & Engineering Research, Volume 4, Issue 8, August-2013 1777
ISSN 2229-5518
Detection and Classification of Plant Leaf
Diseases using ANN
Mr. Hrishikesh P. Kanjalkar, Prof. S.S.Lokhande
Abstract-Plant diseases problem can cause significant reduction in both quality and quantity of agricultural products. Automatic detection of plant leaf diseases is an essential research topic as it may prove benefits in monitoring large fields of crops, and thus automatically detect the symptoms of diseases as soon as they appear on plant leaves. The proposed system is a software solution for automatic detection and computation of plant leaf diseases. The developed processing scheme consists of five main steps, first a color transformation structure for the input RGB image is created, then the noise i.e. unnecessary part is removed using specific threshold value, then the image is segmented with connected component labeling and the useful segments are extracted, finally the ANN classification is computed by giving different features i.e. size, color, proximity and average centroid distance. Experimental results on a database of 4 different diseases confirms the robustness of the proposed approach.
Keywords- ANN, Color, Plant Leaf Diseases, RGB
————————————————————
1. Introduction
The naked eye observation of experts is the main approach adopted in practice for detection and identification of plant diseases. But, this requires continuous monitoring of experts which might be prohibitively expensive in large farms. Further, in some developing countries, farmers may have to go long distances to contact experts, this makes consulting experts too expensive and time consuming and moreover farmers are unaware of non-native diseases.
Automatic detection of plant diseases in an important research topic as it may prove benefits in monitoring large fields of crops, and thus automatically detect the diseases from the symptoms that appear on the plant leaves. This enables machine vision that is to provide image based automatic inspection, process control and robot guidance. Comparatively, visual identification is labor intensive, less accurate.
When crops suffered disease, if the symptoms are not obvious or more complex, it will be very difficult to distinguish the characteristics so that delay the effective control of crop diseases seriously. We can analyze the
prevented and control comprehensive combined with the specific circumstances of crop. It has a great significance in automatic and intelligent management aspects of crop growth and health with the research of crop diseases using image feature extraction technology.
2. Proposed Approach
The quality inspection of leaves consists of two main aspects, internal and external examinations. The internal quality inspection is usually achieved by human sensory, smoking test or chemical analysis, while the external quality inspection is mainly achieved through human vision. It is costly and yet time-consuming to inspect internal quality since leaves contain too many ingredients to be handled. As an alternative, external quality examination is often used instead in the examination of internal quality of leaves, since external features are closely related to internal quality. The external quality inspection of leaves includes judgment of color, maturity, surface texture, size and shape. Human vision, which is inevitably limited by personal, physical and environmental factors, has been the predominant means of
image of disease leaves by using computer image
processing technology and extract the features of disease
spot according to color, texture and other characteristics from a quantitative point of view. The caused and extent of disease can be diagnosed timely and effective, it could be
————————————————
• Mr. Hrishikesh P. Kanjalkar, Department of E and TC, Sinhagad
College of Engineering, Pune, India, hrishi1130@gmail.com
• Prof. S.S.Lokhande, Department of E and TC, Sinhagad College of
Engineering, Pune, India, sslokhande.scoe@sinhagad.edu
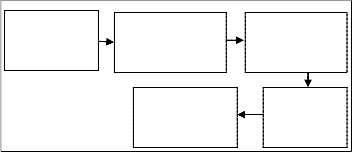
Image
Acquisition
Color
Transformation
Classification
Fig.1 Block diagram
Image
Segmentation
Feature
Extraction
IJSER © 2013 http://www.ijser.org
International Journal of Scientific & Engineering Research, Volume 4, Issue 8, August-2013 1778
ISSN 2229-5518
inspection. Therefore, proposed external quality inspection of leaves using image processing technology and the approach is explained with following steps.

θ = cos−1 � 1/2⟦(R−G)+(R−B)⟧
�⟦(R−G)2 +(R−B)(G−B)⟧
The saturation S is given by,
� (2)
2.1 Image Acquisition
Images of the infected leaves are taken from online

S = 1 − 3
(R+G+B)
[min(R, G, B)] (3)
IPM database. This database has different types of plant diseases; here only 4 types of diseases are taken. And the images are stored in JPEG format. Size of images in the database is 768×512. These images are then read in MATLAB using imread command.
2.2 Color Transformation Structure
First, the RGB images of leaves are converted into Hue Saturation Intensity (HSI) color space representation. The purpose of the color space is to facilitate the specification of colors in some standard, generally accepted way. HSI (hue, saturation, intensity) color model is a popular color model because it is based on human perception. Hue is a color attribute that refers to the dominant color as perceived by an observer. Saturation refers to the relative purity or the amount of white light added to hue and intensity refers to the amplitude of the light. Color spaces can be converted from one space to another easily. After the transformation process, the H component is taken into account for further analysis. S and I are dropped since it does not give extra information.
2.2.1 The HSI color model
The RGB and CMY color models are not suited for describing colors in terms of human interpretation. Color objects in images can be easily described by its hue, saturation, and brightness (intensity). Hence the HSI color model has been presented. The HSI model decouples the intensity component from the color-carrying information (hue and saturation) in a color image. As a result, this model is an ideal tool for developing color image processing algorithms. The hue, saturation, and intensity values can be obtained from the RGB color cube. That is, we can convert any RGB point to a corresponding point in the HSI color model by working out the geometrical formulas.
Converting colors from RGB to HSI The hue H is given by,
θ, if B ≤ G
360 − θ, if B > G (1)
Where,
The intensity I is given by,

I = 1 (R + G + B) (4)
3
All RGB values are normalized to the range [0, 1].
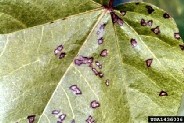
Fig.2 Original image (angular leaf spot of cotton)
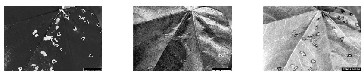
a b c
Fig.3 (a) Hue image (b) Saturation image (c) Intensity image
Above figures clearly shows that, the selection of H S I image will definitely give more accurate results. For segmentation and feature extraction more discriminative image will be useful, therefore Hue image from HIS image is selected which is more discriminative.
2.3 Image Segmentation
Image segmentation is the first step and also one of the most critical tasks of image analysis. It is used either to distinguish objects from their background or to partition an image onto the related regions. Although it is one of the primary steps in object recognition, it is also considered to be one of the most popular problems in computer vision. There are different techniques that would help solve the image segmentation problem. The aim of the segmentation process consists of dividing the input image into several disjoint regions with similar characteristics such as color and texture. Robust image segmentation is a difficult task since often the scene objects are defined by image regions with non-homogenous texture and color characteristics and in order to divide the input image into semantically
IJSER © 2013 http://www.ijser.org
International Journal of Scientific & Engineering Research, Volume 4, Issue 8, August-2013 1779
ISSN 2229-5518
meaningful regions many developed algorithms either use a priori knowledge in regard to the scene objects or employ
the parameter estimation for local texture.
At first, all the connected components are extracted from original diseased image which are diseased parts of leaves. Connected component labeling is an algorithmic application of graph theory, where subsets of connected components are uniquely labeled based on a given test. It actually collects all same or near valued pixels, in our case these regions are diseased parts of the leaves.
In the connected component labeling sometimes it labels the unwanted regions, therefore to remove these unwanted areas we use thresholding operation. Here we are removing all connected components (objects) that have fewer than 30 pixels from a binary image, producing another binary image.
2.4 Image Feature Extraction
Feature extraction involves simplifying the amount of resources required to describe a large set of data accurately. When performing analysis of complex data one of the major problems stems from the number of variables involved. Analysis with a large number of variables generally requires a large amount of memory and computation power or a classification algorithm which overfits the training sample and generalizes poorly to new samples. Feature extraction is a general term for methods of constructing combinations of the variables to get around these problems while still describing the data with sufficient accuracy.
The features selected here are considered according to the leaf diseases which will be more discriminative. In proposed approach total 11 features are taken, i.e. 8 color features and size of disease (size of diseased spot), distances of diseased spots from each other and the proximity.
2.5 Classification
The word ‘Neural Network’ has been motivated from its inception by the recognition that the human brain computes in an entirely different way from the conventional digital computer. The brain is a highly complex, non-linear and parallel computer (information processing system). An artificial neural network (ANN), often just called a "neural network" (NN), is a mathematical model or computational model based on biological neural network. It consists of an interconnected group of artificial network and processes information using a connectionist approach to computation. In most cases an ANN is an
adaptive system that changes its structure based on external or internal information that flows through the
network during the learning phase.
Back Propagation Neural Network (BPNN) is a systematic method for training multi-layer artificial neural network. It is a multi-layer forward network using extend gradient descent based delta-learning rule known as back propagation (of errors) rule. Back propagation provides a computationally efficient method for changing the weights in a feed-forward network, with differentiable activation function units, to learn a training set of input output being a gradient descent method it minimizes the total squared error of the output computed by the network. The network is trained by supervised learning method.
The basic structure of the BPNN includes one input layer, at least one hidden layer (single layer / multiple layers), followed by output layer. Neural network works by adjusting the weight values during training in order to reduce the error between the actual and desire output pattern. The aim of this network is to train the net to achieve a balance between the ability to respond correctly to the input patterns that are used for training and the ability to provide good responses to the input that are similar. The number of the node in the hidden layer is set by trail and error during training. The number of node in the output layer is equal to the number of the subjects in the database.
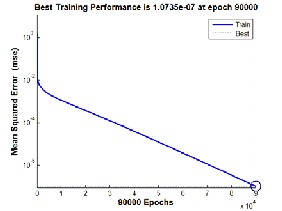
Fig.4 Training performance plot
As we are giving 11 features to neural, its performance will be more accurate. The performance plot shows it very well. For the training here we have used 50 hidden layers neurons and 90000 epoch which gives better results. And to every disease a specific value is given which is the output of neural. Therefore, 11 inputs are given to neural and 1 desired output is given. Now when a new diseased image is given to system it extracts 11 features and
IJSER © 2013 http://www.ijser.org
International Journal of Scientific & Engineering Research, Volume 4, Issue 8, August-2013 1780
ISSN 2229-5518
then neural matches it with trained images and gives exact disease.
3. Experimental Works and Results
Experiment is performed on diseased leaves. Diseases on two different plants i.e. Cotton and Soybean are selected for experiment, among which 3 diseases are of Soybean plant and 1 is of Cotton plant. As neural network is used for classification, training of database must be done. Therefore, 10 images of each disease have taken for training and 5 images for testing.
The testing accuracy of cotton disease i.e. angular leaf spot is 83%, which is tested on trained database of 10 images. And similarly tested for Soybean diseases, Bacterial pustule gives 80%, Bacterial gummosis gives 80% and Bacterial blight gives accuracy of 70%. These results are summarized in table 1.
Table 1 Results
Plant | Disease | Accuracy |
Cotton | Angular leaf spot | 83% |
Soybeans | Bacterial pustule | 80% |
Soybeans | Bacterial gummosis | 80% |
Soybeans | Bacterial blight | 70% |
4. Conclusion
The proposed methodology uses leaf features for disease detection where feature extraction is done on segmented diseased area. Hue image from HSI gives clear discrimination of diseased spots, and which is more helpful for extracting size, color, proximity and centroids. These features served as inputs to neural network for the classification of 4 different leaf diseases which shows accurate classification.
References
1] Dheeb Al Bashish, Malik Braik, and Sulieman Bani- Ahmad, “A Framework for Detection and Classification of Plant Leaf and Stem Diseases,” Department of Information Technology, IEEE International Conference on Signal and Image Processing, 2010.
2] Santanu Phadik ar and Jaya Sil, “Rice Disease
Identification using Pattern Recognition Techniques,” 11th
International Conference on Computer and Information
Technology (ICCIT 2008),IEEE Proceedings, 2008.
3] S. Ananthi, S. Vishnu Varthini, “Detection and classification of plant leaf diseases,” International Journal of Research in Engineering & Applied Sciences, Volume 2, Issue 2 (February 2012), ISSN: 2249-3905, 2012.
4] Jiazhi Pan, Yong He, “Recognition of plants by leaves digital image and neural network,” International Conference on Computer Science and Software Engineering,IEEE Computer Society, 2008.
5] Xinhong Zhang, Fan Zhang, “Images Features Extraction of Tobacco Leaves,” Congress on Image and Signal Processing, IEEE Computer Society, 2008.
6] A. Meunkaewjinda, P. Kumsawat, K. Attakitmongcol and A. Srikaew,“Grape leaf disease detection from color imagery using hybrid intelligent system,” IEEE Proceedings of ECTI-CON, 2008.
7] Zulkifli Bin Husin, Abdul Hallis Bin Abdul Aziz, Ali Yeon Bin Md Shakaff, Rohani Binti S Mohamed Farook, “Feasibility Study on Plant Chili Disease Detection Using Image Processing Techniques,” Third International Conference on Intelligent Systems Modelling and Simulation, IEEE Computer Society, 2012.
8] Panagiotis Tzionas, Dimitris Manolakis, Stelios E. Papadakis “Plant leaves classification based on morphological features and a fuzzy surface selection technique.”
IJSER © 2013 http://www.ijser.org