Fig.1: System of counting of different types of categories.
International Journal of Scientific & Engineering Research, Volume 4, Issue 4, April-2013
ISSN 2229-5518
Design and Implementation of a Vehicle
Monitroring System for Toll Collcection
*Nursadul Mamun, Nahidul Hoque Samrat, Choton Kanti Das, Sagor Ghosh, Suvro Mallick
Abstract— Vehicle monitoring system for toll collection is a globally accepted system. Initial investment is necessary for the construction and maintenance of the roads and bridges and the initial investment will be paid back over time by user tolls. Fees and tolls may be varied by vehicle type, length or weight of vehicle. Fees or tolls were traditionally collected by hand, by toll gate workers. To cut cost and minimize time delay, many tolls today are collected with some forms of automatic or electronic toll collecting system. In Bangladesh, manual method of toll collection is mostly used. A person collects the tolls according to the list, where how much have to be paid from each category remains enlisted. This is time consuming. Again, in Bangladesh some systems are such that, tolls are charged automatically on the basis of weight of the vehicle, but this system is costly. So, here a system of automatic toll collection on the basis of length of vehicle is designed to reduce manual existence and cost.
Index Terms: Vehicle monitoring, Category, Toll, Road, Micro-controller, LASER, Transmitter.
—————————— ——————————
1269
URING the last 100 years, most highways have been built, owned, and maintained by governments. However, construction costs for new roads, plus maintenance and enhancements to existing road networks, impose substantial public sector budgetary pressures. Those costs can frequently exceed tax revenue capacity. As a result, governments have been forced to look for alternative funding. One mechanism governments have periodically considered as a means for fi- nancing the costs of construction and maintenance of new roads is tolls. [1]. Tolls are a form of user tax that usually pays for the cost of road or bridge construction and maintenance
without raising taxes on non-users [2].
Most countries have no toll roads. Where there are toll roads
the tolled network typically comprises less than 5 percent of
the road network. In most countries with toll roads the private
sector has been heavily involved in development of the roads
and often thereafter in their operation. The USA, Japan, and
France are the key exceptions to this rule, where most toll roads are owned and operated by public corporations.[3]. In
Bangladesh, roads and bridges are built by the Government. After building the roads and bridge, the government invites tender to give an Operation and management (O&M) contract against a fee. The O&M operators maintain the bridge and collects toll on behalf of the government.
There are three methods of toll collection available [4]. These
are manual, automatic and electronic toll collection system.
————————————————
Nahidul Hoque Samrat .Now he is working as RA in CPDM, University Of
Malaya, Malaysia. E-mail: sam_3e60@yahoo.com
Sagor Ghosh completed B.Sc. in EEE from Chittagong University Of Engi-
neering Technology, Bangladesh. E-mail: ghss.sagor@gmail.com
Suvro Mallick completed B.Sc. in EEE from Chittagong University Of Engineer-
ing Technology, Bangladesh. E-mail: suvromallick2093@gmail.com
Manual toll collection is most widely used collection meth- od. It requires a toll collector or attendant. Based on the vehi- cle classification, cash toll is received by the collector. Due to manual intervention, the processing time is highest.
Automatic toll collection is based on the use of Automated Coin Machine (ACM). These accept both coins and tokens is- sued by the operating agency. Depending on the toll rate, the use of automated coin or token collection instead of manual collection reduces transaction and processing time as well as the operating cost.
Electronic Toll Collection (ETC) is a system that automati- cally identifies a vehicle equipped with a valid encoded data tag or transponder as it moves through a toll lane or check- point. This system is capable of determining if the car is regis- tered or not, and then informing the authorities of toll pay- ment violations, debits, and participating accounts [5].
An ETC system commonly utilizes radio frequency identifi- cation (RFID) technology. RFID is a generic term used to iden- tify technologies utilizing radio waves to automatically identi- fy people or objects [6]. RFID technology was first introduced in 1948 [7]. Research on ETC has been around since 1992, dur- ing which RFID tags began to be widely used in vehicles to automate toll processes [8].
A complete RFID system consists of a transponder (tag), reader writer, antenna, and computer host. The transponder, better known as the tag, is a microchip combined with an an- tenna system in a compact package. The microchip contains memory and logic circuits to receive and send data back to the reader [9].
The ETC system is currently being used throughout the world. In the United States alone, various states have imple- mented an ETC system called E-Z Pass. Other countries that have applied the ETC system are Canada, Poland, the Philip- pines, Japan and Singapore, among many others.[10]
IJSER © 2013
International Journal of Scientific & Engineering Research Volume 4, Issue 4, March -2013
ISSN 2229-5518
1270
In Bangladesh, most of the toll plazas are manual. Vehicles enter the plaza and toll is charged and collected by a person. There are some automatic toll plazas also in which toll is charged automatically on the basis of the weight of the vehi- cle, and a person collects the toll [11]. In this project, a vehicle monitoring system which will calculate toll based on the length of vehicle has been designed to reduce manual assis- tance in the toll plazas of Bangladesh.
The basics of the project is that, here LASER (Light Amplifica- tion by Stimulated Emission of Radiation) light is placed in one side of the road and LDR (Light dependent resistor) along with other circuit components is placed on the other side of the road. There are five sets of such arrangements on both sides of the road. LASER light is adjusted such that it directly falls on LDR when there is no vehicle between LASER and LDR.As a result LDR has low resistance and positive input voltage of OP-AMP (OP-AMP 741) is higher than negative input voltage according to voltage divider rule (Voltage divi- sion refers to the partitioning of a voltage among the compo- nents of the divider.[12] ).The output of OP-AMP is fed to base of the transistor (C828) and the transistor is on. The output current discharge to ground and we do not get any output voltage.
When there is vehicle between LASER and LDR there is no light on LDR. So resistance of LDR is increased .Now positive input voltage is lower than negative input voltage according to voltage divider rule and there is no output voltage of OP- AMP. In this condition the transistor remains off and micro- controller gets a voltage. Similar condition is applicable to get output voltage from all the five arrangements.
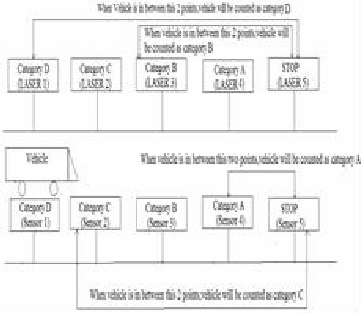
Now voltages from five arrangement is fed to the microcon- troller (PIC16F628A).When microcontroller gets the voltage from 1st set of LASER and LDR (It happens when the vehicles enters between 1st set of LASER and LDR), microcontroller sense the presence of vehicle. Microcontroller will then check for voltages from 2nd, 3rd, 4th and 5th set of LASER and LDR. When it gets voltages from 5th set of LASER and LDR, it will check which another voltage from 2nd, 3rd, 4th and 5th set of LASER and LDR is present at that moment. Depending on it, microcontroller will decide which category of vehicle it is (the category is programmed before inside the microcontroller) and how much have to be charged from the vehicle. Microcon- troller will also count how many vehicles under each category have passed through the toll plaza. The charge for different category is given in Table I. The system of counting different types of categories is shown in Fig.1.
Table: 1
The toll of different categories of vehicles
Category | Charge(Taka) |
A | 10 |
B | 25 |
C | 50 |
D | 100 |
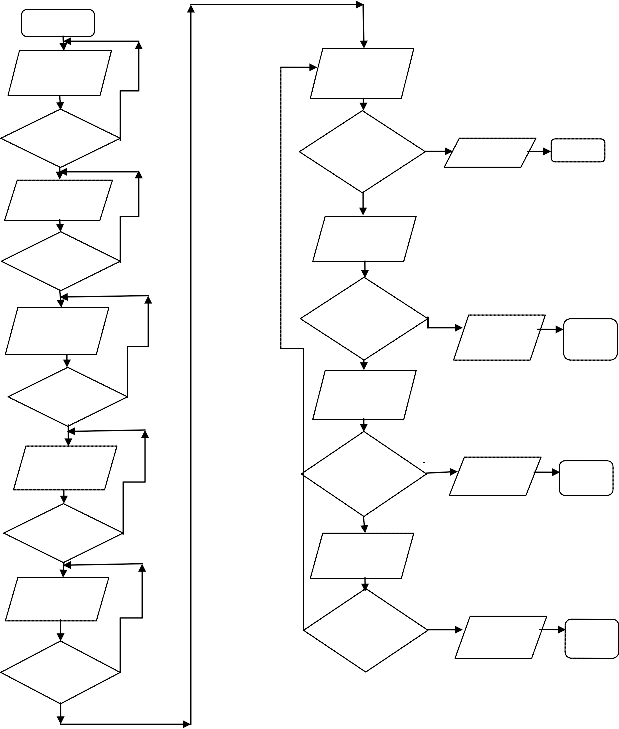
Fig.1: System of counting of different types of categories.
In the complete block diagram (Fig.2), there are five sets of transmitter and receiver. When the vehicle enters, the vehicle monitoring system, at first it cuts the LASER between trans- mitter 1 and receiver 1, micro-controller gets a voltage and step 1 is shown in the display. In the similar way, it cuts the LASER between second set of transmitter and receiver, third set of transmitter and receiver, fourth set of transmitter and receiver and step 2, step 3 and step 4 are shown in the display respectively. At last, when it cuts the LASER between trans- mitter 5 and receiver 5, depending on the position of the back wheel of vehicle, it shows vehicle type and toll. For example,
A. Block Diagram:
The whole system can be represented by a block diagram which is displayed in Fig.2
IJSER © 2013
International Journal of Scientific & Engineering Research Volume 4, Issue 4, March -2013
ISSN 2229-5518
1271
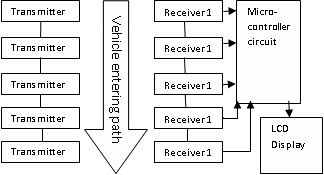
Fig.2: Complete block diagram of vehicle monitoring sys- tem for toll collection.
when the front wheel of a vehicle is in between transmitter
5 and receiver 5, then if the back wheel of the vehicle is in be-
tween transmitter 3 and receiver 3, it shows category B and
toll 25 taka.
B. Transmitter and Sensor Circuit:
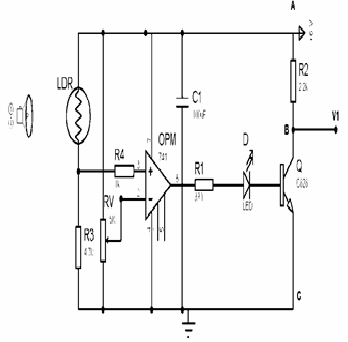
Fig.3: Transmitter and sensor Circuit
In sensor circuit, 4.7 kΩ, 2 kΩ, 330Ω and 2.2 kΩ resistors are used. The value of variable resistor used is 5kΩ. The capacitor of 100 uF is used. Here Op-Amp 741 is used as comparator. A LED is used as an indicator of output voltage of the Op-Amp. The model of transistor in the sensor circuit is C828. Here LDR is used to sense the presence of LASER.
C. Calculation from transmitter and sensor circuit:
When there is no vehicle between LASER and LDR, LASER light directly falls on LDR and the resistance of LDR is approx- imately 300Ω.So, the positive input of Op-Amp = 5.64 Volt
The negative input of Op-Amp is set to 3.5 volt with the help of variable resistor.As the Op-Amp here is working as com- parator and positive input is higher than negative input, the output voltage is approximately 5.4 volt. Approximately 3.3 volt drops across the resistor R1 (330Ω), and a current 10 mA flows to the base of the transistor, which turns-on the transis- tor. So the output current discharges through A, B, C to ground and we do not get any output voltage.When there is vehicle between LASER and LDR, the LASER light doesn’t fall on LDR and this time the resistance of the LDR is approxi- mately 7.3 KΩ.So, the positive input of Op-Amp = 2.35 Volt And the negative input remains fixed to 3.5 volt.As the Op- Amp here is used as comparator and the positive input is low- er than negative input, the output of Op-Amp is approximate- ly zero. So no current flows to the base of the transistor and the transistor remains OFF. At this moment we get a output voltage from the sensor circuit, which is the input of micro- controller.
D. Microcontroller and LCD Pin Connection
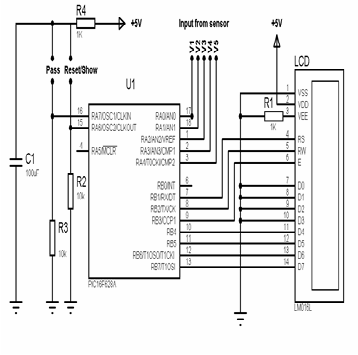
Fig.4: Microcontroller and LCD Pin Connection Diagram.
The micro-controller used in this system is PIC 16F628A. Input from sensor circuit is fed to the 17, 18, 1, 2, 3 pin of the micro- controller. PASS switch is connected to the pin no 16 of the micro-controller and RESET/SHOW is connected to the pin no
15 of the micro-controller. The LCD display used is a 2X16 line display. RS, RW and E pin is connected to the pin number of 7,
IJSER © 2013
International Journal of Scientific & Engineering Research Volume 4, Issue 4, March -2013
ISSN 2229-5518
1272
8, and 9 of the micro-controller serially. In LCD pin, D0, D1, D2, D3, VSS, VEE are connected to the ground. Pin D4, D5, D6 and D7
of the LCD display are serially connected with the pin no 10,
11, 12 and 13 of the microcontroller respectively.
E. Microcontroller and LCD Pin Connection
Start
READ Step 1
READ Step 4
NO
IS Step1=1?
YES
IS Step5=1?
YES
PRINTF
END
READ
NO
READ Step 3
IS Step2=1?
YES
READ Step 3
IS Step5=1?
YES
PRINTF
END
NO
IS Step3=1?
READ Step 2
YES
YES
READ Step 4
NO
IS Step5=1?
PRINTF
END
IS Step4=1?
YES
READ Step 1
READ Step 5
NO
NO YES
IS Step5=1?
PRINTF
END
IS Step5=1?
YES![]()
IJSER © 2013
International Journal of Scientific & Engineering Research Volume 4, Issue 4, March -2013
ISSN 2229-5518
To accomplish this system transistor C828 is used. LASER is used here as transmitter. The terms LASER originated as an acronym for Light Amplification by Stimulated Emission of Light [13]. An Op-Amp 741 used here as voltage comparator. The model of micro-controller used in this system is is PIC
16F628A. A photo-resistor is used in the system to sense the presence of the vehicle depending on the LASER light availa- ble on it. A light emitting diode used in this system as indica-
1273
tor. A light emitting diode (LED) in essence is a P-N junction
solid-state semiconductor diode that emits light when a cur-
rent is applied through the device [14]. In this system, as a
display, 2X16 line liquid crystal display (LCD Display) is used.
Liquid crystals are first developed in 1888 [15]. Battery is used
to supply power in the circuit of the system. Resistors are used in the system to make voltage divider and to limit current. A
capacitor is a passive two terminal electrical component used to store energy. In this system capacitors are used to stable the voltage in different parts of the circuit [16].
5.1 Identification and toll charging from vehicle
After implementation of this project, different types of ve- hicles have passed through the toll plaza and the project runs successfully. It showed the category of different types of vehi- cles and total toll to be charged from it. The vehicles that have entered the toll plaza are listed in the categories below which were shown in the LCD display after the vehicle passed the toll plaza.
Category A (length approximately 6 feet 7 inches): CNG,
Baby-taxi.
Category B (length approximately 8 feet 1 inch): Car, Micro-
bus, Zeep.
Category C (length approximately 13 feet 4 inches): Mini-
bus, Pick-up.
Category D (length approximately 17 feet 5 inches): Large
bus, large truck.
For example, the figure and details of implementation for a
single vehicle (CNG) from category A is shown below.
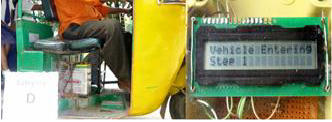
Category “A” Vehicle:
Figure 3.1 (a): Category “A” vehicle entering to
the vehicle monitoring system.
Figure 3.1 (b): Vehicle entering between 1st set of transmitter
and receiver and step 1 is shown in the display.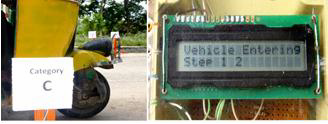
Figure 3.1 (c): Vehicle entering between 2nd set of transmit - ter and receiver and step 2 is shown in the display.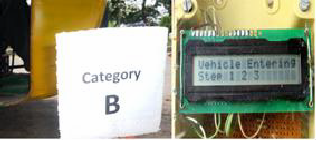
Figure 3.1 (d): Vehicle entering between 3rd set of transmitter and receiver and step 3 is shown in the display.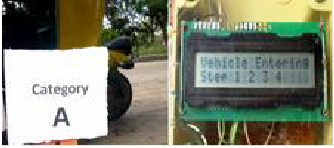
Figure 3.1 (e): Vehicle entering between 4th set of transmitter and receiver and step 4 is shown in the display.
IJSER © 2013
International Journal of Scientific & Engineering Research Volume 4, Issue 4, March -2013
ISSN 2229-5518
1274
At first, CNG (Category “A” vehicle) has passed through the vehicle monitoring system which is shown in figure 3.1(a). During passing the vehicle monitoring system, when CNG cut the LASER between 1st set of transmitter and sensor (Catego- ry D), then step 1 is shown in the LCD display, which is shown in figure 3.1 (b). Then the CNG cut the LASER between
2nd set of transmitter and sensor (Category C), then step 1 &
step 2 is shown in the LCD display, which is shown in figure
3.1 (c). After that, the CNG cut the LASER between 3rd set of
transmitter and sensor (Category B), then step 1, step 2 & step
3 is shown in the LCD display, which is shown in figure 3.1
(d). Then the CNG cut the LASER between 4th set of transmit-
ter and sensor (Category A), then step 1, step 2, step 3 & step 4
is shown in the LCD display, which is shown in figure 3.1 (e).
Finally, when CNG cut the LASER between 5th set of trans-
mitter and sensor, then the last point of CNG was between 4th set of transmitter and sensor and the category of vehicle and
the toll to be charged from it is shown in the LCD display, which is shown in figure 3.1 (f).
5.2 . Calculation of total number of vehicles and total toll under each category:
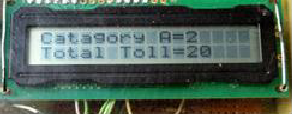
Figure 3.2 (a): Total number of vehicles and total toll collected under category A is shown in the display.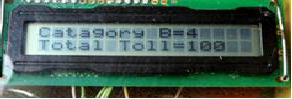
Figure 3.2 (b): Total number of vehicles and total toll collected under category B is shown in the display.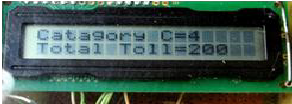
Figure 3.2 (c): Total number of vehicles and total toll collected under category C is shown in the display.
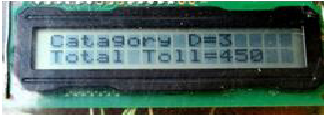
Figure 3.2 (d): Total number of vehicles and total toll collected under category D is shown in the display.
After passing different types of vehicles through the vehicle monitoring system, the total number of vehicles and toll under category A, category B, category C, category D are shown in the display serially in figure 3.2(a), figure 3.2(b), figure 3.2(c), figure 3.2(d).
The system can be implemented to a road or bridge to collect toll. It is necessary to revenue generation to repay the long- term debt issued to finance and the building and maintenance of the toll facility and to collect money to accumulate finance to expand future capacity.
7. LIMITATIONS:
The length of the vehicle in this system is measured from front
wheel to back wheel. This is because if it is measured by
means of its body length; the LASER may not be cut by the body of all types of vehicles as the body of all types of vehicle
is not solid (e.g. CNG). So, the setup is required to be as low as possible to the ground to at least cut the tyre of all the vehi- cles. Again there are only four categories. This may lead to count excess or less toll from a vehicle. To solve this problem, more categories can be introduced in the future work.
Manual system of toll collection is more time consuming and inefficient. Automatic toll collection system reduces the man- ual assistance and delivers secure and time efficient solution for the busy roads. Vehicle monitoring system for toll collec- tion on the basis of the length of vehicle is cost effective and efficient. It can be easily implemented on highways and bridg- es.
[1] Marcycruz De Leon, Thomas M. Fullerton, Jr., Brian W. Kelley, “Tolls, Exchange Rates, and Borderplex International Bridge Traffic” Internation- al Journal of Transport Economics Vol. 36,PP 223-259,2009
[2] Dr K Sri Rama Krisna, “Baseline document for Electronic Toll Collec-
tion (ETC).”, pp. 3,July 2011.
[3] Gregory Fisher,Suman Babbar,“Private Financing of Toll Roads,RMC
IJSER © 2013
International Journal of Scientific & Engineering Research Volume 4, Issue 4, March -2013
ISSN 2229-5518
1275
discussion series”,pp.1-10
[4]Dr. Tom V. Mathew, IIT Bombay, “Traffic Engineering and Manage-
ment”, Chapter 46, pp. 1-3, 11-12, 2nd April, 2012.
[5]S. Lauren, B. Mariko (2007, June 20). “Electronic Toll Collection available,”available online at:
[6] C.M. Roberts, “Radio Frequency Identification (RFID),” Computers & Security, Elsevier, 2006.
[7] L. Jerry, C. Barbara “Shrouds of Time: The History of RFID”, AIM Publication, ver. 1.0,
[8] F. Don, “Electronic Toll Collection: An Introduction and Brief Look at Potential Vulnerabilities,” in SANS Institute infoSec Reading Room, 1.4b ed. 2004.
[9] M. Ayoub Khan, S. Manoj and R. B. Prahbu “A Survey of RFID Tags”,
International Journal of Recents Trends in Engineering, vol 1, no 4, May
2009
[10] Khadijah Kamarulazizi,DR.Widad Ismail,“Electronic toll collection system using passive RFID technology” Journal of Theoretical and Ap-
plied Information Technology,Vol.22,No.2,pp.71.
[11] About toll roads around the world available online(26th december) at:
http://en.wikipedia.org/wiki/Toll_roads_around_the_world
[12] Robert L.Boylestad, “Introductory circuit analysis” Eleventh edition,
Chapter 1, pp. 131-132, 2007.
[13] Gould, R. Gordon , "The LASER, Light Amplification by Stimulated Emission of Radiation". Conference on Optical Pumping, the University of Michigan, pp. 128, 15 June through 18 June, 1959.
[14]Duan Kelvin Seling,"Light Emitting Diodes-An Analysis on construc- tion, material, uses and socioeconomic impact"pp.1, DEC 2, 2002.
[15] Jonathan W.Steed, Jerry L. Atwood, “Supramolecular Chemistry” 2nd
edition, pp. 844,ISBN 978-0-470-51234-0, 2009.
[16] Bird, John, “Electrical and Electronic Principles and Technology”, pp.
63–76, ISBN 0750657782, 2010.
IJSER © 2013