Inte rnatio nal Jo urnal o f Sc ie ntific & Eng inee ring Re se arc h Vo lume 3, Issue 3, Marc h -2012 1
ISS N 2229-5518
Design and Implementation of Maximum Power Point Tracking (MPPT) Algorithm f or a Standalone PV System
S.Gomathy, S.Saravanan, Dr. S. Thangavel
Abs tract- Maximu m pow er point trackers (MPPTs) play a vital role in photovoltaic (PV ) systems because they increase the eff iciency of the solar photovoltaic system by increasing the pow er output. MPPT algorith ms are necessary because PV arrays have a non linear voltage-current characteristic w ith a unique point w here the pow er produced is maximu m. The output pow er from the solar panel varies w ith solar ir radiance, temperature and so on. To increase the pow er extracted f rom the solar panel, it is necessary to operate the photovoltaic (PV) system at the maximum pow er point (MPP).Th is paper presents the Matlab/simulink arrangement of perturb& observe (P&O) and incremental conductance (INC) MPPT algorithm w hich is responsible f or driving the dc-dc boost converter to track maximum pow er point (MPP). This paper also presents the theoretical analysis of variable step size(VSS) of INC MPPT w hich can eff ectively improve the tracking speed and accuracy of maximum pow er.
Inde x Terms :PV, MPPT, P&O, Incremental Conductance (INC),VSS INC
1INTRODUCTION
—————————— ——————————
Photovoltaic and concentrated solar pow er together can
Ener gy is the pr ime mover of economic gr owth and is vital to
the sustenance of a moder n economy . Futur e economic
gr owth cr ucially depends on the long-term availability of
ener gy fr om sour ces that ar e affordable, accessible and envir onmentally fr iendly. Government, industry and independent analyses have shown that cost-effective ener gy efficiency impr ovements could r educe electr icity use by 27% to 75% of total national use w ithin 10-20 years w ithout impacting quality of life or manufacturingoutput . Besides India is wor ld's 6th lar gest electr ical ener gy consumer , accounting 3.4% of global ener gy consumption. The pr esent installed power generation capacity of India stands at 1,
85,496.62MW as on 31.11.2011. About 66% of the electricity
consumed in India is generated by thermal pow er plants and
20.88% by hydr oelectric power plants and 2.57% by nuclear
pow er plants and 11.2% fr om r enewable ener gy sour ces.Accor ding to a 2011 pr oj ection by the International Ener gy Agency, solar pow er gener ators may pr oduce most of the wor ld’s electricity within next 50 year s, dramatically r educing the emissions of gr eenhouse gases that harm the envir onment.
Photovoltaic and solar -thermal plants may meet most of the wor ld’s demand for electr icity by 2060 and half of all ener gy needs with wind, hydr opower and biomass plants supplying much of the r emaining generation.
S.Gomathy is currently pursuing masters degree program in applied electronics in Kongu Engineering College, India, E -mail: goms.6688@gmail.com
Mr.S.Saravanan is currently workingas Assistant Professor in EEE
department in Kongu Engineering College, India, E -mail:
saravanan.me@gmail.com
Dr.S.Thangavel is currently working as Head of EEE Department in KSR
become the maj or sour ce of electr icity.India r eceives solar ener gy equivalent to over 5,000 trillion kWh per year . The daily aver age solar ener gy incident over India var ies fr om 4 -7 kWh per squar e meter per day depending upon the location. Solar photovoltaic (PV) ener gy is nowadays one of the most impor tant available r esour ces because is fr ee,abundant, and pollution-fr ee and distributed all over the wor ld. Unfor tunately, PV generation systems have tw o major pr oblems: the conversion efficiency of electric pow er generation is low (in gener al less than 17%, especially under low irradiation conditions), and the amount of electric pow er gener ated by solar arr ays changes continuously with w eather conditions.Mor eover , the solar cell V -I character istic is nonlinear and var ies with irr adiation and temperatur e. In general, ther e is a unique point on the V -I or V-P curve, called the Maximum Power Point (MPP), at which th e entir e PV system (array, converter , etc.,) oper ates with maximum efficiency and pr oduces its maximum output pow er . The location of the MPP is not known, but can be located, either through calculation models or by search algor ithms. Ther efor e Maximum Pow er Point Tracking (MPPT) techniques ar e needed to maintain the PV array’s oper ating point at its MPP. The P&O, incr emental conductance (INC) method ar e the most known methods to track the MPP byupdating r epeatedly the oper ating voltage of the PV arr ay varying the duty cycle of the pow er converter with a fixed step size. Even though the solar ener gy is pr esent thr oughout the day but the solar irradiation levels vary continuously due to sun intensity on the solar panel var ies continuous due to the var iation in dir ect and diffused radiation falling on the solar panel and also because of the unpr edictable shadows cast by clouds, birds, tr ees, etc. The common inher ent drawback of w ind and
IJSER © 2012 http :// www.ijser.org
Inte rnatio nal Jo urnal o f Sc ie ntific & Eng inee ring Re se arc h Vo lume 3, Issue 3, Marc h -2012 2
ISS N 2229-5518
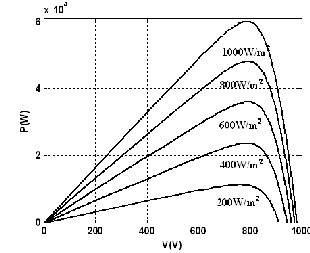
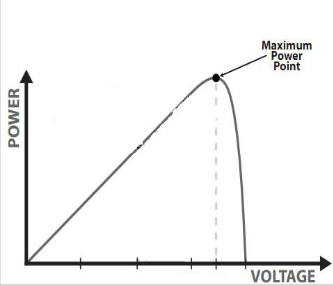
photovoltaic systemsar e their intermittent natur es that make them unr eliable. How ever , by incor porating maximum pow er point tracking (MPPT) algor ithms, the photovoltaic system’s pow er tr ansfer efficiency andr eliability can be impr oved significantly as it can continuously maintain the operatingpoint of the solar panel at the MPP pertaining to that irradiation and temperatur e and so on as shown in Fig.1.
Fig.1 Power-volt age characterist ics of photovolt aic module at different irradiance levels
The output pow er of a PV cell is indeed a non linear function of the operating voltage and this function has a maximum power point (mpp) corr esponding t o a particular value of voltage. In or der to operate at the MPP, an ener gy pow er converter must be connect ed at the output of a PV arr ay, such converter for ces the output voltage of the PV arr ay is equal to the optimal value, also taking into account the atmospher ic condition.
2PHOTOVOLTAIC M ODULE
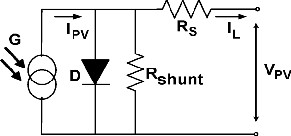
A general simulation model of photovoltaic cells is adopted pr oposed by [3] in this paper . The typical model of a solar cell is shown in Fig. 2
: Curr ent of parallel diode.
: Shunt curr ent.
: Output curr ent.
: Output voltage.
D: Par allel diode.
: Par allel r esistance.
: Ser ies r esistance.
A Single diode model based PV module considering constant insolation and temperatur e is developed in Simulink. This module is used as a source for the maximum pow er point tracker system. The proposed solar panel hasbeen modelled and simulated using the MATLAB/Simulink as shown inFig.3
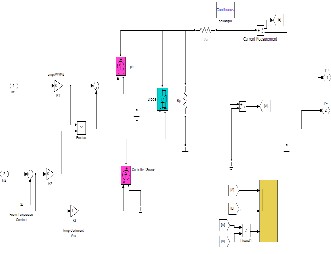
Fig. 3 Simulink model of P V cell (constant irradiat ion)
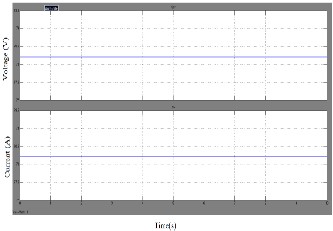
As the insolation and temper atur e is kept constant, the output voltage, curr ent is constant as shown in Fig.4
Fig. 4 Voltage, Current output of P V cell under const ant radiat ion
Fig. 2 Equivalent circuit model of P V cell
(1)

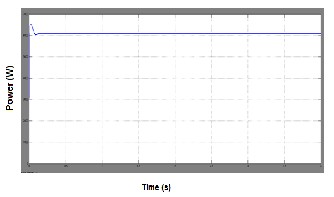
The pow er output obtained under constant radiation of the pr oposed PV model is shown in Fig. 5
: Photocurr ent .
IJSER © 2012 http :// www.ijser.org
Inte rnatio nal Jo urnal o f Sc ie ntific & Eng inee ring Re se arc h Vo lume 3, Issue 3, Marc h -2012 3
ISS N 2229-5518
Fig. 5 Power output of P V cell under const ant radiat ion
Dur ing the start of the system, the contr oller varies the duty cycle ‘α’ to incr ease the power output, when the MPP is r eached, the contr oller maintains a constant duty cycle which can be evidenced in the PW M signal generated by the contr oller as shown in Fig. 6 .
Fig. 6Duty cycle variat ion
As constant insolation and temper atur e ar e not practically possible due to natural changes in weather , a solar cell or PV model w ith varying insolation and temperatur e w er e also designed. The var iation in the inputs such as insolation and temper atur e ar e applied using r epeatingsequence stair .
Fig. 7 Simulink model of P V cell (different radiat ion)
The Simulink model in Fig. 7 takes in to consider ation the var iation of temperatur e and insolation .
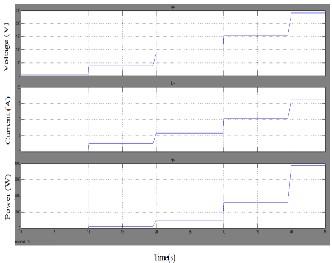
Fig. 8 Voltage, Current , Poweroutput of P V cell under different radiat ion
On the basis of this model, the output character istics of PV ar e simulated and shown in Fig. 8, using MATLAB/Simulink. The insolation change affects the photon generated curr ent and has very little effect on the open circuit voltage. Wher eas the temperatur e v ariation affects the open cir cuit voltage and the short cir cuit curr ent varies very mar ginally.
3MAXIM UM POWER POI NT TRACKI NG
A typical solar panel converts only 30 to 40 per cent of the incident solar irr adiation intoelectr ical ener gy. Maximum pow er point tracking technique is used to impr ove the efficiency of the solar panel. Accor ding to Maximum Pow er Transfer theor em, the power output of a cir cuit is maximumwhen the sour ce impedance matches with the loadimpedance. In the sour ce side a boost conver ter is connected to a solar panel in order to enhance the output voltage. By changing the duty cycle of the boost converter appropr iately the sour ce impedance is matched w ith that of the load impedance.Several approaches have been pr oposed for tracking the MPP [4]. Among those methods, the perturb and observe (P&O) and incr emental conductance (INC) methods ar e widely usedalthough they have some pr oblems such as the oscillation ar ound MPP and confusion by rapidly changing atmospheric conditions [6,7]. In general, these tracking appr oaches use a fixed iteration step size, w hich is determined by the accur acy and tr acking speed r equir ement.
3.1 PERTURB& Observe (P&O) method
The most commonly used MPPT algor ithm is the
P&Odue to its simplicity of implementation .How ever , it has
IJSER © 2012 http :// www.ijser.org
Inte rnatio nal Jo urnal o f Sc ie ntific & Eng inee ring Re se arc h Vo lume 3, Issue 3, Marc h -2012 4
ISS N 2229-5518
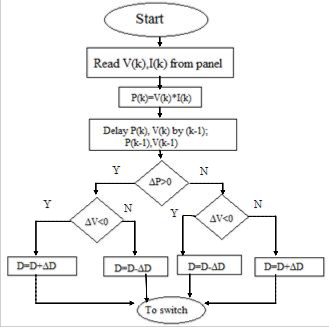
some drawbacks, like oscillations ar ound theMPP in steady state oper ation and also slow r esponse speed at the event of changes in solar irradiance.Fig. 9 shows the algor ithm of P&O.
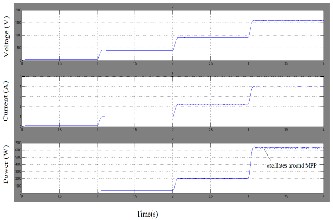
Fig.10 Volt age, Current , P ower output of P&O MPPT algorithm
3.2 INCREM ENTALCONDUCTANCE
The incr emental conductance (INC) method is based on the fact that the slope of the PV array pow er curve is zer o at the MPP also positive on the left of the MPP and negative on the right, as given by the following equation and corr esponding char acter istics is shown in Fig. 11.
Fig.9 Flow chart of P&O MPPT Algorithm
P&O algor ithm is based on the calculation of the PV arr ay output power and the power change by sensing both the PV curr ent and voltage. The contr oller operates per iodically
by comparing the pr esent value of the pow er output with the
pr evious value to determine the change on the solar arr ay voltage or curr ent . The algor ithm r eads the value of curr ent and voltage at the output solar PV module. Pow er iscalculated fr om the measur ed voltage and curr ent. The magnitude of voltage and power at kth instant ar e stor ed. Then the magnitude of pow er and voltage at (k+1)th instant ar e measur ed again and power is calculated fr om themeasur ed values.
If the magnitude of pow er is incr easing, the perturbation w ill continue in the same dir ection in the next cycle, otherwise the perturbation dir ection is r eversed. When
the MPP is r eached, the system then oscillates ar ound the MPP. In or der to minimize the oscillation, the perturbation step size should be r educed such that when the oper ating point is away fr om the MPP, the step change in duty cycle should be lar ge, when it nears the MPP, the step change in‘α’ should r educe.The simulation of output of P&O MPPT algor ithm at varying irradiance condition is shown in Fig. 10


dP /dV>0
, at MPP
, left of MPP
, right of MPP


dP /dV =0
dP /dV<0

Fig.11Typical power-voltage charact erist ics of P V array

IJSER © 2012 http :// www.ijser.org
Inte rnatio nal Jo urnal o f Sc ie ntific & Eng inee ring Re se arc h Vo lume 3, Issue 3, Marc h -2012 5
ISS N 2229-5518


Fig.12 r epr esents the flow chart for INC MPPT algor ithm. The PV array terminal voltage can be adj usted r elative to the MPP voltage by measur ing the incr emental conductance (I/V) and instantaneous conductance (ΔI/ΔV). Once the MPP is r eached, the oper ation of thePV array is maintained at this point unless a change in ΔI is noted. Incase of dP/dV>0, the voltage is incr eased and in case of dP/dV<0, the voltage is decr eased to select the MPP.
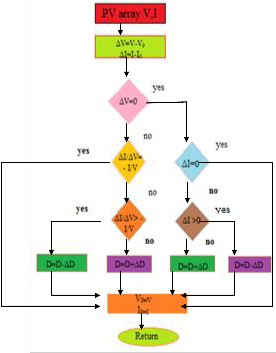
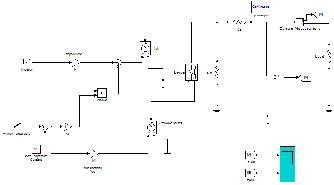
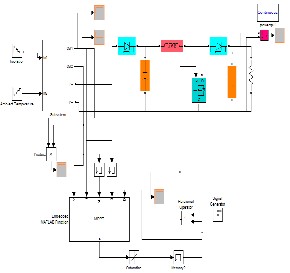
Fig .13 Matlab/Simu lin k arrangement of Incre mental conductancealgorithm.
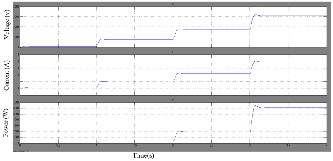
The voltage, curr ent, pow er output of the Incr emental Conductance MPPT algor ithm under varying irradiance and temperatur e condition is shown in Fig. 14
Fig. 14 Volt age, Current, Power characterist ics of INC MPPT algorithm
Fig.12 Flow chart of INC MPPT Algorithm
A maximum pow er point (MPP) tr acker is designed by the combination of incr emental conductance algor ithm [4],[11] W hich tr iggers the duty cycle of the DC/ DC conver ter . Bychanging the duty cycle of conver ter , the PV panel is made to deliver the maximum power at that irr adiance to the load. The Matlab/simulinkmodel of Incr emental conductance algor ithm to track maximum power output, along w ith a DC/ DC boost conver ter is shown in Fig. 13.
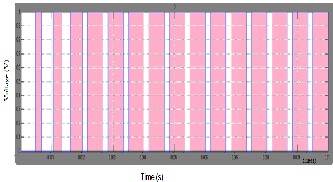
The MPPT contr oller adj usts the duty cycle of the boost converter on the event of any change in the irr adiance to deliver maximum pow er possible. The var iation of duty cycle in fixed step size corr esponding to the change in insolation and temperatur e is shown at time t (sec) in Fig. 15.
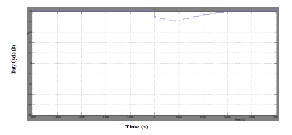
Fig. 15Variat ion in Dut y cycle
Even though the P&O and INC method tracks the maximum pow er under varying atmospher ic condition, the INC method tracks the maximum pow er efficiently than P&O
IJSER © 2012 http :// www.ijser.org
Inte rnatio nal Jo urnal o f Sc ie ntific & Eng inee ring Re se arc h Vo lume 3, Issue 3, Marc h -2012 6
ISS N 2229-5518
method. Hence the compar ison of P&O and INC MPPT of pow er tr acking is shown in Fig. 16.
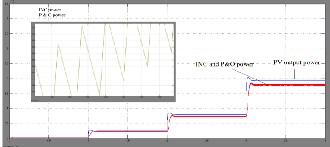
Fig. 16 Output power comparison of P&O and INC MPPT
3.3 Variable ste p s ize INC M PPT algorithm
The pow er drawn fr om the PV array w ith fixed step size contr ibutes to faster dynamics but cr eate excessive steady state oscillations, r esulting in low efficiency. To solve these oscillation pr oblems variable step size INC is implemented in this paper .The update r ule for duty cycle to determine the variable step size INC can be obtainedas follows:

Scaling factor ‘N’ is necessary since manual tuning is tedious. Thus the scaling factor canbe obtained as

(4)
If the above equation cannot be satisfied, the var iable step size INC MPPT will be w or king w ith a fixed step size of the pr eviously set upper limit .The variation in the step size follows the aspects such as when the tracking system operates far away fr om the MPP;the var iation in the step size is lar ge. In addition, w hen the operating point is close to the MPP, the tracker r educes the step size until it is coincides with the MPP. The dynamic per formance of the var iable step size MPPT ensur e a good tr ansient and steady state r esponse. The curr ent, voltage, pow er output of VSS INC MPPT algor ithm is shown in Fig.17.
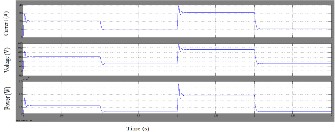
Fig.17 Current , Volt age, P ower charact erist ics of INC VSS MPPT algorithm
The dynamic per formance is faster than that of fixed
step size. It also can be seen a bigger N can be chosen to achieve a faster r esponse when a change in the solar irradiance occurs. The higher value of scaling factor exhibits faster dynamic r esponse when the irradiance and temperatur e varying continuously than low er value of scaling factor [10]. The var iable step size of INC char acteristics is shown in Fig.
18.
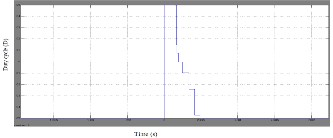
Fig.18 Variable Step Size (VSS) INCMPPT
4CONCLUSION S
P&O and Fixed step size INC and VSS INC MPPT methods ar e implemented with MATLAB-SIMULINK for simulation. The MPPT method simulated in this paper is able to impr ove the dynamic and steady state per for mance of the PV system simultaneously. Through simulation it is observed that the system completes the maximum pow er point tracking successfully despite of fluctuations. When the exter nal envir onment changes suddenly the system can track the maximum pow er point quickly .
REFERENCES
[1]. Trishan Esram, Jonathan W. Kimball, Philip T. Krein, Patrick L.
Chapman, Pallab Midya,―Dynamic Maximum Power Point Tracking of Photovoltaic Arrays Using Ripple Correlation Control,‖ IEEE Trans.pwer Electron., vol 21, no5, pp. 1282 -1291.(IEEE Transactions)
[2]. D. Sera, R. Teodorescu, J. Hantschel, and M. Knoll, ―Optimized maximum power point tracker for fast -changing environmental conditions,‖IEEE Trans. Ind. Electron., vol. 55, no. 7, pp. 2629–2637, Jul. 2008.(IEEE Transactions)
[3]. Vikrant.A.Chaudhar,‖Automatic peak power tracker for solar pv modules‖ July 2005
[4]. T. Esram and P. L. Chapman, ―Comparison of photovoltaic array maximum power point tracking techniques,” IEEE Trans. Energy Convers.,vol. 22, no. 2, pp. 439 –449, Jun. 2007.(IEEE Transactions)
[5]. G. Petrone, G. Spagnuolo, R. Teodorescu, M. Veerachary, and M.
Vitelli,―Reliability issues in photovoltaic power processing systems,‖ IEEE Trans. Ind. Electron., vol. 55, no. 7, pp. 2569 –2580, Jul. 2008.(IEEE Transactions)
[6]. K. Noppadol, W. Theerayod, and S. Phaophak, ―FPGA
implementation of MPPT using variable step -size P&O algorithm for
IJSER © 2012 http :// www.ijser.org
Inte rnatio nal Jo urnal o f Sc ie ntific & Eng inee ring Re se arc h Vo lume 3, Issue 3, Marc h -2012 7
ISS N 2229-5518
PV applications,‖ in Proc.ISCIT, 2006, pp. 212–215.(Co nfe re nce procee ding s)
[7]. A. Pandey, N. Dasgupta, and A. K. Mukerjee, ―Design issues in implementing MPPT for improved tracking and dynamic performance,‖ in Proc. IEEE IECON, 2006, pp. 4387–4391.(Co nfe re nce procee ding s)
[8]. N.Mutoh,T.Matuo,K.Okada,andM.Sakai,―Prediction-databased maximum-power-point-tracking method for photovoltaic power generation systems,‖ in Proc. 33rd Annu. IEEE Power Electron. Spec. Conf.,2002, pp. 1489–1494.(Co nfe re nce procee dings)
[9]. B. M.Wilamowski and X. Li, ―Fuzzy system based maximum power point tracking for PV system,‖ in Proc. 28th Annu. Conf. IEEE Ind. Electron.Soc., 2002, pp. 3280–3284.(Co nfe re nce procee dings)
[10]. F. Liu, S. Duan, F. Liu, B. Liu, and Y. Kang, ―A variable step siz e INC MPPT method for PV systems,” IEEE Trans. Ind. Electron., vol. 55, no.
7, pp.2622–2628, Jul. 2008.(IEEE Transactions)
[11]. H. S. Bae, S. J. Lee, K. S. Choi, B. H. Cho, and S. S. Jang, ―Current control design for a grid connected photovoltaic/fuel cell DC–AC inverter,‖ in Proc. 24th IEEE APEC, Feb. 15–19, 2009, pp. 1945–
1950.(Co nfe re nce procee ding s)
[12]. X. Sun, W. Wu, X. Li, and Q. Zhao, ―A research on photovoltaic energy controlling system with maximum power point tracking,‖ in Proc. Power Convers. Conf., 2002, pp. 822–826.(Co nfe re nce procee ding s)
[13] Emad M. Ahmed and Masahito Shoyama ,‖Variable Step Size Maximum Power Point Tracker Using a Single Variable for Stand - alone Battery PV Systems, Journal of Power Electronics, Vol. 11, No. 2,
March 2011 JPE.(Journal).
IJSER © 2012 http :// www.ijser.org