International Journal of Scientific & Engineering Research, Volume 3, Issue 10, October-2012 1
ISSN 2229-5518
Design and Fabrication of New Radon Chamber for Radon Calibration Factor of
Measurement
Murtadha S. Al-Nafiey,* Mohamad S. Jaafar,* Sabar Bin Bauk,** N.F. Salih*
*Radiation and Medical Physics, School of Physics, Universiti Sanis Malaysia
**School of Distance Education, Universiti Sanis Malaysia
Abstract- This study consists of two parts: the first part is concerned with designing a new radon chamber that is constructed using a continuous radon monitor together CR-39 Nuclear Track Detectors (NTDs). The aim behind designing such a chamber is to measure radon at different times. The chamber has a cubic shape and it is made of pixy glass with a volume of 0.125 . The solid radium 226 source with an activity 5 was placed at the bottom of the chamber to generate radon. The result has shown that the track density increased when increasing the exposure time to radon and the latter's homogenous concentration inside the chamber until it reached 38.377 ± 20 kBq . Second, the calibration factor for radon has been measured using CR-39 NTDs. Besides, PVC was used to calculate the calibration factor k. The values of the calibration factor for radon was
0.024 ± 0.004 ( per ) under three parameters, temperature, humidity and efficiency; accordingly the values were as such 27 ± 1 , 57 ± 5 RH ; 80 % respectively .The study further revealed that the best PVC chamber that detects and measures the real value of airborne radon concentration is 237.67 .
Keywords: Chamber Design; Calibration Factor; CR-39; Radon Monitor; Radon
Email: murtadhababylon@gmail.com *
1. Introduction
The public exposure to radon and to its radioactive daughters present in the environment largely contributes to the average effective dose received by human beings [1]. The international recommendation of the annual dose of the natural radiation obtained from the public is 1 mSv [2]. Radon is an alpha emitted with energy of 5.49 Mev with a half–life of 3.8 days. As a common alpha particle, it is characterized by being relatively heavy and positively charged. Therefore, all the radiation energy will be absorbed in very small volume of matter immediately. Several techniques have been used to measure radon and its daughters in this area. One of these techniques is the solid state nuclear track detectors SSNTDs. Such a technique has been increasingly used in passive time – integrated modes to measure the radon and thoron present in the environmental medium [3, 4]. In fact, this work includes two main parts: the first part is dedicated to design a cubic-shaped chamber that is made of pixy glass and under three parameters. The latter, embed temperature, humidity and the speed of the flux inside the chamber. It further aims at measuring the concentration of radon by using a continuous radon monitor. The second part is concerned with designing and constructing PVC chambers radon
dosimeter via estimating the optimum volume of the dosimeters. Such a step helps measure the calibration factor of radon. The calibration factor was determined through the following expression [5]:

k = (1)
where k is the calibration factor (
per ); c is the standard radon concentration ( ); ρ is the track density ); and t is the exposure time (d) .
2. Radon chamber design
A new radon chamber was designed and fabricated in the Medical Physics at the School of Physics, Universiti Sains Malaysia. The chamber is cubic in shape and is made in laboratory. Its dimensions are (50 cm 50 cm 50 cm). Fig. 1 showcases two photos of the chamber and its continuous radon monitor. It further clarifies most of the following described features:
The chamber consists of four openings. The first opening is located at the top and it is of the size (15 cm, 15 cm). This opening is used to put materials
IJSER © 2012 http://www.ijser.org
International Journal of Scientific & Engineering Research, Volume 3, Issue 10, October-2012 2
ISSN 2229-5518
inside the chamber. The second and third openings are opposite to one another. They are fitted with a thick rubber glove to manoeuvre things inside the chamber and to turn on and off the continuous radon monitor and printing the results. The fourth opening is adjusted to join the power supply for the detector. Furthermore, a fan is fitted to provide the internal air circulation needed inside the chamber. The fifth groups of CR-39 are sized (10×15×0.50)
mm3, produced by the Track Analysis Systems Ltd., Napier House, Meadow Grove, Bristol, and (BS11 9PJ, UK). All these pieces were placed inside the chamber. PVC chamber was designed
with a different volume for each detector, as shown in Fig. 2. The radium source ( ; 5 ) was used to obtain radon gas. In this study, the experimental conditions inside the chamber were properly under a controlled climate. The radon exhalation rate can be calculated by referring to the following climatic conditions each time: the relative humidity, which is 57 ± 5 RH and temperature, which is 27 ± 1 . The continuous radon monitor was placed in SNC calibration camber, using a radon chamber of the US Department of Energy, Environmental Measurement Laboratory.
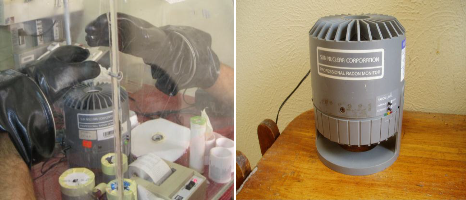
Fig. 1.The radon chamber and the continuous radon monitor model (1023)
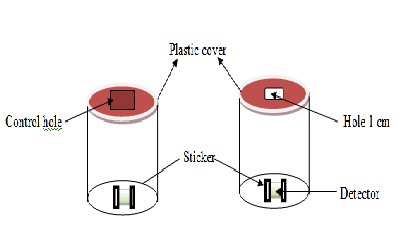
Fig. 2. Homemade radon diffusion chamber
3. Measuring the Concentration of
Radon Activity
In order to determine the concentration of the radon activity inside the chamber, a continuous radon monitor was calibrated from the company. Such work has continued for two month and every
91.2 h, one has to register the results for each hour.
Furthermore, the fifth groups of CR-39 were performed inside the PVC at different exposure times and different levels of exposure. This step has been achieved by controlling the hole in the tap of PVC by placing it differently inside the camber. Such a process helps measure the homogeneity of the radon inside the chamber. Figures 3 and 4 shows the track densities against the exposure time. They further showcase six photos of the track
IJSER © 2012 http://www.ijser.org
International Journal of Scientific & Engineering Research, Volume 3, Issue 10, October-2012 3
ISSN 2229-5518
densities with different times. Figures 3 and 4 also show how the track density increased when increasing the exposure time. The results were then compared with other researches, and were found identical [3] .The average radon concentration was
determined to be 38. 377 ± 20 kBq . All the detectors were treated under etching conditions with water-bath and an optical microscope connected to a computer was used to count and measure the track density.
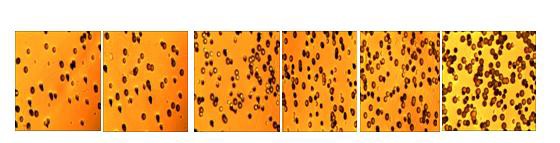
Fig.3. The track densities with different times exposure radon
6000
5000
4000
3000
2000
y = 69.705x + 372.46
R² = 0.9376
1000
0
0 20 40 60 80
Exposur Time (day)
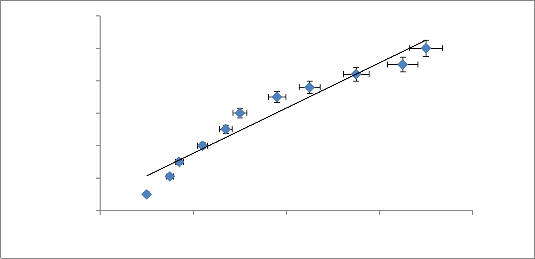
Fig. 4. The track densities against the exposure time
4. Measuring Radon Homogeneity
Homogeneity of radon inside the chamber was tested using the fifth groups CR-39 detectors. These CR-39 groups were arranged inside the chamber differently and in accordance with the position of the fan. The distribution of radon inside the chamber was uniform and its homogeneity might be considered acceptable as the
differences were less than 10 . It should also be noted that the average track densities observed, (around 3500 ± 10 track/ ), were not affected by the exposure circumstances. Fig. 5 shows the average track densities in relation to the different locations of the detector.
IJSER © 2012 http://www.ijser.org
International Journal of Scientific & Engineering Research, Volume 3, Issue 10, October-2012 4
ISSN 2229-5518
3500
3400
3300
3200
3100
3000
1 2 3 4
5 6 7 8
9 10 11
Distance from the source Ra ( cm )
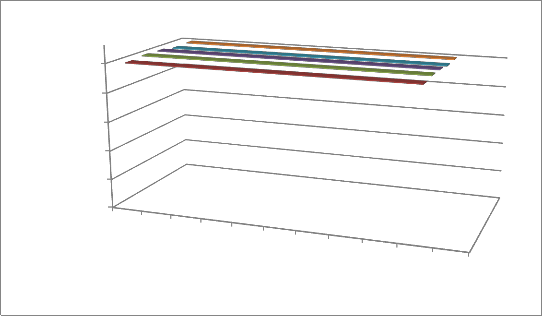
Fig. 5. The track densities with the locations of the detector inside the chamber
4. Measuring the Calibration Factor (k)
The calibration process of the CR-39 was very important in radon detection. The efficiency was measured because the latter was affected by the time of storage. The efficiency the detector was calculated using the radium source. Under these etching conditions, the calculated efficiency (η) was 80 , using the following formula:
η = 1 – sin (Ɵc) (2)
where Ɵc is the critical angle; and are the bulk and track etch rates, respectively. The calibration measured under the etching conditions was 6.25 N NaOH – 70 [6, 7], using the optimum time of etching, 6 h.
To determine the calibration factor, equation 1 was used. The fifth groups of CR-39 were performed with different volumes of PVC. They were then put inside the radon chamber for
91.2 h. It was noted that the calibration factor for radon detection depended on the geometric of its dosimeter. Besides, the emitted alpha particles located at a distance more than 8 cm has revealed that the dosimeters does not affect the detectors at least in this height - 10 cm with different diameters [8]. For this purpose, the fifth groups were listed as follows:
(1) Group one were exposed with the PVC volume 34.64 and with (10 and 2.1 cm) height and diameter, respectively.
(2) Group two were exposed with the PVC
volume 96.25 and with (10 and 3.5 cm) height and diameter, respectively.
(3) Group three were exposed with the PVC
volume 159.1 and with (10 and 4.5 cm) height and diameter, respectively.
(4) Group four were exposed with the PVC
volume 237.67 and with (10 and 5.5 cm) height and diameter, respectively.
(5) Group five were exposed with the PVC
volume 331.96 and with (10 and 6.5 cm) height and diameter, respectively.
All detectors were etched and counted using the same condition described earlier. The optimum values for the calibration factor was
(0.024∓ 0.004 ( per .d) at an
optimum volume that equals 237.67 , as
shown in Fig. 6.
Table 1 depicts the values of calibration factor presented in this paper which agrees with the previous obtained results [9, 10, 11, and 12].
IJSER © 2012 http://www.ijser.org
International Journal of Scientific & Engineering Research, Volume 3, Issue 10, October-2012 5
ISSN 2229-5518
0.026
0.024
0.022
0.02
0.018
0.016
0.014
0.012
0.01
0 50 100 150 200 250 300 350
V( cm3)
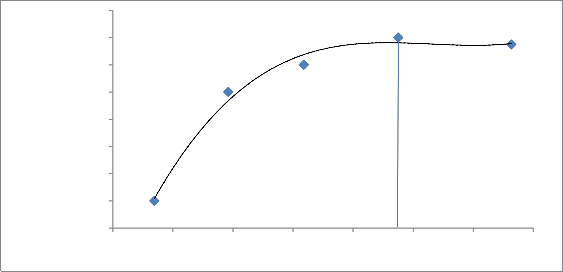
Fig.6. Calibrating as the dosimeter volume.
5. Conclusions
A new chamber fitted with many features was designed and fabricated to enable the calibration of radon measurement. Controlling the temperature, humidity and many other parameters was achieved. The track densities were noted to increase with increase in radon concentration. The concentration of radon measured inside the chamber was 38.377 ± 20 kBq . The calibration factor was 0.024 ± 0.004 ( per
.d) at 80 efficiency. Besides, the optimum volume in this study was 237.67 . This work was in line with the previously conducted studies in the same field of knowledge.
Acknowledgments
This study was supported by the School of
Physics in Universiti Sains Malaysia.
Table: 1Comparison results between present work and other references
References
[1] United Nations Scientific Committee on the Effects of Atomic Radiations UNSCEAR Sources and effects of ionizing radiation. UN, New York,
1982.
[2] A.D.Wrixon, New ICRP recommendations
.Journal of Radiological Protection, 28, 161-168,
2008.
[3] R. Shweikani, G. Raja, Design, construct and test of a calibration radon chamber, Radiat. Meas.
40, 316-319, 2005.
[4] D. Nikezic H., K.N. Yu, Computer program TRACK-TEST for calculation parameters and plotting profiles for etch pits in nuclear track materials, Comput. Phys. Commun. 174, 60, 2006.
IJSER © 2012 http://www.ijser.org
International Journal of Scientific & Engineering Research, Volume 3, Issue 10, October-2012 6
ISSN 2229-5518
[5] Y. S. Mayya, K. P. Eappen, K. S. V. Nambi, Methodology for mixed field inhalation dosimetry in monazite areas using a twin-cup dosimeter with three track detectors”, Rad. Prot. Dosim., 77(3), pp.177-184, 1998.
[6] Gil Hoon Ahn, Jai-Kilee , Construction of an environmental radon monitoring system using CR-
39 nuclear track detectors, Nucl.Eng. Technol.37 (4) 395-400, 2005.
[7] M. I. Al-Jarallah, Fazal-ur-Rehman, Khalid Abdalla , Comparative study of short and long-term indoor radon measurements , Radiat.Measure.43, S471-S474, 2008.
[8] A. H. Ismail, Mohamad S. Jaafar , Design and construct optimum dosimeter to detect airborne radon and thoron gas: Experimental study, Nucl. Instr. and Meth. In Phys. Res. B269, 437-439,
2011.
[9] Marcia Pires de Campos and Elaine Wirney Martins, Calibration of the solid state nuclear track detector CR-39 for radon measurements . INAC International Nuclear Atlantic Conference Santos, SP, Brazil, ASSOCIAÇÃO BRASILEIRA DE ENERGIA NUCLEAR – ABEN. ISBN: 978-85-
99141-02-1, 2007.
[10] J. C. H.Miles and E. J. Dew , A passive radon gas detector for use in homes. In Solid State Nuclear Track Detectors (Edited by Fowler P. H. and Clapham V. M.). Pergamon Press, Oxford ,
1982.
[11] M. C Subba Ramu., T. S. Murlidharan and T. V. Ramachandran , Calibration of a solid state nuclear track detector for the measurement of indoor levels of radon and its daughters. Sci. Total Environ. 73, 245-255, 1988.
[12] J.Giridhar and M.Raghavayya , Calibration of cellulose nitrate film for measurement of time integrated concentration of Rn-222 in air. Report No. 1319, BARC, Bombay, 1986.
IJSER © 2012 http://www.ijser.org