International Journal of Scientific & Engineering Research, Volume 4, Issue 6, June-2013 33
ISSN 2229-5518
Design analysis of Controller to improve Transient response of 2nd order system & tuning rule for the same
Ms. Shraddha R. Khadatkar1 Mr. Sandip M. Apte2 Mr. Yogesh R. Ikhe3
Abstract: — This paper presents effect of ξ on the transient response of the second order systems. Designed a simple RLC series circuit
in our laboratory and applying the step input. The value of ξ is derived by using this series circuit. By deriving the formula, verified the
effect of the value of ξ a s P ID c o n tro lle r. O b s e rve th e various waveforms on CRO. Simulation and experimental results are provided
to demonstrate the effectiveness of the findings. And also discussed about the PID tuning rules for 2nd order system with example.
Index Terms: — Transient response, Damping ration, PID controller, speed response, PID tuning.
—————————— ——————————
1. INTRODUCTION
n control system analysis and design it is important to consider the complete system response and to design controllers such that a satisfactory response is obtained for all time instants t
≥ to. Where-to stands for the initial time.
The study of a control system in time domain
essentially involves the evaluation of transient and
steady-state response of the system. The nature of transient response of a linear control system is revealed by any of the standard test signals – impulse
,step, ramp, parabola as this nature is depend upon
system poles only and not on the type of the input. It
is therefore sufficient to analyses the transient response to one of the standard test signals; a step is generally used for this purpose. However, if the system is unstable, the transient response will increase very quickly (exponentially) in time, and in the most cases the system will be practically unusable or even destroyed during the unstable transient response
In a control system, the input signal may contain spurious signals in addition to the true signal input, or there may be sources of noise within the closed loop system. This noise is generally in a band of frequencies above the dominant frequency band of the signals. Thus in order to reproduce the true signal and attenuate the noise, feedback control system is designed to have a moderate bandwidth. This impose a limit on reducing rise time & increasing Wn. Large Wn has a large bandwidth & will therefore allow the high frequency noise signal to affect the performance.
Steady-state response depends on both the
system and the type of input .from the steady-state
point of view the easiest input is generally a step.
Since it requires only maintaining the output at a
constant value once the transient is over. The system is asymptotically stable, and then the system response in the long run is determined by its steady state component only.
For higher-order systems, only approximations for the transient response parameters can be obtained using a computer and the feedback elements which help to reduce the steady state errors to zero are identified.
This paper is organized as follows: In Section
2, the model of systems and the design method of PID
controller are described. Section 3 presents the
experimental set ups and analytical results of the RLC series circuit. In section 4 Simulations are explained and PID tuning in section 5. Finally, conclusions are drawn in section 6.
The study of a control system in time domain
essentially involves the evaluation of the following:- A] Steady state response
B] Transient response
1.1 Steady state response:-
It is that part of response that remains after the transient have died out or it remains even after infinity time
1.2Transient response:-
Transient response is that Part of response which vanishes as time approaches to ∞.Such type of change is called as transient response .the nature of transient response of a linear control system is revealed by any of standard test signals that is Impulse, step ramp and parabolic. The nature of a transient response depends upon system poles only and not on the type of input.
IJSER © 2013
http://www.ijser.org
International Journal of Scientific & Engineering Research, Volume 4, Issue 6, June-2013 34
ISSN 2229-5518
2.TRANSIENT RESPONSE SPECIFICATIONS
2.1 Unit step response of a 2nd order under damped system:
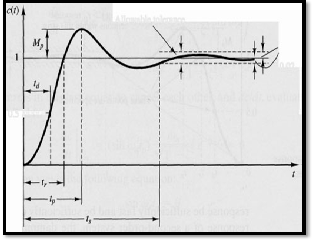
The transient response of a practical control system often exhibits damped oscillations before reducing steady state. In specifying the transient response characteristics of a control system to a unit step input, it is common to specify the following:-
Where,
tr –rise time tp -peak time
ts – Settling time
td – delay time
Mp – peak overshoot
2.1.1] Rise time (tr):-
For under damped system, the rise time is normally defined as the time required for the step response to rise from 0 to 100% of its final value. Also for under damped system, the 10 to 90% rise time is commonly used.
Tr = π - Ө/ wd
2.1.2] Peak time (tp):-
It is the time required for the
response to reach the first peak of the overshoot.
Tp = π / wd
2.1.3] Peak overshoot (Mp):-
It is the peak value of response curved measured from unity. If the final steady state value of the response differ from unity then it is common to use percentage peak overshoot.
%Mp=[c (tp)-c (t∞)]/c (t∞) *100
2.1.4] Delay time (td) :-
It is the time required for the response to reach up to 50% of the final value in first attempt.
Lim c→∞ c(t)=1
2.1.5] Settling time (ts):-
It is defined as the time required for the response to reach and steady within a specified tolerance band usually 2% to 5% of its final value.
The final value of response is 1% and
2% of final value is 0.02.hence Ts is the time required so that the output will be reached and stay within

0.982 to 1.of its final value.
Ts= =2% tolerance
= = 5% tolerance
Note: -
Rise time and peak time are intended as speed of response criteria. Clearly the smaller these values, the faster the system response .peak overshoot is used mainly for relative stability. Values in excess of about 40%may indicate that the system is dangerously closed to absolute stability. Settling time combines stability and speed of response aspects and is widely used.
3.DESIGN PROCESS:-
An RLC circuit driven by numerous frequencies of a sinusoidal function can be modeled to represent a second-order system. The total response of an RLC circuit to a sinusoidal function input can be characterized as the sum of the transient and steady state responses of the system. RLC circuit theory as well as second order system is discussed extensively in this section.
3.1 The RLC Circuit Model
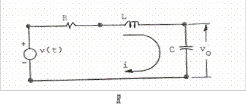
For an RLC circuit model, the configuration shown in Figure 15 can represent the process dynamics of the system
-L-C SERIES:-
3.2 DERIVATION:
Apply KVL in the given circuit diagram:-
IJSER © 2013 http://www.ijser.org
International Journal of Scientific & Engineering Research, Volume 4, Issue 6, June-2013 35
ISSN 2229-5518


Vi =Ri +L + ∫ I dt
Vi(s) =RI(s) +sLI(s) + I(s) [R + sL+ ]I(s)
Tabulate the result as follows
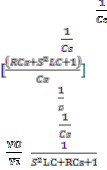
3.3 CALCULATION TABLE:-
I(s)
VO (t) = ∫I dt

VO (t) = I(s)

= 
 Making the coefficient of s2 as 1

=T.S. = 


=

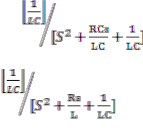
By comparing with the standard 
 characteristic equation of second order system,


+(2ξ 𝓌n)=
𝓌n=


2 ξ =


ξ=

The expression of second order system simply means that the power of the highest derivative in the general equation describing the system will be two. If the number of derivatives in a second order system is n = 2, a second order system will have integration constants
Procedure:-
Make the connections as shown in circuit diagram; connect repeated step input to RLC circuit. Make power on to the unit.
Connect CRO at the output and adjust CRO
to get stable pattern on CRO.
Vary R by pot meter and for a given set of
values of R, L,&C study the transient response as
observed on CRO.
Plot the same response on Graph paper.
Study the pattern by using another set of L&
C or by varying R.
Each time note the values of R , L & C.


3.3.1WAVE FORM OF THE EXPERIMENTAL SET UP :-
IJSER © 2013 http://www.ijser.org
International Journal of Scientific & Engineering Research, Volume 4, Issue 6, June-2013 36
ISSN 2229-5518
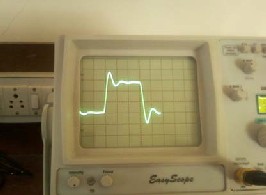
Fig(a) - For ξ=0.3
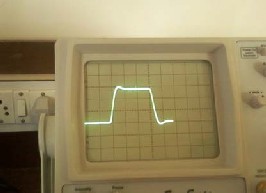
Fig(b)- For ξ=0.7
4. SIMULATION :-
As we have made one program with values of R,L,C and by simulation we got the results as that of by experiment that is the results observed are same.
5. PID
A PID (Proportional Integral Derivative) controller is a common instrument used in industrial control applications. A PID controller can be used for regulation of speed, temperature, flow, pressure and other process variables. Field mounted PID controllers can be placed close to the sensor or the control regulation device and be monitored centrally using a SCADA system.
A typical PID temperature controller
application could be to continuously vary a regulator which can alter a process temperature. This may be a pulsed switching device for electrical heaters or by opening and closing a gas valve. A heat only PID temperature controller uses a reverse output action, i.e. more power is applied when the temperature is below the set point and less power when above. PID control for injection and extrusion applications often employ additional cooling control outputs and usually require multiple controllers.
A PID controller (sometimes called a three term controller) reads the sensor signal, normally from a thermocouple or RTD, and converts the measurement to engineering units e.g. Degrees C. It then subtracts the measurement from a desired set point to determine an error.The error is acted upon by the three (P, I & D) terms simultaneously:
5.1PID Controller Theory
The following section examines PID controller theory and provides further explanation of the question `how do PID controllers work'.
5.2Proportional (Gain)
The error is multiplied by a negative (for reverse action) proportional constant P, and added to the current output. P represents the band over which a controller's output is proportional to the error of the system .If the temperature overshoots the set point value, the heating power would be cut back further.
IJSER © 2013 http://www.ijser.org
International Journal of Scientific & Engineering Research, Volume 4, Issue 6, June-2013 37
ISSN 2229-5518
Proportional only control can provide a stable process temperature but there will always be an error between the required set point and the actual process temperature.
5.3Integral (Reset)
The error is integrated (averaged) over a period of time, and then multiplied by a constant I, and added to the current control output. I represent the steady state error of the system and will remove set point / measured value errors. For many applications Proportional + Integral control will be satisfactory with good stability and at the desired set point.
5.4Derivative (Rate)
The rate of change of the error is calculated with respect to time, multiplied by another constant D, and added to the output. The derivative term is used to determine a controller's response to a change or disturbance of the process temperature (e.g. opening an oven door). The larger the derivative term, the more rapidly the controller will respond to changes in the process value.
5.5PID Tuning
The PID controller design method is a time consuming procedure to get final result [12]. We can use simple formulas that describe the relations among the parameters of PID controller, the parameters that characterize the system dynamics and the upper bound of crossover frequency, the user can obtain proper PID controller parameters easily and need not to run the entire design procedure. In this example the performance and use of the tuning rules are demonstrated, these tuning rules were applied to a few systems. Comparisons will be made with Astrom and
Hagglund’s method [08, 10], Haeri’s method [11] and
Shen’s [09] method.

EXAMPLE: Consider a under damped systemG1(s)
A step test obtained Ks 1. n and were determined by relay feedback test as 1.73 and 0.288 respectively. Applying the exact parameters to Haeri’s method [11]
gives K 8.383, 8.45 i T, 0.929 d T and b 1. The
crossover frequency of G1(s) controlled with this PID
controller is 23.48 and the closed-loop bandwidth is
about 23 (about thirteen times wider than that of
G1(s)). Let B 3.5 and apply the parameters of
approximated model to the proposed tuning rules[12],
the following controller parameters can be obtained: K
8.55, T i 0.67, T d 0.226, and b 0.76[12]. The
gain of this controller is similar to that tuned by Haeri’s method. The crossover frequency of G1(s) controlled with this PID controller is6.23 and the closed-loop bandwidth is about 8.9. Fig.e) depicts the control result of these two controllers. Clearly, the performance of the proposed method is better than Haeri’s method.
Fig. e) Set point and load disturbance responses of G2 (s) controlled by a PID controller tuned by the proposed method and Haeri’s method.
6. CONCLUSION:
1] Selection of damping ratio for industrial application required a tradeoff between relative stability and speed of response.
2] A damping ratio decrease, it increases peak
overshoot. In this Mp, Tr, Ts, Td decreases. So the system settles down faster. Hence transient response improves.
3] The proportional-integral-derivative (PID)
control algorithm has three-term functionality
enabling the treatment of both transient and steady- state responses; it provides a generic and efficient solution to real world control problems. The wide application of PID control has stimulated and sustained research and development in order to “get the best out of PID”, and the search is on to find the next key technology or methodology for PID tuning.
4] If the required is to design an extremely accurate control system whose steady state error to position and velocity input are extremely small , the transient response is not the primary performance criteria to optimize; minimum steady-state error is the
IJSER © 2013 http://www.ijser.org
International Journal of Scientific & Engineering Research, Volume 4, Issue 6, June-2013 38
ISSN 2229-5518
major objective. Because the steady state error is
proportional to ξ and these values are very close to
0.1.for such application the disadvantages of relatively long settling time must be tolerated.
When ξ = 1, the overshoot cannot be tolerated. I.e. a good compromise between rise time and overshoot.
5]from fig (a) & fig (b) we can conclude that, the time constant is improved with respective to the value of ξ.
6] Tuning rules take the bandwidth limitation
into consideration. Therefore, the user can tune the
PID controller according to the bandwidth limitation of the system.
7.1 ACKNOWLEDGMENT
We wish to thank Mr. Rahul S. Somalwar for his valuable guidance and support for completing this paper.
7.2 REFERENCES:-
1] M GOPAL,”Principles and Designs of
Control System”, second edition pp 337-343.
2] I.J.Nagrath & M.Gopal,” control system
engg”, fifth edition pp 194-215.
3] Shinkey, F. G., Process Control System
Application, Design and Tuning, 3rd ed., McGraw-Hill,
New York(1988).
4] Mohair, M. and E., Zafiriou, Robust Process
Control, Prentice-Hall, Englewood Cliffs, NJ, (1989).
5] Ziegler, J. G. and N. B., Nichols, “Optimal
settings for automatic controllers”, Trans. ASME, Vol.
64, pp. 759-768 (1942).
6] Smith, C. A. and C. B., Corripio, Principals
and Practices of Automatic Control, Wiley, New
York,(1985).
7] Smarajit Ghost ,”Control system theory
and application” pp:-37-40
8] Astrom, K. J. and T., Hagglund, PID Controllers:-Theory, Design and Tuning, ISA, Research TrianglePar, NC, (1995).
9] Shen, J. C., “New tuning method for PID
controller”,ISA Trans., Vol. 41, pp. 473-484 (2002).
10] Hagglund, T., and K. J., Astrom, “Revisiting the Ziegler-Nichols tuning rules for PI control”, Asian Journal of Control, Vol. 4, 364-380 (2002).
11] Haeri, M., “Tuning rules for PID
controller using a DMC strategy”, Asian Journal of
Control, Vol. 4, pp. 410-417 (2002).
12] Jing-Chung Shen Huann-Keng Chiang
PID Tuning Rules for Second Order Systems
Huwei, Yunlin, Taiwan.
IJSER © 2013 http://www.ijser.org