International Journal of Scientific & Engineering Research, Volume 4, Issue 4, April-2013 1311
ISSN 2229-5518
Demarcation of Surface Water Protection Perimeters by Using GIS: Case of Gagnoa Reservoir in West Central of Côte d'Ivoire
Anowa Evrade Eba, Kan Jean Kouamé, Jean Patrice Jourda, Gabriel Etienne Aké, Saley Mahaman Bachir, Kouao Armand
Anoh, Deh Serge Kouakou
Abstract-The water retention Gagnoa built on a sub-tributary of the river Sassandra named Guéri. It drains a catchment area of approximately 700 km2 with a storage capacity of 2,336,000 m3 of water. This water retention which serves drinking water to the city of Gagnoa and its surroundings is subject to frequent pollution from domestic and agricultural degrading the quality of this res ource. Indeed, several source of pollution were identified in the reservoir basin. The latters have led to the damage of resource the quality. Thus, seen its usefulness for the population, it appear important to fit a management tool through protective perimeters. These will allow r educing the risk of pollution, preserve and protect this surface water resource intended for drinking water. The methodological approach employs a spatial analysis model integrating several previously parameters defined such as slope, land use, soil type, drainage density and run off. They will
be prioritized and weighted and then integrated into a geographic information system (GIS). Our study allowed delineating three protection zones around the reservoir through the cartography of vulnerabilities areas. Certain activities are regulated or prohibited inside of areas. These areas are defined:
- Zone I or immediate protection perimeter has limited to a radius of 100 m around the reservoir;
- Zone II or close protection perimeter was defined taking into account of water direction and areas influencing strongly on reservoir vulnerability;
- Zone III or distant protection perimeter covers the most part of basin taking account diffuse pollution.
Index Terms- Gagnoa, GIS, multicriteria analysis, pollution, Protection perimeter, vulnerability, water retention
—————————— ——————————
1. INTRODUCTION
General pollution of water, whether punctual, accidental or diffuse is currently a widespread problem involving several actors among which the scientific community, civil society and policy [1]. This pollution is much taken seriously that water resources become scarcer following the years [1]. It is so important that these water resources require a more precise management to minimize the losses and non- productive uses. Such management requires a more detailed knowledge of the resources, their spatial and temporal distribution, their quality and losses, as all anthropogenic activities that can affect their quality [2].
In Côte d'Ivoire, the hydrogeological context is particularly
bound to geological ground nature which is composed of
97.5% of the crystalline basement and cristallophyllienne.
Thus, according to this fact the major part of its water comes from aquifers base [3]. Nevertheless, the low overall productivity of aquifers and the growing of population favor the use of surface water as an alternative source or main water supply by regions
Anowa Evrade Eba registered PhD Hydrogeology at the University of Abidjan
Felix Houphouet Boigny, Côte d'Ivoire. E-mail: eba_larissa@yahoo.fr
Kan Jean Kouamé : Maitre Assistant at the Faculty-STRM-STRM. University
Felix Houphouet Boigny Côte d'Ivoire. E-mail: jeankkan@hahoo.fr
Pr Jean Patrice Jourda : Full Professor, at the Faculty-STRM-STRM. University Felix Houphouet Boigny Côte d'Ivoire. E-mail: jourda_patrice@yahoo.fr
These waters are often picked up in natural or artificial reservoirs built for this purpose.
The Land use for urban agriculture and industry around
the surface water contributes to enhancement of potential
for contamination of the latter and in some cases, a real
deterioration of their quality. To avoid or minimize these
problems of contamination, it is essential to take all measures to ensure the quality of surface water intended for drinking water [4]. The achievement of protection perimeters around these water resources is an important tool to achieve this goal [5].
In fact, in Côte d'Ivoire, to make up for the vulnerability
problems of water resources, the establishment of perimeters were taken. But only groundwater, have benefitted of several studies and protection; no surface water has yet gotten protective perimeters. This study is one of the first in this field. The purpose of this study is to determine protection perimeters around surface water resource using GIS to reduce the risk of pollution of this one.
This study is a contribution to better management of
surface water intended for consumption.
IJSER © 2013 ttp://www.ijser.org
International Journal of Scientific & Engineering Research, Volume 4, Issue 4, April-2013 1312
ISSN 2229-5518
2. PRESENTATION OF STUDY AREA
The study area belongs to Gagnoa's region. It is a forest zone which concentrates several populations of different
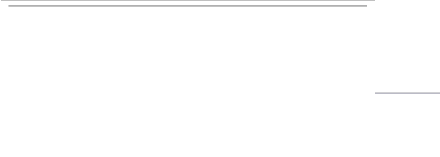
origins. This is a sub-basin of Sassandra great basin. The latter has five main sub-basins that are Daloa, Man, Odienné and Gagnoa. These sub-basins include several reservoirs such, the reservoir of Gagnoa's city exploited by SODECI (Water Distribution Company of Côte d'Ivoire) [6]. Gagnoa basin is located between longitudes 5°56 and 6°1 W and latitudes 6°6 and 6°12 N and occupies an area of approximately 700 km2 (Fig. 1).
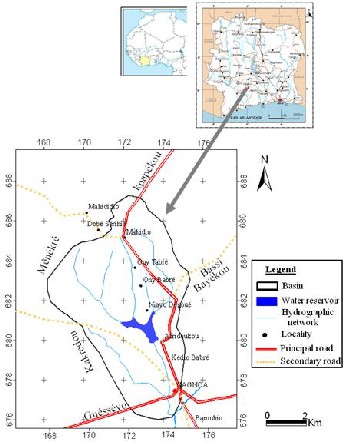
Fig.1. Location of study zone
Water retention of this study has been created after a dam building on the Guéri which is a sub-tributary of Sassandra River. This reservoir has a water storage capacity of approximately 2.336000 m3 and enables the drinking water supply of population. However, it is subject to much pollution related to human activities that are developed in its surrounding.
On the lithological plan, geological formations of the
Gagnoa region belong to the domain of Proterozoic,
regrouping two types of rock formations: Eburnean formations and Eburnean post-formations. These are
formed by plutonic formations, the base granite-gneissic, volcanic complex or volcano-sedimentary and complex flyschoïde [7]. At the study area scale, two type of rock are identified: métagranodiorites biotite and, or hornblende and métagranites biotite and dominant muscovite [8]. The high alteration of these formations provides important alterite thickness of reddish color that show both sides, horizons leached with fine ferruginous gravel and horizons with abundant kaolinite and spotted. On the hydrological and hydrogeological plan, this area is well watered and drained by several rivers fed-batch or continuous depending on the season. Found there as in all areas of the base, three types of reservoirs formed reservoirs alterites often very low permeability, cracks and a reservoir in the rock traversed by large tectonic fractures[9].
3. METHODOLOGICAL
3.1. Principle of protection perimeters running
Protection areas generally aimed at strengthening the protection of the resource for consumption. In fact, the pollution of water resources decreases as one moves away [5].
In Côte d'Ivoire, according to Article 38 of the water Code
Law no98-755 of 23th December 1998, the scope of protection
as a public healthiness measure is mandatory. There are
three types: the immediate scope of protection (zone I), the close protection perimeter (zone II) and the scope of protection away (zone III).
In zone I, it is question of prohibiting access to the sampling point and treatment facilities, and toprotect them vis-à-vis acts of malice. According to Garouani and Merzouk [5], the
size of this area should allow intervening properly in case of accidents, removing each human influence and implementing a vegetation zone oriented protective.
Zone II, is intended to maintain the quality of water at the approach to the outlet. The longitudinal extension of the
perimeter must also provide a response time for the operator in case of accidental pollution and its lateral extension should help reduce runoff and reduce or eliminate the risk of pollution from these activities on slopes of the basin of the lake [10].
Finally, zone III is a possible extension of zone II. It must ensure the protection of waters against extensive damage, especially pollution or persistent and difficult to remove chemical or radioactive pollution [11].
3.2. Approach
This work, the territorial unit used is the watershed. Therefore, only the factors identified in this scale will be used for the determination of protection zones.
The approach is based on the assessment of vulnerability to pollution of the resource. In fact, all factors that can contribute to the evaluations of vulnerability to pollution are identified. These factors are then selected hierarchical, weighted according to their importance in the process of
IJSER © 2013 http://www.ijser.org
International Journal of Scientific & Engineering Research, Volume 4, Issue 4, April-2013 1313
ISSN 2229-5518
delineation of protection zones and then integrated into a GIS. According to Garouani and al.[12], there exists in the literature, a variety of methods for delineating protection perimeters, however, the most relevant are those that allow the integration of topographic, geological and hydrological. However, these factors are selected based on their availability and the limits of capacity and performance of the method.
3.2.1. Choice of parameters or factors
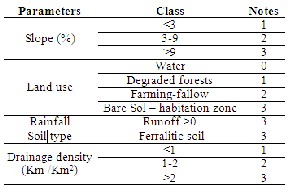
In this study, the work of [5], on the dam Hachef Morocco and those made by [13], have served as a guide in the choice of data. Depending on the availability of data, five (05) parameters were selected: the land, the slope of the surface topography, drainage density, soil type and runoff.
Slope of the surface topography (P)
Surface slope is one of the most important parameters in
determining the perimeters of protection (PDP) because it influences the vulnerability of water resources of surface inclination. More its inclination increases, its steep slopes over the ability of the flow is high and the risk of pollution of surface water increases. But if the inclination decreases (lower slopes), we will see a dominance of infiltration.
The slope map was made from a Digital Elevation Model
(DEM) curves generated from topographic study area (Fig.
2).
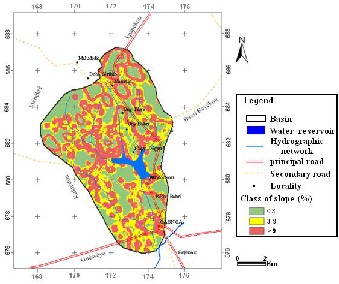
Fig.2. Slope Map of study area
Land use (OS)
Chery [14], defined land use as the cover of the biophysical land surface. Its importance in this study is that it has the most activities in the area studied. Activities that alter the vegetation of the area are urbanization, roads and crops using fertilizers or not. This modification of the natural process of functioning ecosystem, increases water pollution.
Also, the situation may be aggravated when it is poor drainage of domestic sewage or industrial highly urbanized [10]. In addition, an area with well cover slows or prevents soil erosion. This coverage is therefore a natural protection against pollution to surface waters.
This map is derived from the image processing Landsat ETM+ in 2003 (Fig. 3). After processing and obtaining the land use map of ENVI4.5, it was transferred to 9.3 for ArcGis be rasterized in order to make it usable in the GIS.
Fig.3. Land use Map study area
Soil type(S)
The soil is another parameter in the process of pollution of
surface water. It plays a significant role in the passage of water and consequently in time transfer of pollutants from the soil surface to water [15]. Indeed, the vulnerability of the means transfer of pesticide to water depends on the characteristics of the soil that is the receiver of these products. Also, the characteristics of the soil determine the partition of rainwater between infiltration and runoff by taking into account the slope.
The study area has only a pedologic unit (Fig. 4), that is
revised ferralitic soil more or less denatured [16].
IJSER © 2013 http://www.ijser.org
International Journal of Scientific & Engineering Research, Volume 4, Issue 4, April-2013 1314
ISSN 2229-5518
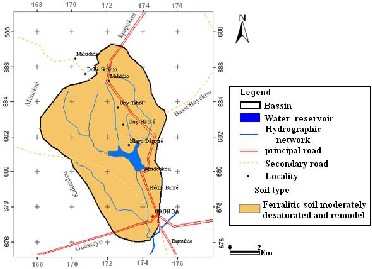
Fig.5. Drainage density Map of study area
Fig.4. Soil map of study area
Drainage Density (DD)
Pollution of surface water (lakes, dams, rivers etc..) is related to the density of the river network that underlies these resources. Indeed, the river network collects all the drainage water from the same pond with the possibility of contamination by pollutants to convey to the outlet built sometimes as in this restraint case. More by the hydrographic network management unit is dense, vulnerability to pollution of the resource is high [13].
It is this parameter to evaluate the drainage density of the basin drainage. Density map drainage area has been
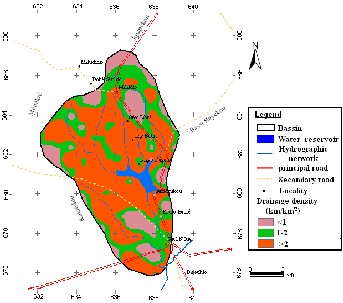
derived from a map of the drainage treated Linwin software which measures the number density drain gridded (Fig. 5). It was then rasterized through software Arcgis 9.3.
Runoff (rainfall) (R)
Rainfall is also a key parameter in the process of assessing
vulnerability to pollution of surface water. Indeed, the
intensity of rainfall influences the runoff water fraction fell [13]. For these authors, the duration and the amount of rainfall determine the onset of runoff when the soil has reached the maximum infiltration capacity.
Runoff is a senior transfer of pollutants to surface waters
[17]. More runoff in large quantity, the risk of contamination sources is high. The study area with only one hydrométéoric station, runoff was obtained by applying the runoff coefficient of the area to the average annual rainfall. A value of runoff 171.028 mm is obtained, a side of 3 is assigned to the entire study area.
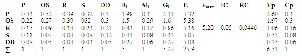
Table I summarizes the different parameters and their
classes, and the various ratings assigned to these classes.
Indeed, the different classes and grades assigned to them
were determined by referring to the work of [13] one hand, on the assessment of the vulnerability of surface waters and
on the other hand on the author’s appreciation of this study. However, the parameter "Rain efficient" used by these authors was replaced by the by the runoff in this study according to our assessment of the parameters used.
Table I: Parameters, classes and ratings of the various parameters
3.2.2. Prioritization and weighting parameters
3.2.2.1.Prioritization and development of the square matrix
In this study, the method developed by [18], used by [19] and [20] has been exploited. It is a method of pear wise comparison by the Analytic Hierarchy Process (Analytical Hierarchy Process: AHP). This is to compare the relative importance of all the parameters used taken in pairs to set up a reciprocal square matrix. This comparison is based on a numerical scale of 9 steps [18], pair wise comparisons. When two parameters have the same importance in the studied phenomenon, the scale of Saaty gives these two parameters the value"1". However, if a parameter is more
IJSER © 2013 http://www.ijser.org
International Journal of Scientific & Engineering Research, Volume 4, Issue 4, April-2013 1315
ISSN 2229-5518
important than the other then it takes a higher value between 1 and 10 and the other the inverse of this value. This method allows the production of standardized weights whose sum is equal to"1". Matrix resulting from the pair wise comparison of parameters summarized in table II.
Table II: Matrix after comparing various parameters
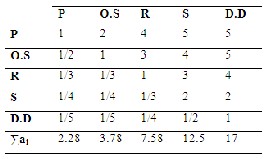
(original matrix)
This square matrix after prioritization will allow for combinations for determination of weight. The letters are an abbreviation used different parameters (each parameter above), with the sum Σai parameters by column.
3.2.2.2. Determination of different weights
The weight of an element expresses the size there of relative to one another [18]. It corresponds to the intensity of its impact on the study of the vulnerability of water resources. Determination of these weight amounts to calculating the weighting coefficient for each item. This coefficient is calculated from the following formula:
Cp= Vp/∑Vp (1)
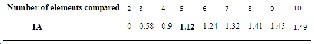
-if RC> 10% then the matrix is inconsistent and should be revise Le calculating λmax will be explained below. In addition, the indexes values are random data based on the number of parameters compared and are shown in Table III. In this work, the number of parameters is 5, as a result, the Index random used is 1.12 (Table III).
Table III: Random indices bases on the number of elements compared [18]
These steps are used to determine the weighting of the various parameters:
-Normalize the matrix by dividing each element in a column (I) by the sum of this column (Σai). We obtain the new values normalized matrix denoted by [bi]: [bi]=  (5)
(5)
The sum of [bi] is denoted by line: [Bi].
-Identify priorities line is to calculate the average of each row: [Mi]
[Mi] =  (6)
(6)
- Multiply each value (I) of the original matrix by its corresponding priority vector to determine the overall
priority line [Gi]:
[Gi]= 
Vp is the proper vector of each compared element. It is calculated as following:
Vp =  (2)
(2)
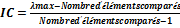
Before the determination of different weights, it is verified that the base matrix prepared (table II) is coherent. We will calculate the ratio of coherence (RC) which serves as a reference for judging the consistency of the matrix. Logical coherence or consistency ratio (CR), compared to
10% can judge the consistency of the matrix [18]. It is calculated as the ratio of the consistency index (CI) and the Random Index (AI). The formula is as follows:
RC= IC/IA (3)
 (4)
(4)
CI is the consistency index, AI Index random and λmax the maximum Eigen value.
-if RC ≤ 10, then the matrix is called coherent
(7)
-Report to the global priority of each priority for each line.
The values obtained are denoted Ei:
. Ei =  (8)
(8)
- Determine the maximum Eigen value of the elements
being compared (λmax)
λmax=  (9)
(9)
- Calculating the coherence index(IC):
IC = (10)
(10)
- Determination to Ratio of Coherence (RC) :
RC =  (11)
(11)
Table IV summarizes the results obtained in the subsequent
calculations. The ratio of coherence is obtained lower than
10% (Rc =4.46%).Therefore judgments awarded are good
Table IV: containing the results of various calculations above
IJSER © 2013 http://www.ijser.org
International Journal of Scientific & Engineering Research, Volume 4, Issue 4, April-2013 1316
ISSN 2229-5518
3.2.3. Using GIS for delineating protection perimeters
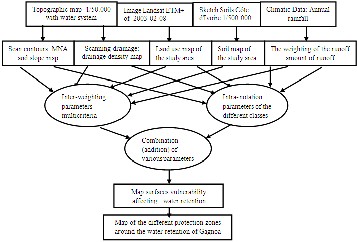
Following the hierarchy leading to intra-criterion weighting and allocation to different classes of notes determined, different parameters were incorporated into a GIS to derive the different scopes of protection. The method chosen for the layering approach, is the operational unique synthesis criterion of Roy [21], cited by [5]. It consists of adding the different layers of different parameters. The addition of layers is done through the software ArcGis 9.3. Fig.6 reflects the conceptual data model that allows the determination in the first instance vulnerability areas whose boundary intervals were fixed are based on the work of [22], and then the protection perimeters of retaining Gagnoa.
Fig 6: Flow diagram for the preparation of the map perimeter protection
4. RESULTS
The first result is a map of vulnerability to pollution in the reservoir. This map shows 5 classes of vulnerability ranging from "very low" to "very high" and include the values of the following indices:
- Index<1.64: vulnerability "Very low";
- 1.64<Index <2.00: vulnerability "Low";
- 2.00<Index <2.30: vulnerability "Medium";
- 2.30<Index <2.70: vulnerability "high";
- Index >270: vulnerability "Very High".
The figure 7 shows the result of this classification map.
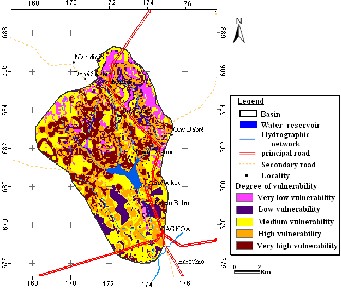
Fig.7. Vulnerability Map of Gagnoa’s retention water
This map shows the levels of vulnerability to pollution of the water reservoir supply of the city of Gagnoa and its surroundings.
- Class "Very low" characterized by very low slopes and
cultivated sun forest. Runoff in these areas to the reservoir
is negligible;
- Class "Low" represented by areas mostly inhabited but where the same degraded forest is still present;
- Class "Medium" takes into account the areas inhabited, cultivated, slope more or less low and moderately low drainage density;
- Classes "Strong and Very Strong" cover the area around
the reservoir surfaces especially upstream. These surfaces act strongly on the vulnerability of retention correspond to areas of steep, so a high activity of runoff. The forest is virtually nonexistent. These are areas with high agricultural activities sometimes using fertilizers for soil amendment or used directly on crops.
These different classes of vulnerability retention obtained as
a result of the pollution of the little basin of Gagnoa are the
combination of several natural parameters but also anthropogenic (dumps, agricultural practices, drainage
water does not comply worn etc.).
Taking into account these different classes of vulnerability,
map different protection zones shown in fig. 8 was made. It
has identified three areas of protection. Protection zone I,
protection zone II and protection zone III.
IJSER © 2013 http://www.ijser.org
International Journal of Scientific & Engineering Research, Volume 4, Issue 4, April-2013 1317
ISSN 2229-5518
Fig.8. Protection zone of Gagnoa’s retention water
Protection zone I or immediate perimeter protection (IPP) It was limited to a radius of 100 m around the reservoir, because the surface of the reservoir is a small radius that can enable effective intervention. In addition, this area takes into account the immediate area of the reservoir which has a great influence on the vulnerability of restraint and should allow effective protection against pollution retaining said point.
This value has been advocated by several authors including [5]. And according [10], the size of this area should allow intervene properly in case of accidents related to the pollution of the reservoir.
Zone II protection or close protection perimeter (PPR)
Also called buffer zone, it has been defined by taking into
account first the direction of flow of water in the basin and
areas with very strong influence on the vulnerability of retention. Its size is limited to a distance of 1 Km maximum to the retention. At this distance, it is possible that dissolved pollution facing the retention can be caught or trapped in the favor of the presence of suitable vegetation. Garouani and Merzouk [19], rely more on the degree of slope to give the limits of this zone. However, they are not going beyond 1 Km. According to them, the zone II is bounded on lands bordering with a slope greater than 3 degrees, but the extent of this band does not exceed one kilometer wide. This opinion is also shared by [23]. These authors advocate an area between 100 m and 1km. This area was obtained by superimposing a surface of 1Km of radius with strong influences vulnerability on the retention.
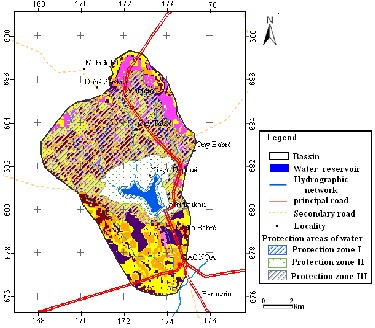
Protection zone III or perimeter protection remote(PPE) Some authors [23], it corresponds to a complementary regional zone. In this case, it covers substantially the entire surface of the tank located upstream of the reservoir. These surfaces have an impact on the vulnerability of retention. On the vulnerability map they correspond to areas of medium vulnerability to strong, although far from retention. These are mainly inhabited areas, where large plantations of coffee, cocoa, and rubber. That is why this area can be extended to the whole basin.
After delineation of protection zones, easements are
formulated for each area for the regulation of different activities. These schemes have a role to participate in the preservation of the quality of the resource and in turn the health of populations.
Although different protection zones have been established
at the end of this study, it is however to identify some difficulties. The subjectivity of weight and assigned to coastal settings in the application of multicriteria analysis is a limiting parameter. Similarly, the values of the parameters sometimes tend to overestimate or underestimate the degree of vulnerability of retention. This step can sometimes be made difficult when the knowledge is reduced and the subjectivity that implies. Also, the use of GIS for the determination of protection zones of surface water although apparently easier and less expensive, is more or less a theme that requires new knowledge in the field of GIS. However, the results obtained correspond to the reality on the ground. Garouani and Abdelaziz [5] used the same method to delineate protection zones around the dam Hachef Morocco and in fact led to the same conclusion. Therefore, the protection areas established are reliable and can be used for planning.
CONCLUSION
At the end of this work, the main objective is the delineation of protection zones around water retention Gagnoa whose quality is constantly tested by the various potential sources of pollution has been achieved. These schemes were established after assessing the vulnerability of the retention through the completion of a vulnerability map. Indeed, the method used is the coupling of multicriteria analysis which allowed the assignment of weights and coastlines parameters and GIS allowing their superposition. The resulting vulnerability map shows 5 classes of vulnerability: classes "very low", "low", "medium", "high" and "very high". The last two are the most represented on the map and correspond mainly to areas of high cultural activity. The map has three protected areas zones around the reservoir. It is the perimeter of immediate protection, close perimeter protection (PPR) and the scope of protection (PPE). Easements are available in all of these areas and proper compliance with these requirements will restore the quality of surface water resources. This study is therefore encouraging in the context of the use of GIS for
IJSER © 2013 http://www.ijser.org
International Journal of Scientific & Engineering Research, Volume 4, Issue 4, April-2013 1318
ISSN 2229-5518
the management of water resources in general and in particular the protection of surface water intended for drinking water supply.
REFERENCES
[1] Anonymous, 1998. Water and Sustainable Development: International Conference Bet, 112p (in French).
[2] François C., 2000. Spatial approach to chronic pollution of surface waters by pesticides: the case of atrazine in the watershed Sousson (Gers, France). phD. the Joint Research Unit Cemagref-ENGREF "Space Structures and Systems", Montpellier. 255P.
[3] Jourda J. P., 2005.Methodology of application of remote sensing techniques and geographical information systems to the study of fractured aquifers of West Africa. Concept of hydrotechnical space: the case of test areas of Côte d'Ivoire (in French). phD, University of Felix Houphouet Boigny, Abidjan
430 p.
[4] Anonymous, 2001. Protection of surface water in takes which strategies? Study of French water agencies No.75, document 60p.
[5] Garouni A., and Merzouk A., 2006. Demarcation of the protection zones around Hachef dam (Morocco) by remote sensing and GIS (in French), Journal of Water Science, 19, 4-10.Geology map.
[6] Tchatat G.,2002. Climate change and depletion of water resources in
arid sub-Saharan Africa: Analysis of economic impact in the case of water sheds and Bandama Sassandra in Côte d'Ivoire and the Lake Chad Basin in Cameroon (in French). PhD, University of Nandji Abrogoua, Abidjan 223p.
[7] Tagini B. (1971): Structural sketch of Côte d'Ivoire. Regional geotectonic test. Mem. XX-SODEMI Abidjan, 302p.
[8] Geological map of CI. (1995). Gagnoa sheet of 1/200000. Ministry of
Mines and Energy, Department of Mines and Geology CI.
[9] Wyns R., Gourry JC., Lebert F. and Baltassat J.-M., 1999. Characterization multiparameter subsufaces horizons (0-100 m) in the context of altered base. 2nd Symposium GEOFCAN BRGM Orléans France UMPCIRD1999.pp. 105-110.
[10] Carre J.,2005. Protection of surface water intakes for drinking water supply(in French).TSMNo. 4, pp. 27-34.
[11] ONEP-GTZ, 1995. Study to the request for the installation of
protection areas for the dam Sidi Mohamed Ben Abdellahin the Oued Bouregreg. National drinking water and Gesellschaft fur Technische Zusammenarbeit, National Drinking Water Morocco, Scientific Report, 175 p. [12] Garouani A., Jabrane R., Merzouk A., 1999. Test methodology exploiting spatial images in a GIS for the protection of surface water resources in Morocco. Scientific Days AUPELF-UREF, Francophonie in Remote Sensing, 22-
25 November 1999 Lausanne, Switzerland.
13] Schoen R., Codvelle A., and Ricard J., 2001. Mapping the hazard of pollution of surface and groundwater by plant substances in the Midi- Pyrenees.(in French). Manual 46p.BRGM /RP -51456- FR.
[14] CheryJ.P.,2005. Principles of current land use, 21 p.
[15] Macary F., Balestrat M., Puech C., Saudubray F., 2007.Method to evaluate the spatial contamination potential due to agriculture of surface water at different space scaling. Application on the “Coteaux de Gascogne” (in French), Proceedings of SAGEO 2007, International Symposium of Geomatics and Spatial Analysis, Clermont-Ferrand, June 2007, 20p.
[16] Perraud A. et Pierre de la Souchère, 1970.Sketch map of the soil de la
CI at 1/500.000.
[17] Eba L., 2008. Status and trends of sanitation waste water and waste water impact on the population of Marcory (in French). MSc at the University of
Felix houphouet Boigny Abidjan, 65p.
[18] Saaty T. L., 1977. A scaling method for priorities in hierarchical structures. J. Math. Psychology, 15, PP. 234-281.
[19] El Morjani Z., 2002. Design of a system of spatially referenced information for environmental management; application to these lection of potential sites for storage of household and industrial was tein semi-arid region(Sousse, Morocco) (in French).PhD thesis, University of Geneva, Earth and EnvironmentVol.42,300 p.
[20] Kouamé K.J., 2007. Contribution to the Integrated Management of Water Resources (IWRM) of the District of Abidjan (South of Côte d'Ivoire): Tools for decision support for the prevention and protection of groundwater against pollution (in French), PhD thesis, University of Felix Houphouet Boigny, Abidjan, 222p.
[21] Roy B., 1985. Multicriteria Methodology for Decision Support (in
French), Economica, Paris, XXII 423p.
[22] MAPAQ (1995): Ministry of Agriculture, Fisheries and Food of Quebec. Application guide. Project Review Quebec distribution of imported bottled water. 29 p. Quebec Centre for Food Inspection and Animal Health
[23] MEEB. (2010):Ministry of Energyand Water of Benin. Methodological guide for use by municipalities.
[24] Achidi J. B., Houngbedji N., Sintondji L.O., Vilmus T., 2010. Establishment of a protection system of the catchment areas of drinking water. Methodological guide for use by municipalities of the Republic of Benin (in French), Ministry of Energy and Water, Benin.30p.
[25] Anani A. T., 2006, Evaluation and mapping of areas susceptible to groundwater pollution from Continental Terminal at the Abidjan district (South of Côte d'Ivoire), by DRASTIC and GOD methods (in French), MSc thesis, University of Abidjan.
[26] Anoh K.A., 2009. Vulnerability assessment specific to agricultural inputs of groundwater in the region Bonoua (in French), MSc Thesis, University of Cocody, Cote d’Ivoire.
[26] Anonymous,2004.Handbookof protection perimeters of drinking
water catchments SMDRA/ Contract River Gave de Pau.Document15p.
[28] Bézèlgues S., Des Garets E., Mardhel V., Dörfliger N., 2002.Mapping of groundwater vulnerability of Grande-Terre and Marie-Galante (Guadeloupe). Phase 1: Methodology for determining the vulnerability (in French), Report BRGM 51783, 45 p.
[29] Biemi J., Loroux B.F., 2000.Impacts of major development projects on the environment in Côte d'Ivoire, Preliminary Environmental Impact Assessment (in French), Research report, JICA- High Commission for Waterworks, Abidjan, Cote d’Ivoire.
[30] Eric C., Jean-Marie D. and Andre P., 1996. GIS and regional delimitation areas at risk of landslides, sector hull-gatineau, Quebec. The Canadian Geographer / The Canadian Geographer 40, No. 4 (1996) 376-86. 20p (in French).
[31] Fiquet M., 1997. Catchment protection area for the water supply of Martinique: elements for their definitions (in French), Report BRGM 39731, 96p. [32]Goman M., 2006. Spatio-temporal evolution of physico-chemical characteristics of water from SODECI Gagnoa retention (in French), MSc Thesis, University of Nandji Abrogoua, Abidjan, 57p.
[33] Carre J., Marjolet G., Burlot T., Rambert B., 1997. Protection of surface water in takes for drinking water supply: the example of Breton (inFrench) TSM No.3, pp.42-48.
[34] Jourda J. P., Kouamé K. J., Saley M. B. Kouamé K. F., Kouadio. B. H. and Kouamé K., 2005. A new cartographic approach to determine the groundwater vulnerability of the Abidjan Aquifer Groundwater pollution in Afrca review, pp. 293–302.
[35] Kouassi K.L., 2007. Hydrology, sediment transport and modeling of
IJSER © 2013 http://www.ijser.org
International Journal of Scientific & Engineering Research, Volume 4, Issue 4, April-2013 1319
ISSN 2229-5518
sedimentation in lakes of hydroelectric dams in Côte d'Ivoire: The Case of Lake Taabo (in French), PhD Thesis, University of Nandji Agrogoua, Abidjan, Côte d’Ivoire.
[36] Lallemand-Barres A., Roux J.C., 1989.Methodological guide for establishing protective perimeters of groundwater wells for human consumption. Collection: Textbooks and Methods (in French), BRGM, Orleans. [37] Marchal J.P., 2007. Water intended for human consumption. Guide for the Protection of public catchments (in French), Report final BRGM 55699,
155p.
[38] ParadisD.,2000. Comparison of methods for determining he perimeters of protection works capture ground water in aquifers granular Laurentianfoothills (in French). Memory Master, INRS-Géoressources ISSUE,
142p.
[39] Rasmussen H .and Roll A., 2003. Guide for determination of feeding and protection of ground water abstraction (in French).Centre for the Study of Mineral Resources, University of Quebec at Chicoutimi; contract from the Ministry of Environment of Quebec, 182p
[40] Saley M. B., 2003. Information System spatial reference discontinuities pseudo-images and thematic maps of water resources inthesemi-mountainous region of Man (western Côte d'Ivoire)(in French).PhD thesis, University of Cocody,209 p.
[41] Water Code of the Republic of Côte d'Ivoire, 1998. Law n°98-755of
23th December 1998 Carrying Water Code. (in French) Republic of Côte d'Ivoire., 68p
IJSER © 2013 http://www.ijser.org
International Journal of Scientific & Engineering Research, Volume 4, Issue 4, April-2013
ISSN 2229-5518
1320
IJSER © 2013
http://www .llser. org