International Journal of Scientific & Engineering Research, Volume 4, Issue 12, December-2013 940
ISSN 2229-5518
Data mining using RFM Analysis
Divya D. Nimbalkar, Asst Prof. Paulami Shah
Abstract— The competitive world of today demands for having good marketing policies to attract the customers as well as retain the old customers .Organizations hence use strategies that would give the best customer satisfaction and which will return all their investments in their products with profit . It therefore becomes necessary to classify different segments of customers so that one can provide them with a personalized service . This paper serves this purpose of managing customer relationship by performing customer segmentation using RFM analysis then performing clustering on the values obtained from this analysis and then classification to get the applicable rules for each customer segment obtained after clustering.
Index Terms— association rule mining,clustering, classification, customer relationship management, customer value, FAPH ,K-means
Algorithm , RFM model , Rough Set Theory , TOPSIS .
—————————— ——————————
The large amount of information present in organizations if used correctly can help generating important patterns and trends. These patterns provide useful insights of customer buy- ing patterns.
But since this data is very complex it becomes even more dif- ficult to know the customer needs, improve their satisfaction and further lead to their retention. Customer relationship man-
tics of customers using fewer criterions as cluster attributes so as to reduce the complexity of the model.
RFM analytical model differentiates important customers from large database by three variables as interval of cus- tomer consumption, frequency and the amount. The RFM model hence considers Recency, Frequency and Monetary
IJSER
agement deals with this recognition and retention of potential
customers.
The techniques of customer value analysis give details of on- ly the future buying patterns of customer from their past pur- chasing records. But to know the customers value in future a new technique of RFM analysis is used . This techniques uses the three parameters of recency , frequency and monetary value to get the customer loyalty value which is further used in the clustering phase to cluster similar customers and finally devel- op rules for clusters generated in the previous step. The details of the terms customer relationship management, customer val- ue analysis, RFM analysis are as follows:
CRM is devoted to improve relationship with customers, it focuses on how to integrate customer value , requirements , expectations and behaviors by analyzing data from cus- tomer transactions .CRM is hence the manner in which both existing and new customers are retained in the organiza- tion. Enterprises apply some methods to effectively en- hance customer relationships which include customer rela- tionship management, customer value analysis , enterprise strategy and positive service mechanisms . An effective CRM is the one that has this capability of having both new and retaining old customers.
Customer value analysis is a kind of analytical tool which identifies customer future buying patterns from the existing patterns in large databases. The enterprises apply these methods to know the target customers whose contribution is outstanding. The RFM model is one of the well known customer value analysis method which extracts characteris-
value as the three criteria for getting loyalty value of cus-
tomers. The detailed definition is as follows:
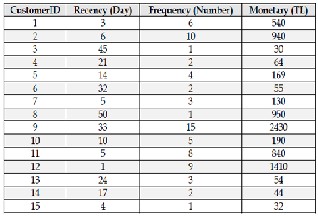
The Table.1 below shows a dataset of customer transactions that are analyzed using RFM analysis with values them be- ing initially in days , number and amount respectively [4 ].
TABLE 1
AN EXAMPLE OF DATASET : CUSTOMER TRANSACTION [4]
IJSER © 2013 http://www.ijser.org
International Journal of Scientific & Engineering Research, Volume 4, Issue 12, December-2013 941
ISSN 2229-5518
In the RFM analysis customer segmentation is done by first sorting customers based on their Recency value that is the most recent will be at the top ,then with the Frequency val- ue with the most frequent at the top and finally the mone- tary valu with the highest monetary value at the top . The customers are therefore split into five quintiles with the top
20% having the score 5 the next 20% having score 4 and so on. The process is repeated for all the three criterias and fi- nally the values are merged to get every individual cus- tomers rank . The Table 2 given below depicts the custom- ers are assigned to different quintiles and how their values can be merged to get customer values [4].
TABLE 2
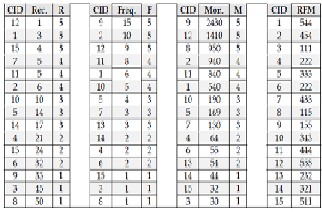
CUSTOMER QUINTILES AND RFM VALUES OF CUSTOMERS [4]
Clustering is the process of grouping similar objects.There
Approach 1 : It is carried out using following steps [1][3[4]:
- Arrange the three attributes in either ascending or de-
scending order
- Club the RFM attributes into 5 equal parts where each
part is equal to 20% of all. The score 5 is assigned to
most contributing one then 4 to next highest contrib-
uting one and so on till 1 as shown in Table 2.
- This process is repeated with all three criterias RFM to
get the final RFM score.
Approach2 [2][6]: Weighted RFM is used in recent techniques where rather than assigning equal weights to all R,F and M val- ues of 1:1:1 different weights are assigned to them. This is useful in situations where the organizations focus more on one param- eter over the other.This is generally a problem of multiple crite- ria decision making ie. to decide among multiple options and is solved using Fuzzy analytical hierarchical pro- cessing(FAPH).This process gets you the weights of criterias R,F and M which are multiplies to their respective values to finally get the customer loyalty value.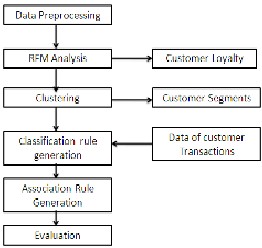
ER
we use various clustering methods like partitioning, hierar-
chical clustering , density based , grid based etc . The main
motive of clustering here is to group together customers
with similar buying patterns than those who are different
from them . The resulting clusters should have minimum
dissimilarity within the cluster and maximum dissimilarity
with other clusters.
Classification algorithms are used to derive rules from the clustered results obtained in the clustering phase . The rules are useful for identifying each and every customer from his buying patterns.There are various techniques for classifica- tion like decision tree technique , neural network etc.
The entire process of RFM Analysis is depicted in fig 1 . The Sections below describe them in detail.
In this step the data is preprocessed to remove missing , in- correct values , normalization , discretization of attribute values are also done here then removal of unwanted attrib- utes , concept hierarchy generation like converting city val- ue to state is done here in [1][2][3][4].
Fig.1 Basic Steps in Datamining using RFM Analysis
Clustering algorithm used different approaches are different techniques are as follows [1][3]:
Approach 1 : Here clustering of RFM values is done using
Kmeans algorithm. The algorithm is as follows :-
a) Partition the items into initial clusters randomly.
b) Now calculate the centroid of each cluster.
c) Compute the distance of each point from the centroids ob-
tained in previous step and reassign the item to the centroid
which is closest to it.
d) Repeat b) and c) steps till the cluster results obtained is the
same.
Approach 2 : The results from Kmeans algorithm is largely de-
IJSER © 2013 http://www.ijser.org
International Journal of Scientific & Engineering Research, Volume 4, Issue 12, December-2013 942
ISSN 2229-5518
pendent on the initial centre selection so the results are accurate only if the centre selection is correct. Kmeans++ suggests an improved way of selecting centres by calculating the initial cen- tres for the clusters [4]. It calculates initial centres by calculating their squared distance from the closest centre already chosen. Therefore one cen get consistent result using it.
Approach 3 : Rather than going for centroid selection directly one’s result will be more accurate if one can know how many clusters are actually formed after clustering is actually done and then perform kmeans to actually get the clusters [3] . It will be helpful in removing outliers if any from the clusters . So a two step way for clustering ie by performing Hierarchical Agglom- erative Clustering first to determine the optimal number of clus- ters and then apllying Kmeans algorithm will give better results
.
Approach 1 : The rules of classification are discovered by using the clustering results obtained in the previous step. In one approach it is carried out using C4.5 decision tree algorithm where in entropy and gain of each attribute is calculated and the one with the highest gain becomes the root node and the others become its child [4]. The process is repeated till the time all at-
tributes value pairs have been considered and leaf nodes are
Association rules are generated by using Frequent pattern tree or by using Apriori algorithm by setting some support and checking if a particular pattern is appearing equal to or more than that value if yes then its saved as an association rule .
It is generally carried out by comparing accuracy of results from different classification techniques like Naive Bayes , Decision tree, Neural Network etc on the same set of data. Also one can use different number of classes on the output to see if the accuracy varies by how much amount in case of clustering by using Kmeans.
Some other techniques propose use of n fold cross valida- tion technique to evaluate the results of classification and criteria called Lift & Loevinger to evaluate the association rules accuracy.
TABLE 4
INFERENCES OBTAINED FROM THE STUDY
reached.
IJSER
Approach 2 : It just uses another variation of decision tree ie. C5
algorithm to determine the classification rules[3] . The rules
returned have great use of demographic variables like
age,gender etc like c4.5 algorithm to get the final rules.
Approach 3 : Since decision trees have large number of instanc- es to be handled it becomes difficult to build and achieve the desired accuracy. So another technique of generating rules is proposed by using LEM2 algorithm [1] to classify data with vague and imprecise values. It can handle data of the form –
TABLE 3
SAMPLE RESULT AFTER CLUSTERING
Cid | Recency | Frequency | Monetary | loyalty |
10 | High | Very High | High | High |
11 | Low | Very High | Medium | Medium |
12 | Very Low | Very High | Low | Low |
13 | Very Low | Very High | Low | VeryLow |
As shown in Table 3. above Cid 12 and 13 have the same values for RFM but their loyalty values are different LEM2 has the ca- pability to handle such values unlike decision tree which cannot handle those.
Approach 4 : In weighted RFM there is a step to rank each clus- ter obtained after clustering to know and decide the strategic plan for each cluster.One of the proposed techniques in paper [2] is TOPSIS ie. Technique Of Order Preference by Similarity To Ideal Solution .
The Table 4.above depicts the inferences obtained from var- ious approaches studied in RFM Analysis . Here each indi- vidual row represents the criteria on which the techniques are compared and the columns heads give the names of the
IJSER © 2013 http://www.ijser.org
International Journal of Scientific & Engineering Research, Volume 4, Issue 12, December-2013 943
ISSN 2229-5518
different papers suggesting the different strategies.
The preferred spelling of the word “acknowledgment” in American English is without an “e” after the “g.” Use the sin- gular heading even if you have many acknowledgments. Avoid expressions such as “One of us (S.B.A.) would like to thank ... .” Instead, write “F. A. Author thanks ... .” Sponsor and financial support acknowledgments are included in the acknowledgment section. For example: This work was sup- ported in part by the US Department of Commerce under Grant BS123456 (sponsor and financial support acknowledg- ment goes here). Researchers that contributed information or assistance to the article should also be acknowledged in this section.
Computer Science and Information Engineering, National Changhua
University of Education, Changhua, Taiwan 500, R.O.C.,2010.
[6] Babak Daneshvar Rouvendegh, Turan Erman Erkan , “Selection of aca- demic Staff using fuzzy analytical processing: FAPH pilot study”,Technical Gazette 19, 4(2012),923-929.
Book referred -
[7] Data Mining: Concepts and Techniques , Second Edition , Jiawei Han
University of Illinois at Urbana-Champaign Micheline Kamber .
[8] Tutorial referred –Dr. Rainer Haas Dr. Oliver Meixner Institute of Market- ing & Innovation University of Natural Resources and Applied Life Sci- ences, V ienna, ‘An Illustrated Guide to the Analytical Hierarchical Pro- cess’ , University of Natural Resources and Applied Life Sciences, Vienna http://www.boku.ac.at/mi
The use of RFM analysis helps improving customer relation- ship even better than by directly going for data mining since it incorporates customer demographic variables as well in get- ting the results . The use of Weighted RFM gives a further en- hancement to the technique of RFM analysis by providing or- ganizations to decide their own priority of one factor over the other . Thus in the competing world of today RFM analysis helps organizations to better attain their goals of profit and customer relationship.
[1] Ching-Hsue Cheng, You-Shyang Chen,”Classifying the segmentation of customer value via RFM model and RS theory”, Expert Systems with Ap- plications 36 (2009) 4176–4184, Department of Information Manage- ment, National Yunlin University of Science and Technology, 123, Section
3, University Road, Touliu, Yunlin 640, Taiwan,2009 .
[2] Amir Hossein Azadnia, Pezhman Ghadimi, Mohammad Molani- Aghdam,
‘”A Hybrid Model of Data Mining and MCDM Methods for Estimating Cus- tomer Lifetime Value” , Proceedings of the 41st International Conference on Computers & Industrial Engineering, Department of Engineering, Ayatollah Amoli branch, Islamic Azad University, Amol, Iran ,Department of Manufacturing & Industrial Engineering, Universiti Teknologi Malay- sia, Skudai, Malaysia .
[3] Razieh qiasi, Malihe baqeri-Dehnavi, Behrooz Minaei-Bidgoli, Golriz
Amooee , “Developing a model for measuring customer’s loyalty and val- ue with RFM technique and clustering algorithms” , The Journal of Mathematics and Computer Science Vol. 4 No.2 (2012) 172 – 181 , De- partment of Information Technology, University of Qom, Qom, Iran, ra- ziehghiasi@gmail.com, Department of Information Technology, Universi- ty of Qom, Qom, Iran, Programming_bagheri@yahoo.com, Department of Computer Engineering, University of Science and Technology, Tehran, Iran, minaeibi@cse.mcu.ed, Department of Information Technology, Uni- versity of Qom, Qom, Iran, 2012 .
[4] Derya Birant , “Data minig using RFM analysis” , Knowledge-Oriented
Applications in Data Mining InTech , University Campus STeP Ri Slavka
Krautzeka 83/A51000 Rijeka, Croatia ,2011 .
[5] Ming-Yi Shih, Jar-Wen Jheng and Lien-Fu Lai, “A Two-Step Method for Clustering Mixed categroical and Numeric Data”, Tamkang Journal of Sci- ence and Engineering, Vol. 13, No. 1, pp. 11_19 (2010), Department of
IJSER © 2013
————————————————
• Divya D. Nimbalkar is currently pursuing masters degree program in
Computerr Engineering inNMIMS University, India, PH-9975672424
• Asst Prof. Paulami Shah is currently teaching inComputer Engineering
Dept , MPSTME, NMIMS University, India, PH-9833968946. E-mail:paulami.shah@nmims.edu