International Journal of Scientific & Engineering Research, Volume 4, Issue 6, June-2013 2938
ISSN 2229-5518
DEVELOPING MATHEMATICAL MODEL TO DESCRIBE THE RELATIONSHIP BETWEEN SOME PROPERTIES AND FREQUENCY OF VIBRATION
BY
P.A.O ADEGBUYI
DEPARTMENT OF MECHANICAL ENGINEERING
&
N. HOUNKONNOU
INTERNATIONAL CENTRE OF MATHEMATICAL PHYSICS IN MATERIAL APPLICATIONS FACULTY OF SCIENCE AND TECHNOLOGY,UNIVERSITE DE ABOMEY –CALAVI COTONOU.REPUBLIC DU BENIN
hounkonnou@yahoo.fr
ABSTRACT
This study summarizes the research work on the effect of mechanical mold vibration during solidification, on some mechanical properties, like tensile strength, elongation, energy stored and hardness. Cylindrical castings were produced from Al-Si alloy in die molds and were subjected to different level of vibration . The vibrated and non vibrated samples were then subjected to tests to determine the above mentioned properties. Based on the values obtained a mathematical model was developed describing the relationship between the properties and frequency of vibration. The result indicates the presence of vibration has a major contribution in affecting the responses measured.
Key Words: Mathematical Model, Relationship, Frequency, Properties, Vibration
IJSER © 2013 http://www.ijser.org
International Journal of Scientific & Engineering Research, Volume 4, Issue 6, June-2013 2939
ISSN 2229-5518
INTRODUCTION
Aluminium-Silicon alloys are one of the most commonly used foundry alloys because they offer many
advantages such as good thermal conductivity,excellent castability,high strength to weight ratio,wear and corrosion resistance,etc. Therefore they are well suited to automotive cylinder heads,engine blocks,aircraft components etc. The mechanical properties of Auminium-Silicon alloys are related to the grain size and shape. Imposition of vibration on liquid metal during solidification has shown several advantages like grain
refinement, increased density, degassing,shrinkage and improvement of mechanical properties.Grain
structure of casting changes from columnar dendritic to equiaxed dendrites or globular. It has been observed that in order to get pronounced grain refinement, the solidifying melt should be kept under the influence of
vibration energy for reasonably long time
ranging from 1-5 minutes [1]. This can be done by choosing alloys with long freezing range or preheating the mold.
Different methods have been used to apply vibrations during solidification. Electromagnetic vibration is one of the non contact methods used to induce vibration in the solidifying metal [2]. Several other researchers have investigated the effect of vibration on the microstructure of castings [4-6]. The effects include grain refinement, fragmentation of the dendrite structure and degassing resulting in reduced porosity. Pandel et al [7] have
reported reduction in average size of silicon needles with increase in amplitude of vibration from 1- 3 mm, for hypoeutectic and hyper eutectoid Al-Si alloys. Burbure et al [8] have reported grain refinement in aluminum casting solidified under the influence of low frequency vibration of 50 Hz. The refinement was more pronounced with increase in casting size and at lower initial mold temperature. Abu-Dheir et al [9] have reported increase in percent elongation in the castings subjected to
vibration of 100 Hz and varying amplitude of
IJSER © 2013 http://www.ijser.org
International Journal of Scientific & Engineering Research, Volume 4, Issue 6, June-2013 2940
ISSN 2229-5518
18-199 micron. Also increase in amplitude has been reported to reduced interlamellar spacing between silicon needles. In another study,
Kadir Kocatepe [10] reported that the amount and size of pores were increased in Al-Si alloys with increasing frequencies. .
Thus, it is clear that vibration promotes changes in microstructure and consequently in mechanical properties.
The present work has been carried out to study
the effect of vibration during solidification on some mechanical properties and to also determine a mathematical model to predict same. This work was limited to a range of frequencies of between 1hz-10hz.
METHODOLOGY

The nth degree polynomial equation is generally expressed as;
(1) Where  are polynomial coefficients.
The values of the coefficients could be obtained by
substituting the boundary conditions as obtained from the experiment.
EXPERIMENTAL PARAMETERS (as boundary
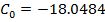
DEVELOPING TENSILE STRENGHT EQUATION
Let the tensile strength be  which is y on the curve and the frequency of vibration be
 which is x on the curve. Equation (1) could be adopted for a second degree polynomial as expressed in equation (2) to satisfy the three boundary conditions;

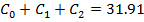
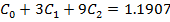
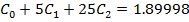
(2) Substituting the boundary conditions, At 
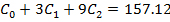
(3A) At 

(3B) At 
(3C)
conditions)
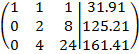
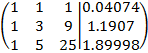
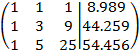
Equations 3A – 3C can be presented in matrix form as follows:
IJSER © 2013 http://www.ijser.org
International Journal of Scientific & Engineering Research, Volume 4, Issue 6, June-2013 2941
ISSN 2229-5518

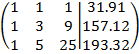 Thus
Thus
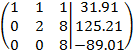
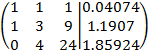
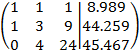
Keeping row 1 and row 2 and subtracting row 1  from row 3 to develop new row 3;

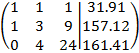
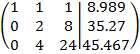
Keeping row 1 and row 3 and subtracting row 1 from row 2 to develop new row 2;
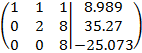
Keeping row 1 and row 2 and subtracting 2x(row 2)
from row 3 to develop new row 3;
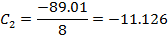
Considering row 3 this implies that;
8 C2 =-89.01 therefore,
Considering row 2 this implies that;
Hence the polynomial equation for the Tensile strength curve is expressed by substituting values of the coefficients into equation (2).

Note; in the curve 
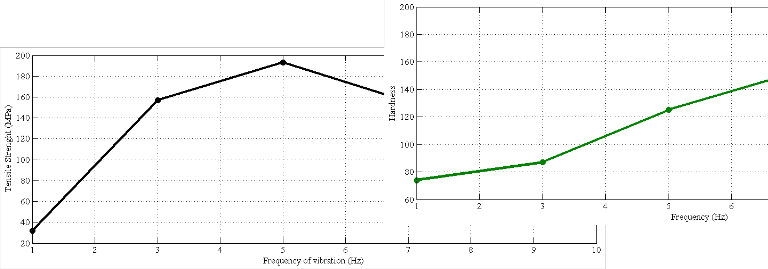
DEVELOPING ENERGY STORED EQUATION
Let the energy stored be E which is y on the curve and the frequency of vibration be which is x on the curve. Equation (1) could be adopted for a
second degree polynomial as expressed in equation
(2) to satisfy the three boundary conditions;

(4)

Substituting the boundary conditions, At
2 C1 + 8 C2=125.21
Substituting value of C2 and calculating for C1
C1= 107.109
Considering row 1
C0 + C1 + C2 =31.91
Substituting values of C2 and C1 and calculating C0
C0 = -64.073
(4A) At 

(4B) At
(4C)
IJSER © 2013 http://www.ijser.org
International Journal of Scientific & Engineering Research, Volume 4, Issue 6, June-2013 2942
ISSN 2229-5518
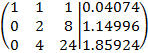
Equations 3A – 3C can be presented in matrix form as follows:
Keeping row 1 and row 2 and subtracting row 1 from row 3 to develop new row 3;
Keeping row 1 and row 3 and subtracting row 1 from row 2 to develop new row 2;
Keeping row 1 and row 2 and subtracting 2x(row 2)
from row 3 to develop new row 3;
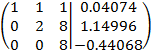
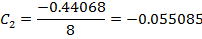
Considering row 3 this implies that;
8 C2 =-0.44068 therefore,
Considering row 2 this implies that;
2 C1 + 8 C2=1.14996
Substituting value of C2 and calculating for C1
C1= 0.79498
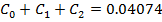
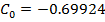
Considering row 1
C0 + C1 + C2 =0.04074
Substituting values of C2 and C1 and calculating C0
C0 = -0.69924
Thus


Hence the polynomial equation for the Tensile strength curve is expressed by substituting values of the coefficients into equation (2).

Note; in the curve 
DEVELOPING % elongation EQUATION
Let the %elongation be e which is y on the curve and the frequency of vibration be which is x on the curve. Equation (1) could be adopted for a
second degree polynomial as expressed in equation
(2) to satisfy the three boundary conditions;

(5)
Substituting the boundary conditions, At 

(5A) At
IJSER © 2013 http://www.ijser.org
International Journal of Scientific & Engineering Research, Volume 4, Issue 6, June-2013 2943
ISSN 2229-5518


(5B) At 
(5C)
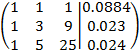
Equations 3A – 3C can be presented in matrix form as follows:
Keeping row 1 and row 2 and subtracting row 1 from row 3 to develop new row 3;
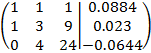
Keeping row 1 and row 3 and subtracting row 1 from row 2 to develop new row 2;
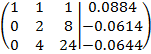
Keeping row 1 and row 2 and subtracting 2x(row 2)
from row 3 to develop new row 3;
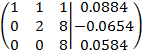
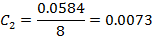
Considering row 3 this implies that;
8 C2 =0.0584 therefore,
Considering row 2 this implies that;
2 C1 + 8 C2=-0.0654
Substituting value of C2 and calculating for C1
C1= -0.0619
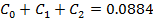
Considering row 1
C0 + C1 + C2 =0.0884
Substituting values of C2 and C1 and calculating C0
C0 = 0.143
Thus


Hence the polynomial equation for the Tensile strength curve is expressed by substituting values of the coefficients into equation (2).

Note; in the curve 
DEVELOPING HARDNESSEQUATION
Let the hardness be H which is y on the curve and the frequency of vibration be which is x on the curve. Equation (1) could be adopted for a second degree polynomial as expressed in equation (2) to satisfy the three boundary conditions;

(6)
Substituting the boundary conditions,
IJSER © 2013 http://www.ijser.org
International Journal of Scientific & Engineering Research, Volume 4, Issue 6, June-2013 2944
ISSN 2229-5518

At
At 


(6B) At
(6A)
Considering row 2 this implies that;
2 C1 + 8 C2=35.27
Substituting value of C2 and calculating for C1
C1= 30.1715
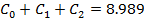
Considering row 1

(6C)
Equations 3A – 3C can be presented in matrix form as follows:
Keeping row 1 and row 2 and subtracting row 1 from row 3 to develop new row 3;
Keeping row 1 and row 3 and subtracting row 1 from row 2 to develop new row 2;
Keeping row 1 and row 2 and subtracting 2x(row 2)
from row 3 to develop new row 3;
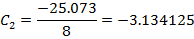
Considering row 3 this implies that;
8 C2 =-25.073 therefore,
C0 + C1 + C2 =8.989
Substituting values of C2 and C1 and calculating C0
C0 = -18.0484
Thus


Hence the polynomial equation for the Tensile strength curve is expressed by substituting values of the coefficients into equation (2).

Note; in the curve 
RELATIONSHIP BETWEEN PROPERTIES
In order to determine the relationship between properties and frequency, a mathematical function (curve fitting) that has the best fit to the series of data obtained anterior from experiment for determined range was constructed subject to constraints.
IJSER © 2013 http://www.ijser.org
International Journal of Scientific & Engineering Research, Volume 4, Issue 6, June-2013 2945
ISSN 2229-5518
Input data:
Frequency of vibration: f = [1; 3; 5; 7; 10] (Hz).
Tensile Strength: σ = [31.91; 157.12; 193.32;
155.19; 147.775].
Energy stored: E = [0.04074; 1.1907; 1.89998;
19.543; 13.50875].
Elongation: e = [0.20819 0.55825 0.57506 0.7416
0.633312].
Hardness: H = [74, 87, 125, 152, 185].
Programmatic Curve Fitting
The MATLAB programming software has a function that determines the polynomial function
of a curve.
IJSER © 2013 http://www.ijser.org
International Journal of Scientific & Engineering Research, Volume 4, Issue 6, June-2013 2946
ISSN 2229-5518

Poly f(x,y,n), function - finds the coefficients of a polynomial p(x) of degree n that fits the y data by minimizing the sum of the squares of the deviations of the data from the model (least- squares fit).
Poly Val(p,x) - returns the value of a polynomial of degree n that was determined by polyfit, evaluated at x.
After running the program the following equations were determined:
Tensile Strength
c = [1.1818 -24.0970 146.8439 -93.3420]
c = [-0.2084 3.3410 -12.1723 9.9422]

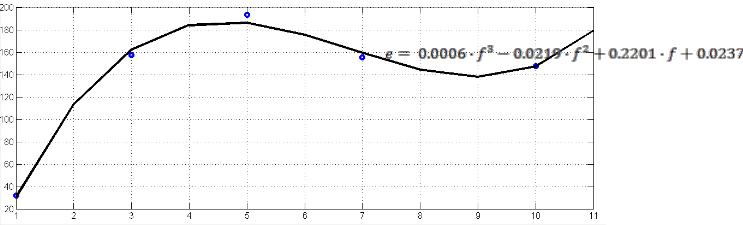
Elongation
c = [0.0006; -0.0219; 0.2201; 0.0237]
Energy stored
IJSER © 2013 http://www.ijser.org
International Journal of Scientific & Engineering Research, Volume 4, Issue 6, June-2013 2947
ISSN 2229-5518
CONCLUSION
Using the Gaussian elimination method mathematical models was determined for each of the four selected mechanical properties based on the values obtained from the experiment and this can be used to predict properties between 1hz- nhz.Futhermore using matlab software was used to determine the polynomial function for the prediction of the properties in the range of 1hz -
10HZ
References
[1].N.R Pillai. Effect of low frequency Mechanical vibration on structure of Modified Al- Si eutectic ,
Metallurgical Transaction, 3, 1972,
Hardness:
c = [-0.2375; 3.8967; -4.1188; 73.6854]
[2].V. Charles Effects of electromagnetic vibrations on the microstructure of continuously cast
Aluminum alloys,Material Science and
Engineering A, 173A, 1993,

[3].M. Yoshiki et al, Effect of the intensity and frequency of electromagnetic vibrations on the refinement of primary Si in Al -17% Si alloy,Materials Transactions, 45, No. 6, 2004.
[4]T.P Fisher., Effects of vibrational energy on the solidification of Aluminum
Alloy, British Foundrymen, 66, 1973,
[5]W.Rostoker, M.J Berger. Effects of Vibration during solidification of castings, Foundry, 81,
1953.
[6].X. Jian et al, Refinement of eutectic silicon phase of aluminumA356 alloy
using high-intensity ultrasonic vibration, Scripta
Materialia, 54, 2006..
IJSER © 2013 http://www.ijser.org
International Journal of Scientific & Engineering Research, Volume 4, Issue 6, June-2013 2948
ISSN 2229-5518
[7 ]K Kocatepe C.F Burdett. Effect of low frequency vibration on macro and micro structures of LM6
alloys, Journal of Material science, 35, 2000.
[8] P.Upender ,S. Ashok and D.BGoel. Study on the effect of vibrations during solidification on Cast Al-Si alloy Indian foundry Journal,
51(2), 2005.
[9].R.R Burbure et al, Influence of low freq vibrations on Al-eutectics,British Foundrymen,
72, 1979
[10] N. Abu-Dheir et al, Silicon morphology modification in the eutectic Al – Si alloy using mechanical
mold vibration, Material science and
Engineering A, 393A, 2005.
.
[11] K. Kocatepe, Effect of low frequency vibration on porosity of LM25 and LM6 alloys. Materials and
Design, 28, 2007.
.
[12].D. Benny Karunakar. G.L Datta., Controlling green sand mould properties using
artificial neural
networks and genetic algorithms- A
comparison, Applied clay Science, 37, 2007.
[13].M.B. Parappagoudar. et al, Forward and reverse mappings in green sand mould system using neural
networks, Applied soft computing, 8, 2008.
.
[14]D.C Montgomery. Design and Analysis of Experiments, 5th edn., John Wiley & sons (Asia) pte Ltd.,Singapore, 2007.
IJSER © 2013 http://www.ijser.org