Containercontainertainer
location
Truck from dis- patch station
Haul emp- ty contain-
Drive to next con- tainer
Truck to dispatch station
Haul
conditions.
International Journal of Scientific & Engineering Research, Volume 4, Issue 11, November-2013 12
ISSN 2229-5518
Conventional Open Truck and Hauled Container Systems of Waste Collection in Khulna City: A Comparative Analysis
Riyad, A.S.M., Rafizul, I.M., Kabir, M.M., Rasel, M. Chowdhury, Shahariar, M.S. and Ekhlas, U.M.
Abstract— Collection is one of the tires of municipal solid waste (MSW ) management; therefore, it’s proper planning and implementation can serve as a foundation for a sound waste management system. The two most common collection systems of Khulna city are open truck (OT) based collection and hauled container system (HCS). A study has been carried out for evaluating the collection system of MSW and comparing them. In contrary, time and motion survey, interview of municipal staff, conservancy officers, conservancy inspectors and drivers and truck crews were carried out as study methodologies. Results show that within the round trip haul distance of 20-35 km, OT can make at least 4 trips and HCS can make 3 trips per shift. The study also reveals that actual trips made and the trips for which fuel is allocated were not always being the same. Time ratio of traditional OT container collection for pickup, unloading and travelling was around 7, 4 and
83% of total trip time, respectively. For demountable container collection time ratio was 3, 3 and 85%, respectively. Result shows that capacity usages of vehicles were 82-93% and 79-87% for OT and HCS, respectively. Moreover, time efficiency ratings were found 38-41% and 39-43% for OT and HCS, respectively.
Index Terms— Waste collection, demountable container, efficiency indicators, time ratio, traditional open truck, travel distance, trip time.
—————————— ——————————
unicipal solid waste collection (MSWC) has about 85% proportion of the total cost for solid waste management system (Ludwig and Black 1968). The existing Capacity
for Solid Waste Management (SWM) of local government or- ganizations (city corporations, municipalities) cannot meet the service demand of citizens in Bangladesh. 'Capacity for Solid Waste Management’ ranges from individual skills to organiza- tional and institutional/societal capacities (Fukuda-Parr et al.
2002). Municipal corporations of the developing countries are not able to handle increasing quantities of waste and a signifi- cant portion of wastes are not properly stored, collected or disposed in the proper places for ultimate disposal due to lack of enthusiasm, consciousness, loyalty, as well as money (Ahsan et al. 2005). Several ethnic communities with different social backgrounds are living in the KCC area. There is a wide mix- ture diverse communities living in harmony in this city. It was revealed that the solid waste generation (amount and compo- sition) by different communities are significantly vary as a
————————————————
• Riyad, A.S.M., Undergraduate Student; Dept. of Civil Enineering, Khulna University of Engineering & Twchnology, Khulna-9203, Bangladesh, E- mail: riyadtowhid@yahoo.com
• Rafizul, I.M., Assistant Professor, Dept. of Civil Enineering, Khulna Uni- versity of Engineering & Twchnology, Khulna-9203, Bangladesh, E-mail: imrafizul@yahoo.com
• Kabir, M.M., Undergraduate Student; Dept. of Civil Enineering, Khulna
University of Engineering & Twchnology, Khulna-9203, Bangladesh, E-
mail: kmasharul@yahoo.com
• Rasel M. Chowdhury, Post-graduate Student; Dept. of Civil Enineering,
Khulna University of Engineering & Twchnology, Khulna-9203, Bangla- desh, E-mail: civilizedrasel073@yahoo.com.com
• Shahariar, M.S., Undergraduate Student; Dept. of Civil Enineering, Khulna University of Engineering & Twchnology, Khulna-9203, Bangladesh, E- mail: shaon.kuet09@gmail.com
• Ekhlas, U.M., Undergraduate Student; Dept. of Civil Enineering, Khulna
University of Engineering & Twchnology, Khulna-9203, Bangladesh, E-
mail: ekhlaskuet@yahoo.com
result of many factors: living conditions, cultural behaviors, income variations and even on people’s attitudes (Mahees et al.
2011). KCC vehicles collect wastes from SDSs and transfer it to UDS for disposal at Rajbandha, 10 km far from the city center. This is the only UDS in Khulna and open dumping is prac- ticed for ultimate disposal, as there is no con- trolled/engineered/sanitary landfill in Bangladesh (Alamgir et al. 2005).
More than 60 SDSs are available in city area from where KCC vehicles collect wastes and approximately 1200 commu- nity bins, located on roadsides throughout the city. The city authority places some haul containers (HCs) and permanent concrete/masonry bins in SDSs. KCC has 32 motorized and
266 non-motorized vehicles for waste collection and transpor- tation. Only motorized vehicles are used for collection of wastes from SDSs and then transfer to UDS. Non-motorized vehicles are uses for transfer wastes from community bins to SDSs. KCC have 20 demountable containers for collection of the waste. Most recent study shows that the waste generation rate is 0.3-0.4 kg/capita/day and total generated MSW is var- ied from 420-520 tons/day in KCC. However, the collection capacity of KCC vehicles is 240-260 tons/day, which is about
50-55% of the total generation (KCC 2005). The maximum cov- erage of waste collection was done by HCS and OT based sys- tem provided in Figures 1 and 2, respectively.
Collection system in which the containers used for the stor-
age of wastes are hauled to the processing, transfer, or dispos-
al site, emptied, and returned to either their original location
or some other location are defined as hauled-container system
(Peavy, et al. 1985). Traditional OT collection is typically used
in morning time for removing waste from street sweeping,
dustbins, extra waste beside containers, drain cleaning, con-
struction debris and garden trimmings. This collection sys-
tem also removes wastes being generated by shops and
restaurants.
IJSER © 2013 http://www.ijser.org
International Journal of Scientific & Engineering Research, Volume 4, Issue 11, November-2013 13
ISSN 2229-5518
Depos- Pick upit emp- loaded ty con-
Containercontainertainer
location
Truck from dis- patch station
Haul emp- ty contain-
Drive to next con- tainer
Truck to dispatch station
Haul
conditions.
Khulna City is located in the southwestern part of Bangladesh near the Sundarbans, the largest mangrove forest in the world. It is situated below the tropic of cancer, around intersection of latitude 22.49º North and longitude 89.34º east. The total area of Khulna city corporation (KCC) is about 47 sq. km compris- ing 31 wards (BBS 2001). This paper is based on primary data. The methods used for this study are a combination of observa- tion by transect walk in the study area, case studies and ques- tionnaire survey. Data were collected in and around different dumping sites of the study area along with other sources of waste generation. Observation was done by transect walk in
er to origi-
nal pickup
location
Transfer station, pro-
cessing station, or disposal
site (contents of container
emptied)
the study area to observe the sources of wastes, types of wastes and dumping sites of wastes and necessary notes were taken in the note book. Interview with related workers, staff and officials- before, after and at the time of time and mo- tion (T and M) survey. At the time of T and M survey crew behaviours were monitored to understand whether
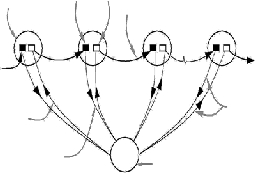
Figure 1: Schematic of operational sequence for Hauled Con- tainer System (Exchange mode) (Source: Peavy, et al., 1985)
Loads contents
improvement could be made. Several discussion meetings and interviews were organized among field level staff of study areas and officer of conservancy department to rationalize the results found from T and M survey. For traditional OT collec- tion, Ward 12, 23, 31 and for Demountable container collec-
Solid
waste
pickup
location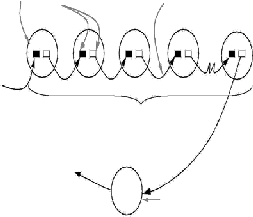
from contain- er(s) at pickup location into collection vehi- cle
Drive to next pickup location
tion, wards no. 1, 15, 20, 30 were selected shown in Figure 3.
Drive empty collection vehi- cle to beginning of next col- lection route or return to dis- patch station
Empty collec- tion vehicle from dispatch station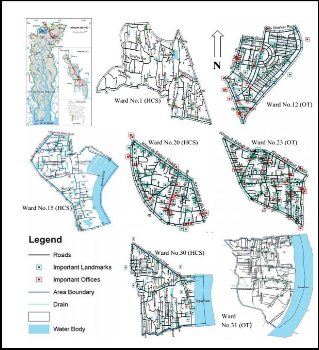
Drive loaded collection vehicle to disposal site
Transfer station, processing station, or disposal site (contents of con- tainer emptied)
Figure 2: Schematic of operational sequence for OT Collec-tion
System (Source: Peavy, et al., 1985).
This study focuses on the analysis of HCS and OT based col- lection systems. Comparison is made based on determination of various efficiency indicators. Merits and demerits of two sys- tems and system improvement options are identified and sug- gestions are made. Findings can be used for waste collection system planning and system improvement in almost similar
Figure 3: Location of the study area with collection system
IJSER © 2013 http://www.ijser.org
International Journal of Scientific & Engineering Research, Volume 4, Issue 11, November-2013 14
ISSN 2229-5518
Vehicle Collection Area Total Collection Time t1
TTn
Other efficiency indicators such as gross labor efficiency, net labor efficiency, net pickup time per station, need speed in collection area, speed of the vehicle and unloading time is measured as follows:
o Gross labor efficiency as Gross person x minute /load
Garage 1 Collection
Point
2nd Collection
Point
Last Collection
Point
Landfill site
= {(number of driver + number of collectors) x (total trip time)}/ load.
o Net labor efficiency = (Net person x minute) / load =
LT1
TT1
LT2 TTm LTn
t2
Garage
{number of driver x (total trip time – break time or any other time not related to collection and transpor- tation) + number of collectors x (pickup time+ un- loading time)} / load
o Net loading or pickup rate is measured as net collec-

Figure 4: Time fraction sketch for OT collection
The working efficiency of collection workers were calculated as how many workers spend how much time to load and carry per ton of waste and how much time was required for collect- ing and disposing per ton of waste. The loading efficiency of vehicles was calculated on the basis of percentage of vehicle's capacity. Wide varieties of efficiency parameters can be gener- ated from T and M survey which reflect not only the efficiency of the time, vehicle or crew but also give an idea of improve- ment measures. Percentage of time taken in different compo- nents of a collection cycle is calculated with respect to Total Trip Time (TTT). TTT is the total actually engaged working time in the full collection cycle. It is time from beginning from garage at the start of work and to the moment of arriving at garage after finishing the work. In this time several trips may be made. The following break up or time ratio can be made on the basis of total trip time provided in Figure 4.
o Total travel time, when vehicle is in travel (t1 + TT 1
+TTm + TTn + t2 )
o Net pickup time, it is the time required just to load the vehicle, (LT 1 +LT 2 + LTn)
o Total time spent in the collection area is the total time taken for waste collection only.
o Time efficiency rating (E) of collection workers is cal- culated as how much percentage of time labors were actually engaged in work with respect to the total as- signed working time. It is an index showing the effi- ciency of collection workers during the working hours.
E = 100% x {1(TTT-BT-RT- other time not actually en- gaged in work) + NP x (TTC + TTU)} / {(1+NP)} x PNWH = 100 % (∑actually engaged labor-hour)/ (∑assigned labor-hour)
Where, TTT = Total Trip Time, RT= Recycling Time, BT
= Break time, NP= Number of collectors except driv-
er, TTC = Total time of collection or pickup, TTU= To-
tal time of unloading.
o TTT = total travel time + total pickup/collection time
+ Break time + fuelling time + others, PNWH = Pre-
scribed number of working hours per shift.
tion time in minute/load in ton.
o Net pickup time per station per person is calculated net pickup time/ (total number collection stations or points x number of person).
o Gross speed in the total trip time is travel distance in full collection cycle per unit time as km/hr.
A summary of traditional OT system and demountable con- tainer collection system is depicted in the Table 1. Findings are based on T and M survey.
In addition, the open trucks working in KCC are usually assigned to make four trips unless special trip is assigned. In practical, it has found that open trucks usually make three trips unless additional trip with fuel (in addition to four trips) is allocated. However, for surveyed OT, the fuel was allocated for four trips. The surveyed container carrier was assigned to make 3 trips per shift and it was found to make 2 trips per shift. Open truck is found to be most useful and effective col- lection system but due to significant numbers of trips being lost (false trip) it can be regarded as inefficient collection sys- tem. The reason of over loading is intentional reduction of trips and save the fuel from allocated amount. Vehicles do not use weighbridge which is a barrier for system improvement- planning and difficult to understand accurate existing system capacity. Time efficiency ratings for open truck and hauled container collection systems were found 39.5%±1.5% and
41%±2%, respectively. It is calculated based on the ratio of actually engaged labor-hour to the officially assigned labor- hour. Ratio shows that labor productivity could be increased further. However, practically drivers and workers have to work more than officially assigned labor-hour for both collec- tion systems. It is an important reason of reducing labor productivity. Majority of time for full collection cycle of OT and HCS is consumed in travel time, around 86 and 84%, re- spectively. The % of time fraction and time efficiency rating illustrates in Figures 5-6, respectively.
Loading time per trip Unloading time per trip Travelling time per trip
IJSER © 2013 http://www.ijser.
100
90
80
70
60
OT Collection
International Journal of Scientific & Engineering Research, Volume 4, Issue 11, November-2013 15
ISSN 2229-5518
Figure 5(a): Time ratio of traditional OT collection
Figure 7: Waste Collection by Open Truck
Loading time per trip Unloading time per trip Travelling time per trip
90
HCS Collection
80
70
60
50
40
30
20
10
0
Ward-12 Ward-23 Ward-31
Selected study wards
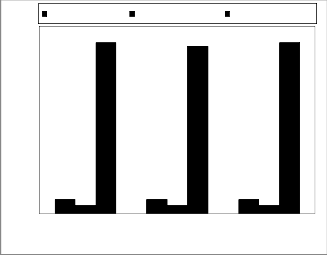
Figure 5(b): Time ratio of traditional HCS collection
OT collection systems collect waste from open dumping points from the community including street sweeping waste is provided in Figure 7. Just after the collection of OT, the community is clean. However, container stays whole day in the community and create public nuisance and traffic congestion. Although the OT and HCS are available near the road side, however, public throw their waste outside the container shown in Figure 8. The crews do not use safety gears in both collection systems. There is high risk of injury to load the OT due to pick up or loading and carrying of waste and there is risk also of sharp materials. There is no prac- tice of manual lifting and placing of container to the carrier and almost no risk of injury. Unsafe or careless movement of the crews was observed in both collections. Odors and scatting of wastes are common in both the collection system but this situa- tion is more common at OT collection and there is no leachate control facility.
OT Collection HCS Collection
50
45
40
35
30
25
20
15
10
5
0
Ward-01 Ward-15 Ward-20 Ward-30 Ward-12 Ward-23 Ward-31
Selected study area
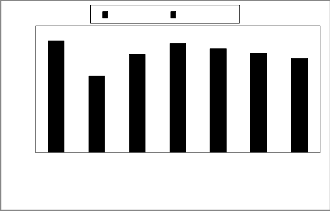
Figure 6: Percentage of time efficiency rating of OT and HCS
Figure 8: Waste outside of haul containers
Long time pickup operation creates public hazard in OT
system. Day-long staying of demountable container in com-
IJSER © 2013
International Journal of Scientific & Engineering Research, Volume 4, Issue 11, November-2013 16
ISSN 2229-5518
munity may cause leachate contamination and scattering of waste surrounding the container because of improper use. Most of the OT vehicles are old, consumes more fuel and emit more particulate matter, GHG and unburned hydrocarbon than container carriers. OT collection is effective in every- where, where vehicle can get in and are suitable for commercial, domestic, garden and backyard trimmings, construction and demolishing waste and drain cleaning waste. Moreover, KCC faces lack of waste dumping area with its increasing urbanized wastes since it has only a UDS. There- fore, it is important to find out some other sites. The ecological footprint (0.088 ha/capita) was calculated to develop a sus- tainable waste management system by considering its existing solid waste characteristics (Salequzzaman et al. 2005). Seven suitable UDSs have been found by the multi-criteria evalua- tion method using Geographical Information System (GIS) approach in Khulna city. Each site has satisfied all the criteria adopted for highly suitable sites for MSW disposal (Rahman et al. 2008).
The managed waste was found approximately 45-63 and 107-
134 kg/km/hr for OT and HCS system, respectively. In terms of system operation efficiency as kg/km/hr, HCS can be re- garded as almost two times more efficient as OT based system. It has found that within the round trip haul distance 20-35 km, OT can make 4 trips/shift and HCS can make 3 trips/shift in less than assigned working shift (8 hours). Time efficiency rating for both the collection systems can be increased by in- creasing crews working hours. The capacity usages of vehicles were 82-93% and 79-87% for OT and HCS, respectively. Time ratio of traditional OT and HCS for other times not actually engaged in work was about 3 and 10%, respectively which should be overcome for effectiveness of the system. Efficiency and effectiveness standardization of regular collection is re- quired to be set based on more sample survey, trial and error and laboratory tests and management decisions to be taken to promote the standardsthese should be referenced in the body of the paper.
This study would not have been possible without the assis- tance and support of Mr. Anisur Rahman, Chief Conservency Officer, Khulna City Corporation, Bangladesh. The authors wish to thank all anonymous reviewers for their inspiring and constructive comments on paper.
[1] Ahsan, A., Alamgir, M., Islam, R., Chowdhury, K.H. (2005). Initiatives of Non-Governmental Organizations in Solid Waste Management at Khulna City. In: Proc. 3rd Annual Paper Meet and Intl. Conf. on Civil Engineering, IEB, Dhaka, Bangladesh, 185-196.
[2] Alamgir M, Ahsan A, McDonald CP, Upreti BN, Islam R (2005). Pre- sent Status of Municipal Solid Waste Management in Bangladesh.
Proc. International Conference on ‘Waste-The Social Context’,May
11-14, Alberta, Canada, 11-20.
[3] BBS (2001). Statistical Pocket Book of Bangladesh. Bangladesh Bureau of Statistics.
[4] Fukuda-Parr, S., C. Lopes, and K. Malik (2002). Capacity for Devel- opment: New Solutions to Old Problems. London: UNDP–Earthscan.
[5] KCC (2005). Feasibility Study on Municipal Solid Waste Management in Khulna City. Study Report, A feasibility project under the Asia Pro Eco Programme of EC, Department of Civil Engineering, Khulna University of Engineering and Technology, Khulna, Bangladesh.
[6] Ludwig H.F. and Black R.J. (1968). Report on the solid waste prob- lem. Journal of Sanitary Engineering Div., 94(2), 355-370.
[7] Mahees M.T.M, Sivayoganathan C, Basnayaka B.F.A (2011). Con- sumption, Solid Waste Generation and Water Pollution in Pinga Oya Catchment area.
[8] Peavy, S.H., Rowe, R.D. and Tchobanoglous, G. (1985). Environmen- tal Engineering, McGraw-Hill International Editions, Civil Engineer- ing Series, 610-613.
[9] Rahman MM, Sultana KR, Hoque MA (2008). Suitable sites for urban solid waste disposal using GIS approach in Khulna city, Bangladesh. Proceedings of the Pakistan Academy of Sciences, 45 (1): 11-22.
[10] Salequzzaman M, Sultana UT, Iqbal A, Hoque MA (2006). Ecological footprint of waste generation: a sustainable tool for solid waste man- agement of Khulna City Corporation of Bangladesh. Proc. Interna- tional Conference on Complex Systems, June 25-30, Marriott Boston Quincy, Boston, MA, USA, 1-12.
IJSER © 2013 http://www.ijser.org
International Journal of Scientific & Engineering Research, Volume 4, Issue 11, November-2013 17
ISSN 2229-5518
Table 1: Summery of findings of OT and Demountable Container collection sysem
Evaluating Parameters | Collection area | |||||||
Demountable container collection (HCS) | OT collection | |||||||
Types of Collection | Ward-01 | Ward-15 | Ward-20 | Ward-30 | Ward-12 | Ward-23 | Ward-31 | |
Vehicle/registration Number | Khulna Metro sha- 110036 | Khulna Metro sha-110015 | Khulna Metro sha-110026 | Khulna Metro sha-110045 | Khulna Metro cha- 110029 | Khulna Metro cha- 110019 | Khulna Metro cha- 110012 | |
Vehicle capacity (ton) | 7 | 7 | 7 | 7 | 7 | 7 | 7 | |
Crew size | 2 (assigned 2) | 2 (assigned 2) | 2 (assigned 2) | 2 (assigned 2) | 2 (assigned 2) | 2 (assigned 2) | 2 (assigned 2) | |
Round trip haul distance (km) | 32.5±1 | 30.50±0.5 | 23.50±0.50 | 20.50±0.50 | 20.5±.5 | 27.5±0.50 | 24.50±0.50 | |
Total travel distance (km/trip) | 35±.5 | 35.50±0.5 | 28.50±0.50 | 23.25±0.50 | 22.5±1.00 | 36.50±0.5 | 33.50±0.50 | |
Trips/day | 2 (assigned 3) | 2 (assigned 3) | 2 (assigned 3) | 3 (assigned 3) | 3 (assigned 3) | 3 (assigned 4) | 3 (assigned 4) | |
Total trip time, TTT (min) | 446±9.5 (2trip) | 311±9 (2 trip) | 390±10 (2 trip) | 453±13 (3 trip) | 416±11.5 (3 trip) | 408±7.5 (3 trip) | 372±8 (3 trip) | |
Collection stations/trip | 2 | 3 | 2 | 2 | 1 | 1 | 1 | |
Fuel allocation (km/litre) | 4 | 4 | 4 | 4 | 5 | 5 | 5 | |
Cost effectiveness in terms of fuel allocation for surveyed vehicle capacity (taka/ton) | 9(L/trip)*68(Tk/L)/5.5 (T/trip) =112 | 9(L/trip)*68(Tk/L)/6 (T/trip) =102 | 7(L/trip)*68(Tk./L)/5.25 (T/trip) =91 | 6(L/trip)*68(Tk/L)/6(T/trip) =68 | 4.5(L/trip)*68(Tk/L)/6. 5(T/trip) =47 | 7.5(L/trip)*68(Tk/L)/5. 9(T/trip) =86.50 | 7(L/trip)*68(Tk/L)/5.89 (T/trip) =81 | |
Number of trips/shift | Assigned trips/shift: 3 Trip/shift from T&M:2 | Assigned trips/shift: 3 Trip/shift from T&M:2 | Assigned trips/shift: 3 Trip/shift from T&M:2 | Assigned trips/shift: 3 Trip/shift from T&M:3 | Assigned trips/shift: 3 Trip/shift from T&M:3 | Assigned trips/shift: 4 Trip/shift from T&M:3 | Assigned trips/shift: 4 Trip/shift from T&M:3 | |
Total waste transportation and disposal (ton/shift) | 11.00±1.50 | 12.00±.50 | 10.5±1.5 | 18.25± 1.25 | 19.00±1.00 | 17.75±1.50 | 18.0±1.00 | |
Net pickup time or Pickup time (minutes/trip) | 8-9 Around 3% of TTT | 6-7 Around 3% of TTT | 4-5 Around 3% of TTT | 5-6 Around 3% of TTT | 14-15 Around 7% of TTT | 7-10 Around 7% of TTT | 8-9 Around 7% of TTT | |
Unloading time (minutes/trip) | 6-8 Around 3% of TTT | 5-6 Around 3% of TTT | 5-6 Around 3% of TTT | 5-6 Around 3% of TTT | 7-8 Around 4% of TTT | 4-5 Around 4% of TTT | 4-5 Around 4% of TTT | |
Travel time (hour/trip) | 6.2-6.7 hrs/shift 3.1-3.35 hrs/trip Around 85-88% of TTT | 4 to 4.60 hrs/shift 2-2.30 hrs/trip Around 83-87% of TTT | 5.4-6.0 hrs/shift 2.7-3.00 hrs/trip Around 85-90% | 6-7 hrs/shift 2-2.3 hrs/trip Around 85-89% of TTT | 5.4-6 hrs/shift 1.80-2 hrs/trip Around 80-84% of TTT | 5.20-5.70 hrs/shift 1.73- 1.9 hrs/trip Around 78-83% of TTT | 5-5.5 hrs/shift 1.6-1.80 hrs/trip Around 78-85% of TTT | |
Load per TTT (kg/hr) | 1485±235 | 2157±164 | 1622.5± 272.5 | 2424±235 | 2746.5± 220.5 | 2614.5± 296.5 | 2908±224 | |
Load per transporting time (kg/hr) | 1717±229 | 2812.5± 312.5 | 1861.5± 316.5 | 2839.5±410.5 | 3352±352 | 3276.5±425.5 | 3445.5± 354.5 | |
Net loading rate or pickup time (min/ton) | 2.25±0.25 | 1.75±0.25 | 1.25±0.25 | 1.5±0.25 | 2.2±0.4 | 1.6±0.4 | 1.2±0.4 | |
Managed waste of load/total distance/total time (kg/km/hr) | 42.53±7.23 | 65.43±5.53 | 57.12± 10.50 | 104.52± 12.36 | 123±15 | 71.76±8.34 | 118.94±11.57 | |
Vehicle capacity utilization calcu- lated as ton/trip and as percentage | Ton/trip:5.50±0.75 T&M:68-89% | Ton/trip:6.00±0.25 T&M:83-90% | Ton/trip:5.25±0.75 T&M:65-76% | Ton/trip:5.95±.28 T&M:81-93% | Ton/trip:6.36±0.36 T&M:86- 96% | Ton/trip:5.92±0.50 T&M:78-92% | Ton/trip:5.89±0.22 T&M:81-91% | |
Net overall speed (km/hr) | 32±4 | 30±2 | 32±4 | 32±4 | 22±3 | 22±3 | 22±3 | |
Time efficiency rating | 44%±1% | 30%±2% | 38.5%±1.5% | 43.25%± 1.5% | 41%±1% | 39%±2% | 37%±1.5% | |
Gross labor efficiency (person- minute/ton) | 94±2 | 53.6±2.4 | 75.5±12.5 | 50±5 | 43.75± 3.75 | 46±6 | 41.5±3.5 | |
Net labor efficiency (person- minute/ton) | 36.5±5.5 | 22.5±1.5 | 34±5 | 22.25± 1.75 | 21±2 | 19.25±1.75 | 17.5±1.25 |
IJSER © 2013 http://www.ijser.org