International Journal of Scientific & Engineering Research, Volume 4, Issue 6, June 2013
ISSN 2229-5518
2898
Ramana .N, Dr.C.V.Guru Rao
Abstract— Data Mining is used comfortably in a constructive way in areas such as e-business, marketing and retail. Due to this factor it is now relevant in knowledge discovery in databases (KDD) in economy and industrial areas. Fields like medicine and public heath are two areas where data mining is getting popular immensely. This report discusses the application of methods involved in data mining in healthcare and disease diagnosis. The complexities involved in using data mining in healthcare are also touched upon. Surveys conducted on data mining and healthcare state that the use of former has increased. It helps in making good health policy, knowing the disease, protecting death and illegal insurance claims.
Index Terms— Data mining, Disease Prediction, Knowledge discovery, health care.
—————————— ——————————
Data mining is widely used in e-business, marketing and retail; this has in turn led to its application in knowledge discovery in databases (KDD) in economy and industrial areas. It is also popu- larly used in the healthcare field.
Definite information and proofs shows support medical judgment (based on medicine evidence or EBM). John Snow, the father of epidemiology used around 1854 maps that consist of bar graphs to prove that cholera passes through water that lies beneath [14]. His observation stated that most of the deaths happened in an area that had water well in London. Snow used black bars to show the sufferers address on the map and he numbered the death occurrence.
Way back in 1855 Florence Nightingale also explained through polar-area diagrams that deaths in the army could be reduced to
an extent by the use of hygiene clinical methods. In order to curb the death rates and to help the policy makers in making applica- tion reforms she used diagrams for explanation.
Both Snow and Nightingale collected information, arranged it
and scrutinized it as the data was controllable. These methods may not be applicable in today‘s times and the population has exploded. Though several methods have been used using gadgets, success is very minimal. None have been able to match the re- sults that were obtained by investigators in the past. This is where data mining comes into picture as it helps in cracking problems that occur in getting data related to healthcare.
Data mining is a popular topic in most of the recent studies also it is widely used in medicine and public health. Very recently in
2003 Wilson et al deliberated on researches that used KDD and data mining in healthcare. His opinion was that it was too confus- ing. When some authors used data mining for gaining infor- mation the others used them in statistical process within knowledge discovery process [16].
Data mining definition is misconstrued in medical filed. The popular definition of data mining is group of procedure and prac- tices to shape demonstrate and expand information [17].
The flow of the paper is as follows. Section 2 deals with re- search work and write-ups that divulge association of data mining and healthcare sector. In section 3 you will see the influence of existing state of art in ―Prediction models for disease diagnosis‖. Conclusion is in section 4 and that followed by references.
One big problem that is gnawing the society is high health care costs. Population is increasing by the day and this has resulted in serious problems for the health care industry. Also acuteness of the patient‘s condition needs to be minimized and should be de- tected in a more useful way. Hospitals have been putting effort to amplify effectiveness and use of its resources to the fullest to bring down the medical cost.
As per the report in [2], this is from the Institute of Medicine (IOM), around 44000-98000 Americans die each year due to medical errors. These errors result around 37.6 dollars billion expenditure to the US. 45 percent of these errors can be avoided. If the medical errors are prevented patient‘s life can be saved and healthcare expense will come down to a great extent. This survey is an addition to the previous ones. Categorizing algorithms in data mining Heart diseases, Lung cancer, Cerebrovascular dis- ease, Stroke diseases, predicting multiple diseases of Hyperten- sion and Hyperlipidemia, Diabetes, and tuberculosis a prognostic model was developed. Different techniques along with competent classification algorithms are used to foresee these diseases. Dis- eases mentioned above can be predicted by the classification al- gorithms using decision trees, Bayesian classifier, back propaga- tion neural network, multivariate adaptive regression splines, Adaptive-network-based fuzzy inference system ,genetic algo- rithm, Fuzzy rule base, Association rule and k means clustering. This will have all characteristics of patients‘ medical history and symptoms. All unnecessary records are removed along with the data. Along with relevant data prognostic data mining techniques are developed for the diagnosis of life threatening diseases.
Data mining classification is used by the prediction model, which has two methods. One is prediction model and other is evaluation method. While the first method uses training dataset for viewing the attributes and build classification predictive model, the se- cond method makes use of testing dataset for knowing classifica- tion competence. Based on the survey the classification algorithm can be divided into many types. The patients‘ disease can be pre-
IJSER © 2013
International Journal of Scientific & Engineering Research Volume 4, Issue 6, June-2013
ISSN 2229-5518
2899
dicted whether it is high level illness or low level and also what disease the patient is suffering from based on the input and meas- ured variables.
Decision tree is a very easy and straight forward tree structure
[3][5][15], which is very efficient has been used to envisage many life threatening diseases.
A naïve Bayesian classifier will follow Bayes theorem that will work on probabilistic statistical classifier. This comes with an advantage of rapidity of use and effortlessness of handling the dataset having simple and easy characteristic.
Clustering means assembling similar record [5], [6], which is used in the preliminary processing stage prior to adding the data into grouped model. It‘s important to normalize the value prior to clustering to dodge the domination of high value attribute over low value attributes.
Neural Network (NN) is a compilation of neurons organized be-
tween more than two network layers applied in different disease prediction used in paper [2] [7], [11], [12], and [15]. It consists of three layers the input layer, hidden layer and output layer. Linear transfer function is used as input layer and nonlinear transfer function is used as the output layer. The primary stage will see the transfer function and network parameters and analyze the outcome of every neuron in the hidden layer and approximate the output in the hidden layer.
Adaptive Neuro Fuzzy Interference system merges neural net- works and fuzzy systems. The inputs are converted from numeri- cal domain to fuzzy domain. The combination of Fuzzy and ge- netic algorithm considerably advances the functioning to identify diseases of patients and low down the cost and increases preci- sion.
The Multivariate Adaptive Regression Spline Technique method utilizes number of Basis Function (BFs) [4] to build MARS pre- dictive models. Selecting variables that are extensively used in the field of healthcare and engineering is very easy.
Prediction models are nothing but core data mining methods used in engineering and healthcare. The initial step includes data com- pilation for foreseeing life threatening disease that are collected from medical institute. Unsuitable and conflicting data are re- moves in the preliminary processing. Thereafter prediction algo- rithms are used. Performance is evaluated by equating various models used and the precision is measured. Later it is matched up with the present model and authenticated how the projected mod- el is superior to the existing models. Artificial neural network techniques use data mining methods like the Intelligent and Ef- fective Heart Attack Prediction System. In the primary stage data is extracted from the data warehouse of prediction of heart dis- eases. Later it is preprocessed and clustered by using K means clustering algorithm [6]. Selected significant patterns and Multi- layer Perceptron Neural Network with Back-propagation used as training algorithm are used to train neural networks. The outcome very clearly shows that the designed prediction system is compe- tent of foretelling the heart diseased more accurately. 15 attrib- utes are used extensively to predict heart diseases, through data mining techniques like ANN, Clustering an Association Rules, soft computing approaches etc. The result explains that the Deci- sion Tree is accurate, also the sometimes Bayesian classification also has comparable accuracy. But other methods like KNN, Neu- ral Networks, classification based on clustering fail to function
well [5]. Weighted Associative Classifier (WAC) can be used with a slight change, rather than considering 5 class label only 2 class labels ―Heart disease‖ ―No Heart Disease‖ are used. An utmost accuracy of 81.51 percent is got. Further improvement and reduction of actual data size of the Decision Tree and Bayes- ian Classification can be got after applying genetic algorithm.
909 patient records were gathered and 13 characteristics were used for consistency.
455 records were used for training dataset and 454 records for testing dataset from the total of 909 records. Attributes were re- duced to 6 after applying genetic search. More efficiency with
99.2 percent accuracy was seen when both algorithms were com- pared. Two phases are made use of
1. The generation of weighted fuzzy rules
2. To develop a fuzzy rule-based decision support system [13].
To get weighted fuzzy rules, the attribute selection and attribute weightage methods are used. Using k-fold cross validation the prediction results are validated. Based on weighted fuzzy rules and chosen attributes further construction is made. Then it is equated with neural networks by making use of precision and sensitivity.
Cancer can be easily identified only through the analysis of ge- netic data. This is described by cancer gene search with data min- ing and genetic algorithms [18]. The analyzed quality of genes are used a training and test data set for all cancer types. The inte- grated gene-search algorithm is included with genetic algorithm for data preprocessing and data mining categorization methods for predictions. The categorization has high precision with the capacity to recognize most important genes. On comparing with other reports the mapping of genotype information to the pheno- type parameters will lower the cost and identify cancer at the initial stage. Liver disease may not be easily detected in the pri- mary stages cited a paper on the intelligent model for liver dis- ease diagnosis [19]. As classification tools Classification and Regression Tree (CART) and case-based reasoning (CBR) tech- niques are used. CART categorizes the occurrence and nonexist- ence of the liver disease and makes a set of rules that contains predictable and target variables for creating the right diagnosis, this is the first stage. CBR is used to recognize the type of the liver and display that CART has 94 percent accuracy and CBR comes with 90 percent accuracy, this is the second stage.
Breast cancer in women has the most important cause for death in developed countries. To diminish this cancer death, awareness is important and the cancer should be detected at the primary stage. Physicians can detect malignant tumor from the benign ones through reliable diagnosis procedure [20]. Data was accumulated from 257 women who had breast cancer at initial stages. Model Selection Tool was used a more dependable outcome model. Since the database was considerably small, the utmost accuracy that was attained was 80 percent. Automatic diagnosis system was used to predict breast cancer [32] and it was based on associ- ation riles and neural network. With Association rules the dimen- sion of breast cancer can be reduced and intelligent classification can be made using intelligent classification. Both these systems performance is compared with the NN model. The input attrib- utes used to identify the breast cancer is reduced from nine to four by making use of Association rule and previous detection.
IJSER © 2013
International Journal of Scientific & Engineering Research Volume 4, Issue 6, June-2013
ISSN 2229-5518
2900
Cerebrovascular disease has serious repercussion on human body. The predictive model uses 493 valid samples and contains 29 attributes that comprises of blood test, physical exam results and diagnosis results. The classification models are categorized as algorithms, decision trees, Bayesian classifiers and back propaga- tion neural networks. Decision tree showed an accuracy of 99.59 percent after applying the classification. It could also construct classification model with stable classification effectiveness. This proves that the compared to other algorithms decision trees is the finest classification algorithm. Stroke is the foremost cause for severe long term disability [7]. Recovering from depends on the severity of the stroke attack. Artificial Neural Networks (ANN) is used to predict Thrombo-embolic stroke disease. Records of 50 patients were used for this research, which demonstrated that ANN based prediction of stroke disease got a 89 percent accura- cy. It showed good performance level for prediction of stroke disease.
For multi disease prediction Multivariate Adaptive Regression Splines (MARS) method is used. Post examination it was found that patients with Hypertension and Hyperlipidemia have more chances of being diagnosed with cardiovascular disease. Six data mining approaches were used to construct a predictive model for hypertension and hyperlipidemia using the common risk factors of these two diseases. This method gave an accuracy of 93.07 percent [4]. This was also a good method of predicting hyperten- sion and hyperlipidemia.
People suffering from Tuberculosis can die if the disease is not treated properly. This disease is caused by a bacterium. Adaptive- Network-Based Fuzzy Inference System (ANFIS) was used to predict the survival of mycobacterium tuberculosis. 667 patients were got which had 30 input parameters. This was reduced to 20
input variables. 500 of these records were used to generate AN- FIS models and were put into practice using multi-layer percep-
tron. Compared to multi-layer perceptron, ANFIS was more accu- rate for classification of tuberculosis patients.
Diabetes can be predicted using fuzzy and genetic algorithms, which gives good accuracy with low cost [9]. Computation cost decreases and classification performance increases with genetic
algorithm. Fuzzy logic framework can considerably perk up the
mechanism used to diagnose patients having diabetes. The artifi- cial neural network (ANN) and fuzzy neural network (FNN) used. The precision of these datasets were got by k-fold cross- validation. It gave 84.24 percent accuracy. Prior to this other methods were used and the accuracy obtained was 59.4-84.05 percent. Diabetes prediction needs effective models, various models are designed for this. [33]Hybrid Prediction Model (HPM) that uses K means clustering algorithm for validation and C4.5 algorithm is used to build final classifier model that uses k- fold cross-validation method. HPM gave 92.38 percent classifica- tion accuracy.
With a construction and training of an artificial neural network for determining skin diseases, constructs by a feed forward archi- tectural design gave a good result on identifying skin diseases in countries such as Nigeria. 90 percent accuracy was obtained. Testing evaluation, treatment evaluation and treatment effective- ness was used diagnosis of skin disease. Accuracy gained was 90 percent with reduced cost.
In the past few decades medical system in developing countries have used expert systems. But they lack heavily in areas such as using of prediction systems in diagnosis and treatment of related disease, teaching medical students and advising the patients. This problem has led to too much expenditure, less time, less access to physicians and finally putting human lives into risk.
For medical expert system, medical field is always the first test- ing ground. Few successful medical expert system include MY- CIN, NURSExpert, CENTAUR, DIAGNOSER, MEDI and GUIDON, MEDICS, and DiagFH. An expert system can be de- fined as a computer program that tries to replicate the analysis and understanding of experts in deciphering the problem [35]. As indicated by Garcia, Jackson tends to believe that Expert System is a computer program that‘s shows and explains the information that‘s some specialist would have on the subject.
A prediction system was prepared by Keles and Yavuz called Ex- DBC (Expert System for Diagnosis of Breast Cancer). It was specified that fuzzy rules that will be used in inference engine of Ex-DBC system were found by using Neuro- fuzzy method. Breast cancer can be detected with Ex-DBC as a strong diagnos- tic tool with 97 percent specificity, 76 percent sensitivity, 96 posi- tive and 81 negative predictive values. Unnecessary biopsy can be prevented by this system [36]. Adeli and Neshat attempted to make a system with 13 inputs and one output field. Chest pain type, blood pressure, cholesterol, resting blood sugar, maximum heart rate, resting electrocardiography (ECG), exercise, old peak, thallium scan, sex and age were the input field. The results got from here were them tallied with the data in the database. An accuracy of 94 percent was recorded.
Fuzzy rule based prediction was designed to detect asthma using a system coded with MATLAB software [37] Zarandi, et al. With affirmation that the facts were got from high level, base on pa- tient perception and was prepared into two different structures called Type A and Type B. Six modules, including symptoms, allergic rhinitis, genetic factors, symptom hyper-responsiveness, medical factors and environmental factors are included in Type A. Type B is comprised of eight modules, including symptoms, allergic rhinitis, genetic factors, and response to tests, PEF tests and exhaled nitric oxide. They arrived at a conclusion that final results of every system are de-fuzzy field in order to provide the assessment of the possibility of asthma for the patient [38]. A prediction system design and analysis was presented by Singh et al. For mammographic findings that would support clinical deci- sion to perform biopsy of breast a algorithm rule-based reasoning was developed. Using the round –robin sampling scheme the designed system was assessed and executed with the receiver operating curve of 0.83, drawing parallels with the functioning of a neural network model [39].
A fuzzy rule-base prediction system for the assessment of fatal asthma was developed by Zolnoori et al[40]. The most important feature of this system is Fuzzy-rules, modular representation of variables in regard to patients‘ perception of the disease, and min- imizing the need for laboratory data. Asthma, allergy, immunolo- gy research center of Imam Khomeini Hospital reiterated the competency of the fuzzy prediction system for prediction of pos-
IJSER © 2013
International Journal of Scientific & Engineering Research Volume 4, Issue 6, June-2013
ISSN 2229-5518
2901
sibility of fatal asthma after assessing the performance of the system [40]. Knowledge based system for detecting and manag- ing diabetes mellitus was devised by Akter et al[41].
Preventive care would help in controlling the gravity of diabetes
was what they believed. It‘s important that these preventive methods have good educational awareness and regular health checks. Developing lost cost automated knowledge based system with easy computer interface was the main purpose of this re- search. Diagnostic tasks are performed by the system using rules got from medical doctors based on patients ‗data [41].
Based on association rules and neural network, Karabatak et al[42] put forward a prediction system for detection of breast cancer. Depending on association rules (AR) and neural network (NN), they made a automatic diagnosis system for detecting breast cancer. This model was weighed against NN model, also the dimensions were reduced from nine to four using AR. This was applied at the Wisconsin Breast Cancer Database for authen- tication and its came out with a result of 95.6 percent. Hence it was concluded that Ar+NN model could also be considered for fast diagnostic systems for other disease [42].
3.1 Medically Driven Data Mining Application: Recognition of Health problem from Copyright from Gait Patterns of Elderly:
3.1.1 Exploration
A medically driven data mining application system for investigat- ing the walk models related to the health ailments of the aged for sustenance of independent living was revealed by BogdanPo- gorelc et al [20].
Using antenna and RFID labels data is gathered in this model. Motion capture gadgets were put into use to obtain the walking style of old people. This also had labels fixed to their bodies and antenna‘s fixed in the building. Label location was achieved by the antenna to spot a specific health issues and time series of lo- cation directs were examined. Author introduced certain charac- teristics for training decision tree classifier and KNN classifier to categories the walking style of the old people. They are normal, with hemiplegic, Parkinson‘s disease, with pain in the back and with pain in the leg.
BogdanPogorelc et al [20] created a automatic health-state identi- fication. 13 characteristics were introduced and checked and were kept on 12 labels that were fixed on elbows, wrists, hips, knees, ankles of the aged people. The characters introduced and that
were put in for modeling using the machine learning procedure are as follows:
Variation in a) Average space between right elbow and right hip and b) average space amidst right wrist and left hip.
Ramana.N is working as Assistant Professor in Department of Computer science and Engineering in Kakatiya University, A.P India.
Dr.C.V.Guru Rao is working as Professor in Department of Computer science and Engineering in SR Engineering College, JNTU
University, A.P, India.
Normal angle of right elbows
Amount between maximum angle of the left knee and the right knee
Difference between the maximum and minimum angle of right knee
Difference between a) maximum and minimum height of the left shoulder and right shoulder
Amount of variation between maximum and minimum height of left ankle and right ankle
Entire variation between maximum and minimum speed of right shoulder and right elbow and b) average space
between left shoulder and right wrist.
Amount of speed of the right wrist
Average angle between a) vector between right shoulder and right hip and b) vector between right shoulder and right wrist.
Reliability of the angle of the right elbow passing aver- age angle of the right elbow.
Difference between the average height of the right shoulder and average height of the left shoulder.
Tests were conducted applying decision tree and k-nearest neigh- bor classifier. The goal of this test was to check the categorization exactness of models built by applying the machine learning pro- cesses. The test appropriateness was achieved by using 10-fold cross justification. Using seven labels the information for deci- sion tree classifier was obtained and a 5mm standard is the varia- tion of sound. KNN results were exacts compared to decision tree results was what BogdanPogorelc arrived at [20]. 95 percent ex- actness was obtained by decision tree and 99 percent was from KNN.
3.1.2 Observation:
The walking style of aged people is done in relation to the health related issues so that they keep up with their independent living. In the initial stage it was noted that the decision tree acquired
90.1 percent accuracy and k-nearest neighbor got 100 precision. Protection and assurance was provided for the old people who resulted in low ambulance prices. Hence we conclude that 99 percent exactness was achieved with 8 labels and sound 0-20mm standard by the k-nearest neighbor, while decision tree achieved
95 percent exactness.
The consequence of the distinctiveness applied to model the ma- chine learning was not calculated and the elements picked to in- struct the classifier are also not good enough. So we can conclude that there were constraints and researches were carried out just to assess the presentation of decision tree and KNN tree.
The study must authenticate the suggestion of the training characteristics and essentials linked to healthcare field. Data min- ing is used before identification of disease, saving the patients from deaths, improvement of diagnosis and knowing false health declarations. Data mining can be used in healthcare with caution.
3.2.1 Exploration:
IJSER © 2013
International Journal of Scientific & Engineering Research Volume 4, Issue 6, June-2013
ISSN 2229-5518
2902
An ADR indicating method was introduced by Huidong Jin et al [21] which showed sudden and irregular models feature of ADRs. He argued that all existing post market ADR indicating methods depend on unplanned ADR case results which suffer from severe underreporting and latency data. Deaths and hospitalizations have increased because of ADRs. Administrative health data is collect- ed regularly and universally. The methods used are domain- driven facts illustration Unexpected Temporal Association Rule (UTAR) and MUTARA (Mining Unexpected Temporal Associa- tion Rule). HUNT was also proposed to highlight sudden models by checking their grades based on proposed measurement process called ―unexlev (unexpected-leverage)‖ with those based on es- tablished influence.
3.2.2 Observation:
Two interesting measures were proposed by Huidong Jin et al [21], the unexlev (unexpected-leverage) and rank ratio, in the situation of signifying irregular and sudden models features of ADRs from organizational health information. Two easy and also successful mining strategies called HUNT and MUTARA were introduced to detect pair wise UTARs from the QLDS. Both indi- cated strange ADR models.
3.3.1 Exploration:
Vikramaditya Jakkula [22] told about observing analytical data mining to find the health importance of a person living in a smart home. A process where the tools of the smart home are finding and obtaining their guess capabilities by adjusting to smart home tenants were introduced by him.
Data was gathered using a set of motion antennas when this method was analyzed. This was done with the help of Argus an- tenna network. The information if further improved upon by ap- plying digital gadgets. The process was carried out for 150 days on a single tenant of the building.
The information collected from the motion antennas were used straightforwardly. Tests were conducted by WEKA [23]. There were training and testing days in 150 days. Test one aimed on forecast examinations.
The forecast improvement is dependent of the classifier to edu- cate. Different classifiers presentations were checked upon, apart
from the time series details collected from the occupants in smart home. Compared to practices like SMO regression, LazyL WL and multi-Layer observation test conducted with KNN performed well.
Test two targeted on foretelling if the given time structure was odd or not. First test claimed that KNN was best with 51 percent
accuracy and the test two said that KNN was perfect in forecast- ing with 85 percent precision.
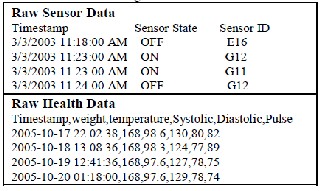
(a) Sensor readings as collected in a smart home.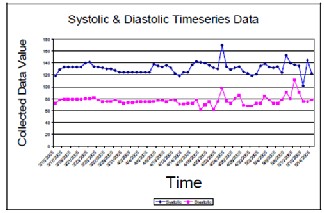
(b) Systolic and Diastolic time series data plot. Figure 1: Data samples collected from sensors.
3.3.2 Observation:
Use of data mining in smart home is indicated in the tests. Many learning strategies were assessed. End result said that KNN has
51 percent accuracy in foretelling key health sign values and 85 percent in foretelling odd periods. While the drawbacks were the validation of constraints opted as information feature, emphasis was laid on forecast exactness of categories.
3.4.1 Exploration:
A proposed data mining model by Jeremy Rogers et al [25] known as CLEF Chronicle to get history of patients from Elec- tronic Heath Records that showed patient’s illness and treat- ments that are disclosed through time. The basic aim is perfect querying of aggregated patient data for clinical research. It also supports summary of individual patients and resolution of co-references amongst clinical documents.
3.4.2 Properties of CLEF Chronicle:
The clinical history of an individual patient of an CLEF Chroni-
IJSER © 2013
International Journal of Scientific & Engineering Research Volume 4, Issue 6, June-2013
ISSN 2229-5518
2903
cle is shown as a network of typed instances and their interrela- tions. Illustration (figure1) shows the general flavor what is being tried to be shown. A painful mass in the breast is detected; next a clinical appointment is set. Treatment, medication and biopsy follows. A follow-up appointment is set-up to review biopsy. This is done to detect whether there is cancer in the mass. If this is confirmed radiotherapy is advised.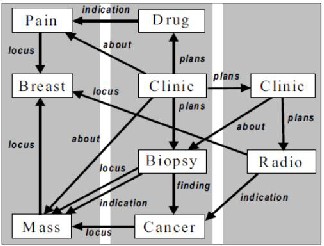
Figure 1[25]: Informal View of Patient-History Fragment
(NOTE: Time-flow is roughly left to right)
There will be a clear structural difference between this version and the traditional electronic record. Clinical content shown should have two main properties:
Parsimony: Multiple separate mention of occurrence of diseases
in the traditional patient record. CLEF Chronicle must have one episode of each.
Explicitness: Only clinically important information will be en- tailed. This must be precise in a CLEF Chronicle Representation.
3.4.3 Functions of CLEF Chronicle:
CLEF Chronicle is proposed to sustain more wide and communi- cative, questioning of aggregations of patient stories than is pos- sible presently while also aiming at bettering the efficiency of complex queries. Since the Chronicle is specific, then it can be asked for e.g. in a set period of time how many patients have re- lapsed? Chronicle is communicative because typing information linked with each chronicle is got from rich clinical ontology, the- se queries could be got from randomly abstract concepts.
How many cancers of lower limb were recorded could be asked?, and retrieving all those records which have parts of lower limb. This is less difficult as compared to the traditional organization as here patient records will need serial or nested approach of rec- ords.
Individual Chronicle can be sea of information during its recon- struction. Frequent co-references and frequent references to real world instances are settled in chronicle.
Individual Chronicle can be sea of information during its recon- struction. Frequent co-references and frequent references to real world instances are settled in chronicle.
The chronicle is also proposed to operate as a knowledge re- source from where summarizing concepts and information can be obtained. E.g. in case of aneamia and its reoccurrence after sev- eral years new tests will follow and chemotherapy will be given. Records may not state why drug X was given. But medicos browsing the chronicle will identify and condition y because the medicine used has no other reasonable context of use.
CLEF Chronicle aims to support natural summarization of patient records. Quite a number of times due to the disorganized nature of patient records, manual summary is termed as perfect clinical practice. This however is very time consuming, while the result of such work is disreputably out of date whenever it is most clini- cally valuable.
3.4.4 Observation:
Weed‘s work on problem oriented record [26] shows the idea of representing clinical information as some form semantic net, mainly concentrating on why things were done and is not new. Resolution of co-references in clinical records to instance unique identifiers (IUIs) [27] was administered by Smith and Ceusters. New possibilities were offered by semantic web initiatives for putting such an effort into practice. But short of suitable clinical data is the major constraint for practical experimentation. CLEF model gives useful means to discover some computational and representational issues that come into existence.
3.5.1 Exploration:
K S Ng et al [24] try to tell us their encounter with fraud detec- tion in spatio-temporal health data in Medicare Australia while applying data mining techniques. The authors adopted different data mining techniques. Numerous techniques for obtaining fea- tures from spatial and temporal data were also discussed. System domain experts evaluated the system and high hit rates were ob- served. Some conventions drawn from the experience came as conclusions.
3.5.2 Experimental Objectives that the authors considered was:
1) Is there precision in characterization prescription given to the shoppers?
Shoppers who do not rigidly fit the strong criteria, can such consumers RAS be used to identify prescriptions. Can con- sumers RAS avoid making errors such as false identification of genuinely ill patients that exhibit certain characteristics of pre- scription shopping as prescription shoppers have in the past been an issue for Medicare Australia.
Data was taken from known postcode in a major capital city of
Australia where they tried to identify fraudulent activities. This was done for an experimental study. LOF implementation in the dprep package in R was the software used for the analysis. C++
IJSER © 2013
International Journal of Scientific & Engineering Research Volume 4, Issue 6, June-2013
ISSN 2229-5518
2904
was used for the modified Huff model and temporal feature ex- traction scheme.
Experiment 1: Quantitative characterization of prescription shop- per‘s accuracy was to be verified in the first experiment. Twelve people were selected to suit our criteria and were passed to do- main experts for evaluation. Concern was what percentage of these people are true prescription shoppers.
Experiment II: This experiment focused on verifying if it is prac- ticable to identify with low false positive rate, prescription shop- pers who do not fit the criteria identified. In order to perform this we need to eliminate all consumers identified in first experiment from the date. An LOF analysis is done on the rest and picks con- sumers who have massive volumes of drug concern for examina- tion by the experts. Fourteen consumers were picked, some of who had real need for drugs. In order to know if prescription shopper exhibit statistical outlier in the data, older consumers were removed. This be because such patients will have real medi- cal conditions and we did not want to investigate such patients. Data is normalized for LOF analysis and we calculate the lowest LOF value with k belonging to (20, 50).
3.5.3 Observation:
Additional work is needed to evaluate potential application of this work within the Medicare Australia compliance framework. It is not clear to what extent this system could be used as separate and only method to recognize prescription shoppers within a population. The authors however do conclude a high degree of weight in the methodology used. The worth of this approach lies in aiming higher risk prescription shoppers. We need to quantify the false negative rate with respect to the entire subset and not just the targeted subset.
The main drawback with this system is not being able to see the MBS side of the story to supplement what can be understood from a consumer‘s PBS record. Such limitations on linking MBS and PBS can cause problems. Another drawback is that the sys- tem was devised for individual consumers. Looking at a cost benefit perspective, definitely a colluding group of consumers are more practical.
3.6.1 Exploration of the model devised:
Malignant tumor developed from the cells in the breast is called as breast cancer. Empirical study was performed by the authors on the WBCD (Wisconsis Breast Cancer Dataset) taken from UCI machine learning repository (UCI Repository of Machine Learning Databases). 699 cases were studied and instances were taken from the patients breasts. 16 of these had missing values. Due to this factor the missing cases were discarded and the re- maining 683 were considered. In these 444 cases were benign and 239 were malignant. Every record had nine attributes, which fluctuated considerably between the benign and malignant sam- ples.
As per the proposal a rough set (RS) supporting vector machine
classifier (RS_SVM) for breast cancer diagnosis was found. Re- dundant features were removed by employing RS reduction algo- rithm as a feature selection tool and to further improve the diag- nostic precision by SVM. The efficiency of RS_SVM was stud- ied on the dataset of Wisconsin Breast Cancer Dataset (WBCD) using classification accuracy, sensitivity, specificity, confusion matrix and receiver operating characteristic (ROC) curves. High classification accuracy was obtained from this method (99.41%,
100%, and 100% for 50–50% of training-test partition, 70– 30% of training-test partition, and 80–20% of training-test partition, respectively) for a subset that contained five features.
3.6.2 Observations:
RS_SVM is the new expert system for breast cancer diagnosis. To classify the breast tumors a combination of five features (i.e.,
_Clump Thickness‗, _Uniformity of Cell Shape‗, Marginal Adhe- sion‗, _Bare Nuclei ‗and _Mitoses‗) to categorize breast tumors were recognized to be the most useful by the RS-based reduction algorithm. These five features were valuable for the physicians during the diagnosis.
3.7.1 Exploration of the model devised:
Wrapper approach was the invented method by the proposed model that used best feature subsets for the bladder cancer with small sample size. There were nine sample sets with bladder can- cer and nine without bladder cancer. 13 kinds of gene expression related to bladder cancer, including both oncogenes and tumor suppressor genes were used as examples. Earlier examples used different class index. While Li et al were given a class index be- tween (0.5, 1.5) was at random assigned nine patients who had bladder cancer, another random class index between (-0.5, 0.5) was given to nine normal patients. Also nine patients each with and without bladder cancer were assigned as class 1 and class 2 respectively, by Luudda. Three mutual correlation feature selec- tion methods were included (MC1, MC2, and MC3 for the first, second, and third mutual correlation-based method). Seven gene selection criteria (WTS1 and WTS2 for the two versions of Welch t-statistic, FCS1 and FCS2 for the two versions of Fisher correlation score, ICE for independently consistent expression, MDS for mean difference score, and ADS for average difference score), and the Relief algorithm.
MCI method commences with an empty subset feature and as it progresses it has chooses one feature at a time from the remain- ing features based on the selection criteria. Here feature-feature correlations are considered as well as feature class correlations. MC@ begins with full feature subset and picks one feature at a time from the feature subset to be removed depending on another selection factor. Here only feature-feature correlations are con- sidered. In MC3 method assesses each potential combination based on merit criterion and pick up the one which has highest merit.
IJSER © 2013
International Journal of Scientific & Engineering Research Volume 4, Issue 6, June-2013
ISSN 2229-5518
2905
3.7.2 Observations:
Better results were obtained by three layer feed neural networks and similarity classifier trained by samples. These are selected randomly from small data set that used one single feature. These were tested and their performance was equal or better than the earlier studied. In the earlier studies one needed additional sam- ples while the other used all 13 features. The sliding order of goodness was recorded as 13, 12, 10 and 3.
3.8.1 Exploration of the model devised:
Obstructive Sleep Apnea (OSA) is a sleeping disorder that has regular recurrent breathing suspensions. This causes deep oxy- hemoglobin desaturations, heart rate changes, blood pressure, coriticalarrounsals and increased sympathetic activity [14]. As a result of OSA people suffer from hyper somnolence, Neuro- cognitive dysfunction, metabolic deregulation or respiratory fail- ure. OSA is also connected with the main reasons for mortality in adults, such as hypertension, stroke or myocardial infarction [14]. Estimation says that around 20 percent of adults have low level OSA and seven percent have moderate to severe OSA. The fre- quency is high, though 90 percent of men and 98 percent of women go undiagnosed for years together. OSA can be detected with a help of a very helpful tool called as Nocturnal Pulse Oxi- metry (NPO). The usefulness of NPO has been found after the analyses of a database of blood oxygen saturation (SpO2) record- ings (80 OSA-negative and 160 OSA-positive). Training and test sets were created from the population. The feature extraction stage resulted in 16 features.
The feature selection stage had genetic algorithm stage. 87.5 per- cent precision was obtained in the test set having logistic regres- sion (LR) classifier with less number of corresponding features routinely selected by means of Gas. The outcome improved the diagnostic implementation got by the conventional oximetric indexes used by the physicians. GAs confirmed that it was an efficient and strong tool to look out for necessary features that could improve NPO in the context of OSA diagnosis. To reach the aim the feature selection methodology considered feature subset for a given number of input features starting with 2 to p-1, p stands for the dimension of the original feature space. LR mod- el achieved the highest classification space, with an optimal sub- set defined as the group of input variables.
3.8.2 Observations:
From the Gas from the proposed oximetric feature set composed of time, statistics, frequency statistics, spectral and nonlinear fea- tures an optimal subset was found. M1t, M3t, M4t, MF, PA and CTM were selected. They achieved an accuracy of 90.6 percent sensitivity, 81.3 percent specificity and 87.5 accuracy on an inde- pendent test set. So oximetric feature can be exhaustively investi- gated using the Gas tool, in order to find feature subsets with high diagnostic power. NPO‘s usefulness in the diagnostic as-
sessment of OSA syndrome can be improved by complementary feature extraction plus exhaustive variable selection methodolo- gies that could obtain essential information from SpO2 record- ings.
3.9.1 Exploration of model devised:
The disparity in the diagnosis of erythemato-squamous disease is a complex issue in dermatology. This disease has all features of erythema and scaling. Psoriasis, seboreic dermatitis, lichen planus, pityriasisrosea, chronic dermatitis, and pityriasisrubrapi- laris are the diseases that come in this group. Generally these diseases are detected through biopsy, but these diseases come with many histopathological features also. These diseases are sometimes very difficult to be diagnosed. They may show one feature in the early stage and in later show they may exhibit dif- ferent features altogether. Initially patients were evaluated clini- cally with 12 features. Later skin samples were collected and were tested under 22 histopathological features by analyzing the- se under the microscope. Dataset revealed that family history has value 1 on these diseases. Had these diseases been observed in the family, it was 0 otherwise. Age feature showed the age of the patient. All other features got a degree in the range of 0 to 3. If the feature was not present o was given, and 3 represented the highest amount possible. 1 and 2 were the mid-level values. 34 features were used from the datasets of which six classes of ery- themato-squamous diseases.
IFSFS a hybrid selection method was adopted. First the better score for every single feature is deliberated upon and then they are sorted in descending order. To detect erythematosquamous diseases a selection method IFSFS is used in the SVM based di- agnosis model. Filter method and wrapper method is combined in the hybrid feature selection method. Improved F-score is used an estimation criterion for filter method and SFS is used to assess wrapper method for feature selection to detect the best feature subset. To evaluate classification accuracy SVM is used.
3.9.2 Observations:
Testing has been done on four different segments of erythemato- squamous disease data. The subset that has 21 features showed high level of accuracy (96.65%, 95.83%, 94.44%, and 98.61% for
50–50%, 60–40%, 70–30%, and 80–20% of training-test partition respectively). Looking upon the results it was arrived at a conclu- sion that SVM based model with IFSFS gave excellent results in diagnosing erythemato-squamous diseases.722 samples on chron- ic hepatitis C data set came in from Medical Clinic, University of Medicine and Pharmacy, Cluj-Napoca and Romania. Each had 24 indicators with small number of missing values.
3.10.1 Exploration of the model devised:
An automatic tool [31] which is competent to learn patients data set with 24 medical indicators distinguishing each sample and to
IJSER © 2013
International Journal of Scientific & Engineering Research Volume 4, Issue 6, June-2013
ISSN 2229-5518
2906
consequently use the attain knowledge to single out between five degrees of live fibrosis. Fibro scan is new, non-evasive method where indicators represent clinical interpretations and liver stiff- ness information regarding the medical attributes that trigger some level of liver fibrosis can be found in [31]. The first charac- teristic of this list is stiffness indicator from Fibroscan. Standard hematological and biochemical exams are needed in a person with chronic hepatitis C. Fibrosis with five possible degrees have the following meaning and representatives:
• F0 (nofibrosis)–29examples;
• F1 (portalfibrosis without septa)–227examples;
• F2 (portalfibrosisandfewsepta)–64examples;
• F3 (numerousseptawithoutcirrhosis)–87examples;
• F4 (cirrhosis)–215examples.
This procedure uses the hill climbing algorithm which selects main traits of a precise classification and a center represented by a cooperative co-evolutionary classifier that builds rules for es- tablishing the diagnosis for every new patient. The result of this new method where much better when compared with the ones got from other classification techniques. Also the planned methodol- ogy pulls outs more meaningful characteristics from the available ones. Principal Component Analysis (PCA), one of the common- ly used feature extraction mechanisms is used in this study. Data dimensionality is reduced from 24 to 6 assembled attributes. On applying CCEA to the new data there was an improvement of 1.4 percent from that was achieved through direct application of the original data. This is a major improvement in runtime.
3.10.2 Observations:
Based on selected characteristics the best precision results were got from the average over 30 repeated runs of random cross vali- dation of the CCEA is of 62.11 percent rightly confidential pa- tients. The average accuracy over 1000 fitness evaluations of the hill climber was 55.93 percent and the worst test accuracy was
47.92 percent. For the best accuracy only nine attributes out of 24 were selected, which are stiffness, triglycerides, HDL cholesterol, aspartate amino transferase, gamma-glutamyltranspeptidase, al- kaline phosphatase, prothrombin index, prolonged activated par- tial thromboplastin time and hematocrit.
Research conducted on data mining and on machine learning utilization in medicine and public health specifically on disease predictions offered only synopsis, which explored the usage of knowledge discovery procedures for disease predictions. This knowledge would be used by the medicos and diagnostic centers to add more information to the facts they already know. This arti- cle evaluates the major contributions of data mining and machine
learning research in a set of well-known medical informatics ap- plications. Medical field always calls in for more accuracy. To address this issue researchers and scholars in medical field have created classification techniques and a wealth of feature selec- tion. All these works have prediction accuracy as its prime evalu- ation metric and all models have proven to be successful under the context of selected inputs. How these models are credible with regards to generalized case based reasoning remains a ques- tion. Although these models recognized most necessary subset of characteristics among the various attributes, which in general improve the classifier performance, the implication of the select- ed feature set is to be proved under generalized case based rea- soning. With this conclusion it is clear that significant research is needed to evaluate the importance of predictions. Our research will be carried forward further to increase new knowledge dis- covery methods for precise disease predictions.
[1] Audain, C. 2007. Florence Nightingale. Online: http://www.scottlan.edu/lriddle/women/ nitegale.htm. Accessed 30 July 2009.
[2] Kohn, L. T., Corrigan, J. M., and Donaldson, M. S., to err is human: building a safer health system. Institute of Medicine (IOM). National Academies Press, Washing- ton, 1999
[3] Duen-YianYeh a, Ching-Hsue Cheng b, Yen-Wen Chen
b 2011 A predictive model for Cerebrovascular disease
using data mining‗Science, Vol. 8970-8977.
[4] Cheng-Ding Chang a, Chien-Chih Wang b, Bernard C.
Jiang 2011 Using data mining techniques for multi- diseases prediction modeling of hypertension and Hy-
perlipidemia by common risk factors Vol 38 ,5507–
5513.
[5] M. Anbarasiet. al. 2010 Enhanced Prediction of Heart Disease with Feature Subset Selection using Genetic Algorithm International Journal of Engineering Science and Technology Vol. 2(10), 5370-5376.
[6] ShantakumarB.Patil,Y.S.Kumaraswamy2011.
‗Predictive data mining for medical diagnosis of heart disease prediction‗jyotisoni, ujmaansari, dipeshsharma IJCSE Vol .17,
[7] D.Shanthi,,Dr.G.Sahoo,,Dr.N.Saravanan,2008
‗Designing an Artificial Neural Network Model for the
Prediction of Thrombo-embolic Stroke (IJBB), Volume
3. pp.10-18.
[8] Nightingale, F 1858. Notes on Matters Affecting the Health, Efficiency and Hospital Administration of the British Army.
[9] E.P.Ephzibah,2011 Cost effective approach on feature selection using genetic algorithm and fuzzy logic for di-
abetes diagnosis by International Journal on Soft Com- puting ( IJSC ), Vol.2, No.1.
[10] Tamer Uçar a, AdemKarahocaa 2011‗Predicting exist- ence of Mycobacterium tuberculosis on patients using
data mining approaches‗ Vol .3.
[11] ShantakumarB.Patil 2009 Intelligent and Effective Heart
Attack Prediction System Using Data Mining and Arti-
IJSER © 2013
International Journal of Scientific & Engineering Research Volume 4, Issue 6, June-2013
ISSN 2229-5518
2907
ficial Neural Network ISSN 1450-216X Vol.31 No.4 pp.642-656.
[12] ShantakumarB.Patil and Y.S.Kumaraswamy 2009: Intel- li gent and Effective Heart Attack Prediction System Using Data Mining and Artificial Neural Network, Eu- ropean Journal of Scientific Research ISSN 1450- 216X
Vol.31 No.4, pp. 642-656.
[13] P.K. Anooj 2012 Clinical decision support system: Risk level prediction of heart disease using weighted fuzzy rules Journal of King Saud University – Computer and Information Sciences 24, 27–40, 2011.
[14] Tang KS, Man KF, Kwong S, He Q, "Genetic algo- rithms and their applications", IEEE Signal Process Mag, pg 22–37,1996.
[15] John M. Luk a, Brian Y. Lam a,1, Nikki P.Y. Lee a, Da- vid W. Ho a, Pak C. Sham b, Lei Chen a,c, JirunPeng c,
XishengLeng c, Philip J. Day d, Sheung-Tat Fan 2007
Artificial neural networks and decision tree model anal- ysis of liver cancer proteomes 68–73.
[16] Wilson A., Thabane L., Holbrook A 2003). "Application of data mining techniques in pharmacovigilance". Brit- ish Journal of Clinical Pharmacology. (57) 2, 127-134.
[17] Witten, I. H. and Frank, E. Data mining : practical ma-
chine learning tools and techniques. Morgan Kaufmann series in data management systems. Morgan Kaufman
2005.
[18] Shital Shah, Andrew Kusiak 37 2007Cancer gene search with data-mining and genetic algorithms 251 – 261.
[19] An intelligent model for liver disease diagnosis 2009
Rong-Ho Lin Department of Industrial Engineering and Management, National Taipei University of Technolo- gy, Artificial Intelligence in Medicine 47, 53—62.
[20] Pogorelc, B.; Gams, M.; , "Medically Driven Data Min- ing Application: Recognition of Health Problems from Gait Patterns of Elderly," Data Mining Workshops (ICDMW), 2010 IEEE International Conference on , vol., no., pp.976-980, 13-13 Dec. 2010
[21] Huidong Jin; Jie Chen; Hongxing He; Kelman, C.; McAullay, D.; O'Keefe, C.M.; , "Signaling Potential Adverse Drug Reactions from Administrative Health Databases," Knowledge and Data Engineering, IEEE Transactions on , vol.22, no.6, pp.839-853, June 2010
[22] JianXu; Maynard-Zhang, P.; Jianhua Chen; , "Predictive Data Mining to Learn Health Vitals of a Resident in a Smart Home," Data Mining Workshops, 2007. ICDM
Workshops 2007. Seventh IEEE International Confer- ence on , vol., no., pp.163-168, 28-31 Oct. 2007
[23] H. Witten and Eibe Frank, Data Mining: Practical ma- chine learning tools and techniques, 2nd Edition, Mor- gan Kaufmann, San Francisco, 2005.
[24] Ng, K.S.; Shan, Y.; Murray, D.W.; Sutinen, A.;
Schwarz, B.; Jeacocke, D.; Farrugia, J.; , "Detecting Non-compliant Consumers in Spatio-Temporal Health Data: A Case Study from Medicare Australia," Data Mining Workshops (ICDMW), 2010 IEEE International Conference on , vol., no., pp.613-622, 13-13 Dec. 2010
[25] J. Rogers; C. Puleston; A. Rector; , "The CLEF Chroni- cle: Patient Histories Derived from Electronic Health
Records," Data Engineering Workshops, 2006. Proceed- ings. 22nd International Conference on , vol., no., pp.x109, 2006
[26] Weed LI (1969) Medical records medical education, and patient care. The problem-oriented record as a basic tool. Cleveland, OH: Case Western Reserve University
[27] Hui-Ling Chen, Bo Yang, Jie Liu, Da-You Liu, A sup- port vector machine classifier with rough set-based fea- ture selection for breast cancer diagnosis, Expert Sys- tems with Applications, Volume 38, Issue 7, July 2011,
Pages 9014-9022, ISSN 0957-4174,
10.1016/j.eswa.2011.01.120.
[28] T. Warren Liao, Diagnosis of bladder cancers with small sample size via feature selection, Expert Systems with Applications, Volume 38, Issue 4, April 2011, Pages
4649-4654, ISSN 0957-4174,
10.1016/j.eswa.2010.09.135.
[29] Daniel Álvarez, Roberto Hornero, J. Víctor Marcos, Félix del Campo; Feature selection from nocturnal oxi- metry using genetic algorithms to assist in obstructive sleep apnoea diagnosis; Medical engineering & physics
1 October 2012 (volume 34 issue 8 Pages 1049-1057
DOI: 10.1016/j.medengphy.2011.11.009)
[30] JuanyingXie, Chunxia Wang, Using support vector ma- chines with a novel hybrid feature selection method for diagnosis of erythemato-squamous diseases, Expert Sys- tems with Applications, Volume 38, Issue 5, May 2011, Pages 5809-5815, ISSN 0957-4174,
10.1016/j.eswa.2010.10.050.
[31] CatalinStoean, RuxandraStoean, Monica Lupsor, Hori- aStefanescu, RaduBadea; Feature selection for a cooper- ative coevolutionary classifier in liver fibrosis diagnosis; Computers in biology and medicine 1 April 2011 (vol- ume 41 issue 4 Pages 238-246
[32] Murat Karabatak a, M. CevdetInce b, 36 2009 An expert system for detection of breast cancer based on associa- tion rules and neural network 3465–3469.
[33] B.M. Patil, R.C. Joshi, DurgaToshniwal 2010 Hybrid prediction model for Type-2 diabetic patients 8102–
8108
[34] L. G. Kabari and F. S. Bakpo,Diagnosing 2009 Skin
Diseases Using an Artificial Neural Network 978-1-
4244-3523-4/09/ IEEE.
[35] Garcia, Mario A. et al. (2001), ESDIABETES (AN EX- PERT SYSTEM IN DIABETES), CCSC: South Central Conference, JCSC 16, 3 (March 2001) © by the Consor- tium for Computing in Small Colleges, 166--175.
[36] Keles, Ali. Keles, Ayturk. Yavuz, Ugur. (2011), Expert System Based on Neuro-Fuzzy Rules for Diagnosis Breast Cancer, Expert Systems with Applications, 38,
5719—5726.
[37] Adeli, Ali. Neshat, Mehdi. (2010), A Fuzzy Expert Sys- tem for Heart Disease Diagnosis, International Multi Conference of Engineers and Computer Scientists 2010
Vol. I, Hong Kong.
[38] Fazel-Zarandi, M.H. et al. (2010), A Fuzzy Rule-Based Expert System for Diagnosing Asthma, Transaction E: Industrial Engineering, Vol. 17, No. 2, 129-142.
IJSER © 2013
International Journal of Scientific & Engineering Research Volume 4, Issue 6, June-2013
ISSN 2229-5518
2908
[39] Singh, Tripty. et al. (2010), Expert System Design and Analysis for Breast Cancer Diagnosis, International Journal of Engineering Science and Technology, Vol. 2, No. 12, 7491-7499.
[40] Zolnoori, Maryam. et al. (2010), Fuzzy Rule-Base Ex- pert System for Evaluation Possibility of Fatal Asthma, Journal of Health Informatics in Developing Countries,
171-184
[41] Akter, Morium. ShorifUddin, Mohammad. Haque, Aminul. (2009), Diagnosis and Management of Diabetes Mellitus through a Knowledge-Based System, ChweeTeck Lim, James C.H. Goh (Eds.), 23, 1000–
1003.
[42] Karabatak, Murat. CevdetInce, M. (2009), An expert system for detection of breast cancer based on associa- tion rules and neural network, Expert Systems with Ap- plications, 36, 3465–3469.
IJSER © 2013