International Journal of Scientific & Engineering Research, Volume 4, Issue 12, December-2013 1609
ISSN 2229-5518
Consumer Load Prediction and Theft Detection on Distribution Network Using Autoregressive Model
Ayodele Isqeel Abdullateef*, Momoh-Jimoh Eyiomika Salami, Mohamud Ahmed Musse, Mobolaji Agbolade Onasanya
—————————— ——————————
IJSER
OAD prediction is an important factor employed in the management of power system. It facilitates the estimation of future electricity demand by the utilities based on the
past records, thus helps the utilities in decision making and operational planning such as routine maintenance, dispatch of generators, management of fuel and development of infra- structure. Moreover, it influences the consumers’ decision in the management of energy such as load shedding and control of peak loads [1]. In the last decade, very short term load fore- casting (VSTLF) which predicts load consumption from few minute to several hours has been proposed [2]. VSTLF is used in energy management for load frequency control, dispatch functions and areas that need forecast for short time leads Parameters such as the historical load data, weather data and seasonal data are the common input in load forecasting. How- ever, instead of modeling the relationships between these var- iables, as in other types of load prediction, VSTLF extrapolates the recently observed load pattern to the nearest future [3].
————————————————
• A.I. Abdullateef is with Yaba College of Technology, Yaba, Lagos, Nigeria and a PhD candidate at International Islamic University Malaysia, Malay- sia (+60166425861; e-mail: isqeel@hotmail.co.uk).
• M.J.E. Salami is a Professor at the Department of Mechatronics Engineer-
ing at International Islamic University Malaysia, Malaysia. (e-mail:
momoh@iium.edu.my).
• M.A. Musse is an Associate Professor with the Electrical and Computer
Engineering Department, International Islamic University Malaysia,
Malaysia (e-mail: mussemoh@gmail.com).
• M.A.Onasanya is with Electrical Department Yaba College of Technology,
Yaba, Lagos, Nigeria. (e-mail: beejayng@yahoo.co.uk)
VSTLF relied on real time data to predict future energy demand
therefore, if it is employed at the consumer end it will facilitate the prediction of consumer load for few minutes step ahead and benchmarking this with actual load consumed will facilitate the detection of electricity theft.
Electric load forecasting is currently restricted to energy management at generation and transmission level, but this has not been used to monitor the energy consumption of individ- ual consumer connected to the distribution network. The con- ventional practice is to predict the energy loads based on the history of consumers’ energy load data obtained over a period. These data are short of revealing individual consumer energy pattern which is essential in order to monitor consumers’ ac- tivities such as electricity theft on the distribution network. The consequences of electricity theft has been well reported in terms of enormous loss of revenue, properties and lives on the part of the energy providers and consumers [4], [5], [6], [7], [8], [9]. The increasing prevalence of this menace has attracted attention although, it largely remains unabated despite vari- ous proposed methods for detecting and eliminating theft on the power network [10], [11], [12]. Thus, the need for a new method of detection to prevent and minimize these adverse impacts of electricity theft has attracted the interest of this study.
Load prediction as a tool for electricity theft detection has
hardly been reported in the literatures, therefore this paper
presents a novel 5-minutes step ahead consumer load predic-
tion and theft detection using autoregressive model of time
series technique.
Various techniques of predicting electricity load have been
IJSER © 2013 http://www.ijser.org
International Journal of Scientific & Engineering Research, Volume 4, Issue 12, December-2013 1610
ISSN 2229-5518
reported, however the techniques on very short term load prediction are limited. One of these techniques is statistical method which include multiple linear regression, exponential smoothing, time series, state space, and Kalman filter tech- niques [13]. Taylor [14] evaluated various methods of very short term load prediction between 10 and 30 minutes ahead using minute-by-minute British electricity demand load data. The study considered methods that capture both the intra-day and the intra-week seasonal cycles in the data. Similarly, the methods that do not attempt to model the seasonality were considered. The best results were achieved using the Holt- Winters' adaptation and the new intra-day cycle exponential smoothing method for very short-term prediction. Singh, et al. [15] proposed seasonal autoregressive moving average (SAR- MA) for home peak load and the study noted that ability to predict the stochastic activities of the consumer and routines are more significant for home load prediction. Furthermore, the study showed that historical based features are more effec- tive than physical features such as temperature and time when hourly prediction is intended and a root mean square error of
30% accuracy was achieved.
Weekday based prediction model for electricity load fore-
casting using autocorrelation feature selection and machine
learning algorithm, proposed by Koprinska, et al. [16], are
considered as global model that predicts the load for all days
berger–Procaccia algorithm and least squares regression methods to obtain the value of correlation dimension for esti- mation of the model order. Based on this order, an appropri- ately structured FNS model was designed for the prediction of electric load and a dimension switching detector was devised to enhance the prediction performance of the FNS as well as to reduce the practical influences of the computation error on correlation dimension estimation. Load data from Shandong Heze Electric Utility, China was used for the experiment and satisfactory results are obtained for 15 min ahead prediction. A hybrid model of similar day and neural network for load forecast ranging from 15 minutes to few hours was proposed by Fok and Vai [24]. Hourly weather information which is not often considered in other VSTLF literatures was considered as one of input variables, while the results of VSTLF was used to adjust a day ahead STLF result which reduces the MAPE to
20%.
Charytoniuk and Chen [3] proposed load prediction up to
dozen of minute based on ANN model and the forecasting
was implemented as a set of neural networks to assure robust
performance and training for on-line applications. Each net-
work was assigned a task of predicting loads for a particular
time lead and for a certain period of day with a unique pattern
in load dynamics. This method has been implemented in a
power utility in USA. Particle swarm optimization (PSO)
IJSER
of the week and local model that predict load for each day of
the week. The two models were used to analyze a 5-minute
electricity data obtained within two years from the State of
New South Wales in Australia and the performances of the
models were relatively good. However, local model performs
better when used with linear regression algorithm and accura-
cy of 0.282% was obtained using the mean absolute percentage
error (MAPE) criterion. Trudnowski, et al. [17] proposed a
strategy for developing a very short-term load predictor using
slow and fast Kalman estimators and an hourly forecaster
load prediction for power system automatic generation con- trol. The Kalman model parameters were determined by matching the frequency response of the estimator to load re- siduals. The design strategy was applied to a power system
operated by the Bonneville Power Administration.
The other technique to VSTLF is the application of various
artificial intelligent paradigms such as artificial neural net-
work (ANN), fuzzy logic (FL) and knowledge based expert
systems [18], [19], [20], [21]. A method of very short-term
loads forecasting using wavelet neural networks with data
pre-filtering 1-h into the future in 5-min steps proposed by
Guan, et al. [22] used spike filtering technique to detect spikes
in load data. The method removes spikes in real-time from the data before the load is decomposed into multiple components at different frequencies, where separate neural networks are applied to capture the features of individual components.
Based on the results, 12 dedicated wavelet neural networks were used to form the final forecasts and data from ISO New England used for testing shows accurate predictions with small standard deviations.
Yang, et al. [23] proposed fuzzy neural system (FNS) for very-short-term electric load prediction based on chaotic dy- namics reconstruction technique. The study applied Grass-
based fuzzy inference method was applied to enhance the per-
formance of a fuzzy system in prediction of building energy
consumption [18]. The PSO algorithm was employed to opti-
mize the fuzzy system’s membership function while the
scheme was used for identification of fuzzy models from the
input-output data. The results obtained demonstrate that the
developed model has better prediction scheme capabilities
than a conventional fuzzy model for the same system with
heuristically defined membership functions.
Detailed review of several techniques proposed and devel-
oped by various researchers for the detection and estimation of electricity theft have been reported by Abdullateef, et al. [25]. Automatic meter reading system incorporated with tam- pering detection and various communication media such as
Global System for Mobile Communications (GSM) and Zigbee, have been proposed to track electricity theft [26], [27], [28]. Similarly, other researchers such as Nagi, et al. [29], Wang and Devabhaktuni [30] and Nizar and Dong [7] have repoted the application of Artificial Intelligent System (AIS) such as Sup- port Vector Machine (SVM) for the detection of electricity theft based on the energy consumption pattern of the consumer.
In addition, the power line impedance technique proposed by Pasdar and Mirzakuchaki [12] considers the difference be- tween network impedance and installed impedance which indicates electricity theft location with respect to the location of legitimate consumer. Bandim, et al. [10] proposed a central observer meter (COM) to monitor and identify the perpetra- tors while the method proposed by Cavdar [31], uses two en- ergy meters to track illegal connection. Meter tampering detec- tion based on changes between live and neutral currents as well as voltage monitoring at the meter input terminals has been proposed by Naiman, et al. [32] to depict electricity theft. The injection of unwanted harmonics into the distribution
IJSER © 2013 http://www.ijser.org
International Journal of Scientific & Engineering Research, Volume 4, Issue 12, December-2013 1611
ISSN 2229-5518
network in order to cause damage to the appliances of the suspected illegal users and application of smart resistance in- corporated in smart meter as a mode of detecting illegal elec- tricity usage, have been reported by Bat-Erdene, et al. [11] and Kadurek, et al. [33] respectively.
In this study, the energy consumed by a typical household was monitored and predicted based on data acquired from the Consumer Load Monitoring Prototype (CLMP) developed by
(AR), moving average (MA) model and autoregressive moving average model (ARMA).
The current value of the time series y(n) is expressed linearly in terms of its previous values and a white noise ε(n) in the autoregressive process, so that
p
Abdullateef, et al. [34]. Electricity consumption and theft sce- nario were imitated, while the theft detection was based on
y(n) = −∑ ak y(n − k ) + ε (n)
k =1
(2)
comparison between the predicted and theft data coefficients using the autoregressive (AR) model.
where a1 , . . . , ap are the coefficients or weights to be deter- mined, p is the model order and ε(n) is the white noise with
zero mean and variance σ2. In the same manner, (2) is also re- ferred to a “forward prediction”. Similarly, the backward pre- diction is of this form
p
yˆ (n − 1) = −∑ bk
y(n − k + 1)
(3)
The data used in this study were acquired from the Consumer
Load Monitoring Prototype (CLMP) constructed at the Mecha-
tronic Laboratory, International Islamic University Malaysia,
for the purpose of studying electricity theft. The construction
details and data acquisition procedure have been well-
explained and presented [34]. Data obtained for a typical
weekday representing both normal and theft situation was
k =1
Various techniques such as covariance, Burg, Least Square and autocorrelation, have been used to estimate the coefficients of AR model in (2) [38]. In particular, estimation of AR coeffi- cients is often based on solving Yule-Walker equations as epressed in Eq. (4) and in matrix form as in (5).
p
used.
∑ ak
rxx
(l − k ) = −rkx
(l ) ;
k = 1, 2, . . . p
(4)
IJSER
The CLMP was connected to power source and appliances
k =1
such as refrigerator, incandescence bulb (100W), fluorescence
rxx (0)
rxx (−1)
rxx (−2)
...
rxx (1 − p) a1
rxx (1)
lamp (80W), table fan (40W), electric kettle (1500W), induction
rxx (1)
rxx (0)
rxx (−1)
...
rxx (2 − p)a2
rxx (2)
cooker (1800W), microwave oven (700W), and electric iron . . .
. .
. (5)
(1000W) were connected to the CLMP, to represent a real life .
. . ...
. . = − .
situation of typical consumer house hold electricity consump-
. . .
. .
.
tion. Current sensor (ACS785, Allegro MicroSystem Inc., USA)
r ( p − 1)
r ( p − 2)
r ( p − 3)
r (0)
was connected to the live conductor to capture the current consumed by the loads connected to the prototype. The sensor
xx xx xx
xx a p
rxx ( p)
provides galvanic isolation within the power network particu- larly, between the operator and other equipment connected to
Concisely, (5) is expressed as
it. Data acquisition was carried out via LABVIEW hardware
(National Instrument, USA) device linked to the PCI 6420E
Rp a p
= − rp
and
(6)
channel in the computer. The data acquired at a sampling fre-
2 ×10 −3
a = − r R−1
(7)
quency of 500Hz at
s interval were logged directly into
The coefficients ap is estimated by solving (7).
the computer which displays the processes in real time and
were stored for further analysis.
Linear prediction is a time series analysis technique that has been applied in speech signal processing, image processing and in communication [35], [36], [37]. It is based on the estima- tion of a signal from its present and past output samples. Time series data acquired from the CLMP is assumed to be generat- ed from a linear filter excited by a white noise which can be expressed as
Optimum model order determination has been one of the chal- lenges in linear prediction and time series modelling. General- ly, in the evaluation of several model orders, the most appro- priate is selected based on certain criteria such as Final Predic- tion Error (FPE), Akaike Information Criterion (AIC), Hannan- Quinn Information Criterion (HQC) and Schwaez Information Criterion (SIC), respectively, [39], [40], [41], [42], [43]. Despite wide application of the criteria as indicators of model order
p q selection, their accuracies are relatively low [38].
y(n) = −∑ ak y(n − k ) + ∑ bi x(n − i)
(1)
k =1
i =0
The final prediction error is a technique of selecting the model
where y(n) and x(n) are the output and input signals respec-
tively, while ak, b i , p, and q are the system parameters. Analy- sis of (1) leads to three different models: autoregressive model
order by minimising the variance of the prediction error. FPE
selects the system model order so that the average error vari-
IJSER © 2013 http://www.ijser.org
International Journal of Scientific & Engineering Research, Volume 4, Issue 12, December-2013 1612
ISSN 2229-5518
ance for a one-step prediction is minimised [41], [44] and this is represented mathematically as
2 N + p
![]()
FPE( p) = σ p
(8)
The average current (amp) acquired from the appliances con-
N − p
when the sample mean is subtracted from the signal then (8) is adjusted as
N + p + 1
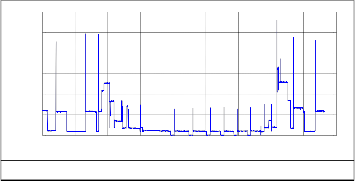
nected to the circuit at 10s interval for 24 hours is shown in
Fig. 1. The spikes ‘a-c’ and ‘m-o’ indicate the starting of the
refrigerator and the air conditioner loads during the morning and night respectively while spikes ‘d-l’ are due to the refrig-
erator starting point during the day. This is as a result of the![]()
FPE( p) = σ 2
(9)
where σ 2
N − p − 1
is the estimated error variance of the model, N is
single phase induction motor that drives the compressor,
which is the major component that consumes energy in the
refrigerator and air conditioner. The induction motor takes six
the number of data points, and p is the model order expressed as
to ten times its running current value at starting point [47].
Average 1-Day Current Consumption
N 30
2 2 m
and![]()
σ p = ∑ε p (n)
N n =1
= 1,2 ,3, . . . N )
(10)
25 b c n o a
20
ε p = x p
(n) − ~x
(n)
(11)
If M is the maximum model order that could be obtained, evaluating p from 1 to M increases the model orders (8) and 5 this increases the uncertainty of the estimate of the predicted
d e f g h i
j k l
error variance. The optimum model order is the one that gives the minimum value of FPE (p), 1≤ p ≤M.
0 1000 2000 3000 4000 5000 6000 7000 8000 9000
Time (s)
Fig. 1 . Average current acquired in 24hours
The Akaike Information Criterion (AIC) is mathematically
expressed as
The average load consumption per day at 5min interval is de-
picted in Fig. 2. There was an increase in load consumption
AIC ( p) = NIn(σ 2 ) + 2 p
(12)
between the 285th and 370th minute as well as 1195th and
1280th minute with the peaks equivalence of 0.2156 kWh and
The term ‘2p’ represents the penalty for higher order selection
that does not change in substantial reduction in the prediction
error variance of the model. The inconsistency in model order
estimation under this method has been reported by Kashyap
[45], although, it is popularly used in model estimation. The
performance of FPE and AIC model order selection methods is
similar; however, AIC method is recommended for short data
Ulrych and Ooe [46].
Hannan and Quinn criterion technique is expressed as shown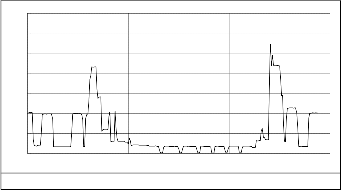
0.273 kWh, respectively. These developments indicate early morning and late evening energy demands by the consumer. However, the load consumption between 500th and 1155th minutes is relatively low and stable at 0.017kWh. This depicts the absence of the occupant at home and during this period, most appliances were switched off except the refrigerator. Fur- thermore, night and early morning electricity consumption with respect to the air conditioners ON and OFF cycle throughout the night is shown between 1st and 284th minutes as well as 1280th and 1440th minutes.
Actual Energy Consumption per day
in (13). HQC counteracts the over fitting nature of AIC.
0.35
![]()
HNQ( p) = In(σ 2 ) + 2 pIn(InN )
(13)
0.3
p N 0.25
Minimum description length (MDL) was developed to correct the irregularity associated with the FPE and AIC methods and is represented mathematically as
0.2
0.15
0.1
0.05
MDL( p) = NIn(σ 2 ) + pIn( N )
(14)
0
0 500 1000 1500
Time (minute)
This increases the penalty factor incurred by using higher or- der as compare to AIC, thus favouring the selection of lower model order and it has been proven to be consistent statistical- ly [44]. Equations 8, 10, 12, 13, and 14 were applied in this study to select appropriate model order for the AR model.
Fig. 2 . Energy Consumption in 24- hour
Fig. 3(a-d) depicts the model order selection criteria graphs, according to the order selection criteria discussed in section
3.4. Fig. 3a shows the MDL criterion graph with a sharp fall
IJSER © 2013 http://www.ijser.org
International Journal of Scientific & Engineering Research, Volume 4, Issue 12, December-2013 1613
ISSN 2229-5518
in the order and the minimum order occur at 20. It later picked up sharply and increases linearly as the order increased. The AIC graph (Fig. 3b) shows that the fall in the order is gradual and the minimum order occurs at 50. The model order was constant between 50 and 110 after which it increased gradual- ly to the end. The minimum order according to HQC is 40 as depicted in Fig. 3c, there is a sharp fall in the order which later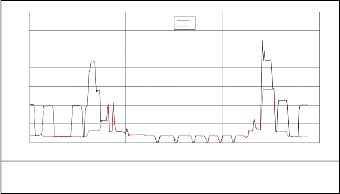
are shown in Table 1. However, the consumed energy is the same between 375th and 1195th minute during the day which indicates normal condition hence the two graphs look the same.
Consumer Actual and Registered Energy Consumption per day
0.35
a b
increased steadily from 40 to the end. Fig. 3d shows the FPE
with an exponential fall in the model order as the error is min-
imised. Although the error decreases as the order increases,
however the error is virtually constant from 50 to the end with
no significant changes. Hence the minimum can be estimated at order 50. The outcome of the model selection criteria indi- cate that MDL with minimum order of 20 is preferable com- pared to others which indicates higher model order. This justi-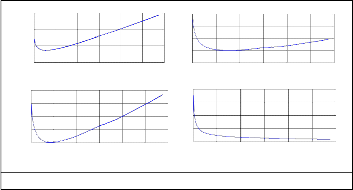
fies higher penalty placed on this criteria according to session.
0.3
0.25
0.2
0.15
0.1
0.05
0
0 500 1000 1500
Time (minute)
Fig. 5 . Comparison between 24-hour actual and regis- tered energy consumption
500
Minimum Description Length
-200
Akaike Information Criterion
0
-500
-400
-600
-800
-1000
0 50 100 150 200 250 300
Model order
Hannan and Quinn
-1000
![]()
0 50 100 150 200 250 300
Model order
Final Prediction Error
(a) (b)
-0.5
-1
-1.5
-2
-2.5
0.4
0.3
0.2
0.1
0
0 50 100 150 200 250 300
Model order
0 50 100 150 200 250 300
Model order
(c) (d)
Fig. 3. Model order selection criteria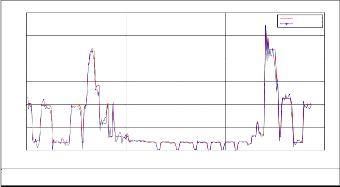
The consumer energy load prediction which is depicted by Fig. 4 shows the actual load and the predicted load based on model order 20 of MDL criterion. The dotted line indicates the predicted energy consumption while the continuous line spec- ifies the actual energy consumption.
0.3
0.25
Consumer load prediction based on model order 20 of MDL criterion
Actual data
Predicted data
0.2
0.15
0.1
0.05
0
0 500 1000 1500
Time (minute)
Fig. 4 . 24-hour consumer load prediction
Fig. 5 shows the graph of two energy data where ‘a’ indicates the actual energy consumed and ‘b’ shows the energy con- sumed as recorded by meter. It was observed that there are disparities in energy consumption between the 1st and the
375th minute, and between 1195th and 1440th minute. The variation is as a result of electricity theft carried out between these periods. These disparities are detected by the variance in the model coefficients and the registered load data coefficients
Prediction of consumer electricity load consumption using autoregressive model approach has been achieved in this study. Data were acquired at 500Hz sampling frequency over a period of 24h and average power consumption was comput- ed over this period. A 5-minute step ahead consumer load prediction based on the data acquired was achieved using model order 20 of minimum description length criterion tech-
IJSER © 2013 http://www.ijser.org
International Journal of Scientific & Engineering Research, Volume 4, Issue 12, December-2013 1614
ISSN 2229-5518
nique. The predicted load was used for the detection of elec- tricity theft when the coefficients of the model varied in com- parison with the coefficients of the theft data. This study is ongoing and further advanced signal analysis will be carried out in our future work to classify the theft.
[1] E. A. Feinberg and D. Genethliou, "Load forecasting," in Applied
mathematics for restructured electric power systems, J. H. Chow, F. F. Wu, and J. Momoh, Eds., ed US: Springer, 2005, pp. 269-285.
[2] H. Chen, K. Huang, and L. Chang, "Application of neural networks for very short-term load forecasting in power systems," in Advances in Neural Networks–ISNN 2005, W. Jun, L. Xiao-Feng, and Y. Zhang, Eds., ed Berlin Heidelberg: Springer, 2005, pp. 628-633.
[3] W. Charytoniuk and M.-S. Chen, "Very short-term load forecasting using artificial neural networks," Power Systems, IEEE Transactions on, vol. 15, pp. 263-268, 2000.
[4] Stabrokernew. (2012, April 1). Electricity theft jumps in Jamaica.
Available:
http://www.azcentral.com/news/articles/2009/03/16/20090316gan-
%20powertheft16-ON.html?%20nclick_check&nclick_check=1
[5] J. McShan. (2010, May 18). Electricity theft: Dangerous trend that's costing honest Houstonians money. Available: http://www.khou.co m/news/crime/Electricity-theft-a-dangerous- trend-that s-cost ing-honest-Houstonians-money-92450694.html
Włodzisław, É. Péter, M. Francesco, and P. Günther, Eds., ed Berlin
Heidelberg: Springer, 2012, pp. 33-41.
[17] D. J. Trudnowski, W. L. McReynolds, and J. M. Johnson, "Real-time very short-term load prediction for power-system automatic generation control," Control Systems Technology, IEEE Transactions on, vol. 9, pp. 254-260, 2001.
[18] C. O. Adika and L. Wang, "Short term energy consumption prediction using bio-inspired fuzzy systems," in North American Power Symposium (NAPS), Champaign, 2012, pp. 1-6.
[19] W. Yan, "Toward automatic time-series forecasting using neural networks," Neural Networks and Learning Systems, IEEE Transactions on, vol. 23, pp. 1028-1039, 2012.
[20] N. Sapankevych and R. Sankar, "Time series prediction using support vector machines: a survey," Computational Intelligence Magazine, IEEE, vol. 4, pp. 24-38, 2009.
[21] E. Diaconescu, "The use of NARX neural networks to predict chaotic time series," WSEAS Transactions on Computer Research, vol. 3, pp.
182-191, 2008.
[22] C. Guan, P. B. Luh, L. D. Michel, Y. Wang, and P. B. Friedland, "Very Short-Term Load Forecasting: Wavelet Neural Networks With Data Pre-Filtering," Power Systems, IEEE Transactions vol. 28, pp. 30 -
41 2013.
[23] H. Y. Yang, H. Ye, G. Wang, J. Khan, and T. Hu, "Fuzzy neural very- short-term load forecasting based on chaotic dynamics reconstruction," Chaos, Solitons & Fractals, vol. 29, pp. 462-469, 2006.
[24] C. Y. Fok and M. I. Vai, "Very Short Term Load Forecasting for
IJSER
[6] L. Babirye. (2012, April 3). Six killed in illegal electricity connections
![]()
![]()
Available: http://www.newvision.co.ug/news/633444-six-killed-in- illegal-electricity-connections.html
[7] A. Nizar and Z. Dong, "Identification and detection of electricity customer behaviour irregularities," Seattle, WA, 2009, pp. 1-10.
[8] S. S. S. R. Depuru, L. Wang, V. Devabhaktuni, and N. Gudi, "Measures and setbacks for controlling electricity theft," in North American Power Symposium (NAPS), Texas, 2010, pp. 1-8.
[9] N. Cheng Yee, A. A. Zuhirin, and A. Raman, "Tenaga Nasional Berhad (TNB) Cheng TNB losing RM500mil a year to electricity theft " in The Star Newspaper ed. Malaysia, 2010.
[10] C. Bandim, J. Alves Jr, A. Pinto Jr, F. Souza, M. Loureiro, C.
Magalhaes, et al., "Identification of energy theft and tampered meters using a central observer meter: a mathematical approach," in Transmission and Distribution Conference and Exposition, Rio de Janerio, 2003, pp. 163-168.
[11] B. Bat-Erdene, S. Y. Nam, and D. H. Kim, "A Novel Remote Detection Method of Illegal Electricity Usage Based on Smart Resistance," in Future Information Technology, J. J. Park, L. T. Yang, and C. Lee, Eds., ed Berlin Heidelberg: Springer, 2011, pp. 214-223.
[12] A. Pasdar and S. Mirzakuchaki, "A solution to remote detecting of illegal electricity usage based on smart metering," in 2nd International Workshop on Soft Computing Applications (SOFA), Oradea, 2007, pp. 163-167.
[13] H. K. Alfares and M. Nazeeruddin, "Electric load forecasting: literature survey and classification of methods," International Journal of Systems Science, vol. 33, pp. 23–34, 2002.
[14] J. W. Taylor, "An evaluation of methods for very short-term load forecasting using minute-by-minute British data," International journal of forecasting, vol. 24, pp. 645-658, 2008.
[15] R. P. Singh, P. X. Gao, and D. J. Lizotte, "On hourly home peak load prediction," in Third International Conference onSmart Grid Communications (SmartGridComm), Tainan, 2012, pp. 163-168.
[16] I. Koprinska, M. Rana, and V. G. Agelidis, "Electricity load forecasting: a weekday-based approach," in Artificial Neural Networks and Machine Learning–ICANN 2012, E. V. Alessandro, D.
Macau Power System," in Intelligent Computing Technology, H. De-
Shuang, J. Changjun, B. Vitoantonio, and C. F. Juan, Eds., ed Berlin
Heidelberg: Springer, 2012, pp. 538-546.
[25] A. I. Abdullateef, M. J. E. Salami, I. B. Tijani, and M. A. Onasanya, "Novel technique for detecting electricity theft on low voltage distribution network," in Proceeding of National conference of electrical and electronics engineering, Johor, 2012, pp. 199-204.
[26] G. Zheng, Y. Gao, and L. Wang, "Realization of Automatic Meter
Reading System Based on ZigBee with Improved Routing Protocol," in Power and Energy Engineering Conference (APPEEC), Chengdu,
2010, pp. 1-6.
[27] G. Fuxiang, X. Wenxin, and L. Langtao, "Overview on remote meter reading system based on GPRS," in 2nd International Conference on Industrial and Information Systems (IIS), Dalian, 2010, pp. 270-273.
[28] H. G. R. Tan, C. Lee, and V. Mok, "Automatic power meter reading system using GSM network," in International Power Engineering Conference (IPEC), Singapore, 2007, pp. 465-469.
[29] J. Nagi, K. Yap, S. Tiong, S. Ahmed, and A. Mohammad, "Detection of abnormalities and electricity theft using genetic support vector machines," in TENCON 2008-2008 IEEE Region 10 Conference, Hyderabad 2008, pp. 1-6.
[30] L. Wang and V. Devabhaktuni, "Support vector machine based data classification for detection of electricity theft," in Power Systems Conference and Exposition (PSCE), Phoenix, AZ, 2011, pp. 1-8.
[31] I. H. Cavdar, "A solution to remote detection of illegal electricity usage via power line communications," Power Delivery, IEEE Transactions on, vol. 19, pp. 1663-1667, 2004.
[32] S. Naiman, M. Kissaka, and N. Mvungi, "Energy meter reading and tampering protection through powerline communication channel," in 7th AFRICON Conference in Africa, 2004, pp. 821-826.
[33] P. Kadurek, J. Blom, J. Cobben, and W. Kling, "Theft detection and smart metering practices and expectations in the Netherlands," in Innovative Smart Grid Technologies Conference Europe (ISGT ), Gothenburg 2010, pp. 1-6.
[34] A. I. Abdullateef, M. J. E. Salami, M. A. Musse, M. A. Onasanya, and
M. I. Alebiosu, "New consumer load prototype for electricity theft
IJSER © 2013 http://www.ijser.org
International Journal of Scientific & Engineering Research, Volume 4, Issue 12, December-2013 1615
ISSN 2229-5518
monitoring.," presented at the International conference on mechatronics Kuala Lumpur, 2013.
[35] J. Makhoul, "Linear prediction: A tutorial review," Proceedings of the
IEEE, vol. 63, pp. 561-580, 1975.
[36] A. Ó. Cinnéide, "Linear prediction: The technique, its solution and application to speech," Dublin Institute of Technology, Online PDF, http://eleceng. dit. ie/papers/92. pdf, 2008.
[37] J. G. Proakis and D. G. Manolakis, Digital signal processing: Principles,
algorithms, and applications: Prentice Hall (Upper Saddle River, NJ),
1996.
[38] M. Hayes, Statistical digital signal processing and modeling: John Wiley
& Sons (New York), 1996.
[39] H. Akaike, "A Bayesian extension of the minimum AIC procedure of autoregressive model fitting," Biometrika, vol. 66, pp. 237-242, 1979.
[40] H. Akaike, "Information theory and an extension of the maximum likelihood principle," in Second international symposium on information theory, 1973, pp. 267-281.
[41] H. Akaike, "Fitting autoregressive models for prediction," Annals of the institute of Statistical Mathematics, vol. 21, pp. 243-247, 1969.
[42] E. J. Hannan and B. G. Quinn, "The determination of the order of an autoregression," Journal of the Royal Statistical Society. Series B (Methodological), vol. 41, pp. 190-195, 1979.
[43] G. Schwarz, "Estimating the dimension of a model," The annals of statistics, vol. 6, pp. 461-464, 1978.
[44] S. L. Marple Jr, "Digital spectral analysis with applications,"
Englewood Cliffs, NJ, Prentice-Hall, Inc., 1987, 512 p., vol. 1, 1987.
[45] R. Kashyap and R. Chellappa. "Stochastic models for closed
![]()
boundary analysis: Representation and reconstruction." Information
Theory, IEEE Transactions on 27(5): 627-637, 1981
[46] M. Ooe, and T. J. ULRYCH. "Minimum Entropy Deconvolution with
![]()
AN Exponential TRANSFORMATION*." Geophysical Prospecting
27(2): 458-473, 1979.
[47] J. Gupta, Theory & Performance Of Electrical Machines, 14 ed. Delhi: SK Kataria & Sons, 2009.
IJSER © 2013 http://www.ijser.org