International Journal of Scientific & Engineering Research, Volume 6, Issue 4, April-2015 172
ISSN 2229-5518
Constant Market Share Analysis for Exports of
Pakistan: Case of Developed Market Economies
Arsalan Ahmed, Dr Shahida Wizarat
Abstract— This Paper investigates Pakistan`s exports to Developed Market Economies (DMEs) for the period 2003-12 using the Constant Market Share analysis. CMS decomposed the total export`s growth in to four major components. i.e. the world trade effect, the commodity composition effect, the market distribution effect and the competitiveness effect. HS 4 digits panel data on yearly basis has been used in the study which has been collected by the International Trade Centre (ITC). The study shows that Pakistan has the potential to increase its exports to the DMEs, but targeted diversification is required with respect to commodities and Pakistan’s exports are competitive in the DMEs..
Index Terms— Exports, Pakistan, Developed Market Economies, Trade, Competitiveness, CMS.
—————————— ——————————
1 INTRODUCTION
XPORTS increase GDP growth, improve the current ac- count balance, increase competitiveness, generate em- ployment and reduce poverty which benefits the society. Internationally countries are focusing to increase their exports by increasing the volume and value of exports. For increasing the volume of exports diversification with respect to both commodities and markets is required, while export value can be increased though value addition in the raw exporting commodities. In the context of Pakistan`s export growth there is a lack of both export volume and value. Over the last ten years Pakistan’s exports increased from US$11 billion to US$24 billion with an average annual growth rate of 9% (Fig-
ure.1)
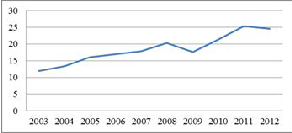
Figure 1: Exports of Pakistan (US$ Billions)
Apart from the positive exports growth rate the trades balance of Pakistan (Figure 2) remained negative during the last ten years. Since 2003 trade gap between exports and imports in- creased from -1.1 US$ billion (2003) to -19.2 US$ billion (2012) reflecting that although exports increased but imports in- creased at a higher rate, may be due to the reduction of tariff and non-tariff barriers across the world. Pakistan should therefore needs to focus on increasing its exports in order to utilize the benefits of reduction of tariff and non-tariff barriers in the international markets.
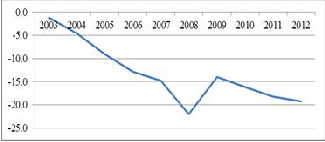
Figure 2: Trade of Balance of Pakistan (US$ Billions)
A number of studies discussed in literature have analyzed exports of Pakistan, but none have analyzed Pakistan’s exports to the Developed Market Economies (DMEs). The present study is the first to analyze Pakistan’s exports to the DMEs by using the CMS framework. Table 1 shows bilateral trade be- tween Pakistan and the DMEs.
Table 1 .Bilateral trade between Pakistan and Developed

Market Economies
————————————————
• Arsalan Ahmed is currently pursuing Doctoral degree program in Eco- nomics in Shandong University, China, PH-8615668387001. E-mail: ars- alanbinfurqn@gmail.com
• Dr Shahida Wizarat is HOD of Economics, College of Economics & Social
Development , Institute of Business Management (IoBM), Karachi, Paki-
stan, Phone: 111 002 004 Ext: 298 E-mail: shahida.wizarat@iobm.edu.pk
(This information is optional; change it according to your need.)
IJSER © 2015
http://www.ijser.org
International Journal of Scientific & Engineering Research, Volume 6, Issue 4, April-2015 173
ISSN 2229-5518
According to Table 1 during the last ten years Pakistan`s exports to DMEs increased from US$ 6.73 billion (2003) to US$9.66 billion (2012) while imports from DMEs to Pakistan increased from US$4.56 billion (2003) to US$9.37 billion (2012) during the same period. Besides, the % share of exports to DMEs in total exports from Pakistan and the % share of im- ports from DMEs in total imports into Pakistan declined sharply. Figure.3 shows that of the 39 DME countries there are eleven whose contribution comes to about 91 % in total ex- ports from Pakistan to DMEs.
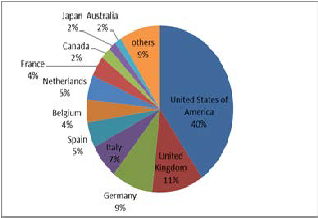
Figure 3: % share of exports to DMEs in total exports from
Pakistan
2 LITERATURE REVIEW
Following Tyszynski [1], Leamer and Stern [2] developed and modified this technique, which was further modified by Jep- ma[3] . Aurangzeb [4]explored the relationship between ex- ports and economic growth in Pakistan. Using time series data (1973-2005) the study states that in the export sector of Paki- stan the marginal factor productivities are significantly higher. The study shows that export oriented, outward-looking ap- proach is required for better economic growth in Pakistan. Barbaros, et. al [5] used Constant Market Share analysis to explore the competitiveness of Turkey’s organic exports to the European Union in order to explore the factors that affect the country’s export performance. The study decomposed export growth into growth of export market relative to the world ex- port growth (structural effect), improvements in competitive- ness of the exporting country (competitiveness effect) and the combined effect of competitiveness and structure. Amador et. al. [6] analyzed the evolution of Portuguese market shares in world exports over the 1968-2006 period, using the CMS methodology. The study compared Portuguese market shares with other South European countries and Ireland and ex- plored the impact of product and geographical composition on export growth. The author argued that changes in a coun- try (say Portuguese) market share in world exports depends on domestic and external macroeconomic developments (im- pact on relative price/cost competitiveness of exports), long term structural factors (productive factors, technology etc.) geography and cultural linkages with different trade partners, dynamics of international trade flows. Wizarat et. al. [7] found that the rate of growth of demand for Pakistani exports has
not been slower than the average growth rate of world ex- ports. They found world trade effect in 2002-03, Market Dis- tribution Effect positive for all the years except 1998-99-2000 due to income and trade policies in the importing countries. The Commodity Composition Effect (CCE) was positive for all the years except 2001-2002. Skriner [8] studied competitive- ness and specialization of the Austrian export sector by using the transformed version of the Constant Market Share analysis methodology from the static approach to a dynamic system through time series modeling. According to the study, “even if a country maintains its share of every product in every mar- ket, it still can experience a decline in its aggregate market share if it exports to markets that grow more slowly than the world average and/or if it exports products for which de- mand is growing more slowly than average.” The study also shows that for high export growth, the country should focus (to export) on most dynamic markets and products in world trade. Panayiotis et al. [9] investigated the performance of Greek exports by Constant Market Share analysis, using panel data on bilateral trade by product categories and found that the degree of specialization of Greek exports is relatively high as compared to the other countries. Moreover, in commodity categories (mechanical equipment, manufactured metallurgy products, paper and glass etc.) Greece can increase its exports by concentrating on non-price factors. Jiménez and Martín [10] argued that the change in the country’s export market share is influenced by the actual movement in price and non-price- competitiveness and composition of exports (both geographic and product wise). They used CMS analysis to investigate changes in the market shares of the euro area and its member countries for the period 1994-2007. The author identified that the geographic composition neutralized the negative effects due to loss of competitiveness, and euro countries were badly affected by the lower relative specialization in high- technology products. Also the high intra-euro trade positively supports exports of the euro area. Crespo and Fontoura [11] examined the importance of competiveness in export growth, using the CMS analysis to measure the variations in the mar- ket share of 82 of the world’s principal exporting countries for
1995-97 and 2005-07 periods. The results show that there is similarity with respect to the market share and components into which the variation is broken down for countries which are geographically closer to each other. The study also re- vealed that the reason for these similarities is due to similar levels of development, structure of costs for transporting goods to the various markets, geo-physical conditions, access to transport infrastructures, etc. The results also show that the market shares of many emerging countries in Asia and Central and Eastern Europe have been shrinking. Naseeb Zada [12] examined the determinants of exports for Pakistan. The study used Generalized Methods of Moments (GMM) and found that exports from Pakistan are sensitive to changes in world demand and world prices on the demand side. On the supply side, price and income elasticities are low. And the demand for exports is relatively higher for countries in NAFTA, Euro- pean Union and Middle East regions. Avinger and Nanda [13] studied international competitiveness of India’s manufactured exports using Constant Market Share analysis to measure the competitiveness of Indian manufactured exports. According to
IJSER © 2015 http://www.ijser.org
International Journal of Scientific & Engineering Research, Volume 6, Issue 4, April-2015 174
ISSN 2229-5518
them world trade growth has positively supported Indian ex- ports, while the market distribution effect is unfavorable. In- dia, therefore, needs some diversification with respect to mar- kets. Also manufactured exports of India continued to be competitive, and non-manufactured exports were uncompeti- tive. Finicelli et al. [14] examined the evolution of export shares of industrial and emerging market economies for the period 1985-2003. The study quantified the contribution of the geographic and sectoral specialization through the constant market share analysis. In comparison to emerging markets with the industrial countries, the study found that emerging economies have strong export growth as compared with the industrial countries. The study also shows that among the emerging economies, China has strong export growth, increas- ing its market shares across sectors and destinations due to its competitiveness, while industrial countries benefited from
current year
Xij 1 = Value of Pakistan’s total exports of commodity (i) in the base year to country (j)
Xij 2 = Value of Pakistan’s total exports of commodity (i) in the current year to country (j)
r: percentage increase/decrease in total world exports from the base year to the current year
ri : percentage increase /decrease in world exports of commod- ity (i) from the base year to the current year
rij : percentage increase/decrease in world exports of com- modity (i) to country j from the base year to the current year
2.3 The Model
With the division of exports into ith commodities and jth mar- kets, the equation representing the total change in exports from Pakistan can be written as:
specialization in fast-growing sectors (high-tech) or destina-
X = X
2 - X 1
tions (Asia). Clipa [15] disaggregated the change into: the rela-
ij ij ij
tive market share (VRC), competitiveness effect (CE) and the
X = r * X
1 - r * X
1 + X
2 - X 1
structural effect (SE). Cheptea et al. (2012) used Constant Mar-
ij ij ij i ij ij ij
ket Share Analysis by incorporating the econometric shift-
X = r * X
1 + ( X
2 - X
1 - r * X 1 )
share decomposition of export growth. The study shows that European countries have lost less market share in high- technology products in developing countries as compared with the developed countries. The study also revealed that
ij ij ij ij ij ij ij
Appling Summation to the above equation for aggregating
Pakistan’s export growth,
1 ( 2 1 1 )
during 1995 to 2009 the EU survived. Amjad et. al . [16] de-
∑ ∑ Xij = ∑ ∑ rijXij
+ ∑ ∑
Xij
− Xij
− rijXij
scribed the problem faced by exporters of Pakistan to utilize the full competitive potential in the international market. The study states that the main problems are the shortage of skilled labor in textiles, chemicals, and hosiery/bed linen as labor force is less educated, the energy crisis i.e. non-availability of cheap fuel, especially electricity that is important for export- ers to boost exports, institutional rigidities, market imperfec- tions and weaknesses in physical infrastructure. According to Imran and Aqil [17] globalization had a positive impact on exports from Pakistan. Currently the total value of exports are around US$24 billion and imports US$44 billion.
To obtain the world export growth effect on the ith commodity
in the jth markets for Pakistan’s exports, addition and subtrac-
tion of the term r and ri is being done in equation as
A\addition and subtraction of the terms r and ri at the same
time does not affect the equation`s equilibrium.
X = ∑ ∑ (r − r − r − r + r ) X 1 + ∑ ∑ (X 2 − X 1 − r * X 1 )
X = ∑ ∑ (r * X − r * X 1 + r * X 1 − r * X 1 + r * X 1 ) + ∑ ∑ (X 2 − X 1 − r * X 1 )
X = ∑ ∑ (r * X 1 ) + ∑ ∑ ( r * X − r * X 1 ) + ∑ ∑ ( r * X 1 − r * X 1 )+ ∑ ∑ (X 2 − X 1 − r *X 1 )
ij i ij ij ij ij i ij ij ij ij ij
X = ∑ ∑ (r *X 1 ) + ∑ ∑ ( r – r)*X 1 + ∑ ∑ ( r − r )*X 1 + ∑ ∑ (X 2 − X 1 − r *X 1 )
3 METHODOLOGY
ij i ij
ij i ij
ij ij ij ij
In the model of Leaner and Stern the main assumption is that
X = ∑ (r * X 1 ) + ∑ ( r – r)* X 1 + ∑ ∑ ( r − r )*X 1X 1 + ∑ ∑ (X 2 − X 1 − r *X 1 )
a country`s export share in the world market remains un-
i i i
ij i ij ij
ij ij ij ij
changed over a one year period. The analysis is performed by
X = r *X1 + ∑ ( r – r)*X 1 + ∑ ∑ ( r − r )*X 1
( 2 1 1 )
decomposing total export growth into four categories; first, the
world trade effect (WTE) which shows how much the overall
world export growth affects the country’s export growth. Se-
cond, the commodity composition effect (CCE) which analyses
the concentration of exports. Third, the market distribution
effect (MDE) which measures the concentration and diversifi-
cation of exports with respect to markets. And fourth, the
competitiveness effect (CE) which captures the price effect in
international markets for exports
3.1 Explanation Of Variables
X1 = Value of Pakistan’s total exports in the base year
X2 = Value of Pakistan’s total exports in the current year
Xi 1 = Value of Pakistan’s total exports of commodity (i) in the base year
Xi 2 = Value of Pakistan’s total exports of commodity (i) in the
i i ij i ij ij ij ij ij
The final equation represents the three level analyses, where the growth of Pakistan’s exports has been divided into four parts. The first part is shown by the term r*X1 explains the growth of Pakistan’s export with respect to the general rise in world exports, the second part represented by the term ∑ [( ri
–r)*Xi 1] shows the commodity composition of Pakistan’s ex- port. The third part shown by the term ∑∑[( rij - ri )*Xij 1 ] repre- sents the market distribution of Pakistan’s exports and the fourth part is the unexplained residual term, indicating the competitiveness effect. This indicates the differences between the actual export increase and the hypothetical increase if Pa- kistan had maintained its share of export of each commodity group to each country.
IJSER © 2015 http://www.ijser.org
International Journal of Scientific & Engineering Research, Volume 6, Issue 4, April-2015 175
ISSN 2229-5518
2.4 Data Sources and Definition
Data was taken from the International Trade Centre (ITC). ITC has a joint mandate with the World Trade Organization (WTO) and the United Nations and focuses solely on trade development for developing and transition economies. De- tailed data on countries export performance, key imports and foreign investment, grouped by product and service categories (HS and BOP) are available on the ITC website (http://www.intracen.org/country/Pakistan/). Among the various trade data classifications, the Harmonized System (HS Code) at 4 digit level will be used for this study. The HS Code is a commodity classification system introduced by the World Customs Organization (WCO) to harmonize interna- tional trade by creating a coding system that is globally ac- ceptable. The four digit HS code is broken down into two parts. The first two digits (HS-2) identify the chapter the goods are classified into, e.g. 09 = Coffee, Tea, Maté and Spices. The next two digits (HS-4) identify groupings within that chapter, e.g. 0902 = Tea, whether or unflavored. Also the selected Commodities have 70% share in total exports of Pakistan (see Appendix-B, Table 2)
3 RESULTS AND DISCUSSION
3.1 World Trade Effect
According to the results (Figure 4) Pakistan manufactured exports are affected positively by world export growth throughout the years except 2008-2009. In the consecutive years 2009-10 and 2010-11 Pakistan experienced a healthy world trade effect of 3.86 billion US$ and 3.93 billion US$ re- spectively. The average value of the world trade effect is around 1.8 billion US$ for the last ten years, while in 2011-2012 the value of world trade effect was about 0.18 billion US$
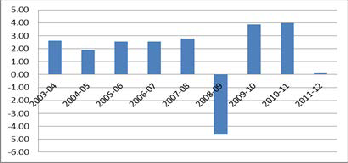
Figure 4: World Trade Effect (US$ Billion)
Our results show that among the four factors (World Trade
Effect, Commodity Composition Effect, Market Distribution
Effect and Competitiveness Effect) world trade effect is the
most dominant. The average value of the world trade effect is around 1.8 billion US$ for the last ten years. At the aggregate level Pakistan`s exports are positively affected by world ex- port growth, since 2003 the value of WTE fluctuated between -
4.6 to 4 but this fluctuation mostly remained positive for Paki- stan’s exports. One major reason for the positive effect of world export growth on Pakistan`s exports may be because the world average growth rate was fluctuating, but was al- ways positive throughout the period.
3.2 Commodity Composition Effect
Commodity Composition Effect (CCE) shows concentration in the composition of exported goods. The results of the CMS analysis show that the Commodity Compositions Effect re- mained negative for Pakistan’s exports throughout the period except 2008-2009 (Figure 5). In that year the value of Commod- ity Composition Effect was 1.09 billion US$. The most negative value (effect) of commodity composition was recorded at -0.89 billion US$ in 2005-06. While in the year 2011-12 there was a negative affect emanating from the Commodity Composition Effect to the tune of -0.50 billion US$.
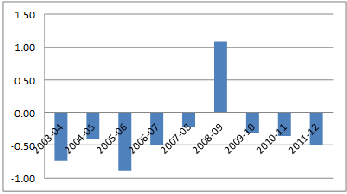
Figure 5: Commodity Composition Effect (US$ Billion)
3.3 Market Distribution Effect.
The results (Figure 6) illustrate that the MDE for Developed Market Economies generally remained negative in 2003-12, except 2003-04 in which the MDE for Developed Market Econ- omies was US$15 million. Moreover, highest negative MDEs were recorded in 2007-08, 2009-10 and 2011-12, the values be- ing (-) US$352 million, US$374 million and US$559 million respectively. As the average share of the Developed Market Economies in Pakistani exports is 49.56%, so the negative MDE for the Developed Market Economies significantly af- fects total exports of Pakistan.
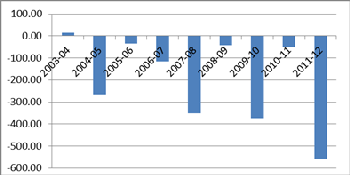
Figure 6: Market Distrbution Effect of Developed Market
Economies
3.2 Competitiveness Effect
The results (Figure 7) illustrate that the CME for Developed Market Economies for Pakistani exports was mostly positive in 2003 to 2012, however some negative CME values were rec- orded in 2006-07, 2008-09 and 2011-12. The highest positive value for CME (Developed Market Economies) was measured
IJSER © 2015 http://www.ijser.org
International Journal of Scientific & Engineering Research, Volume 6, Issue 4, April-2015 176
ISSN 2229-5518
at US$938 million in 2004-05, while the highest value of nega- tive CME (Developed Market Economies) was (-) 9 US$40 mil- lion. Also the CME of Developed Market Economies for 2011-
12 was also negative with the value of (-)US$330 million. The average share for Developed Market Economies in Pakistani exports is 49.56%, so the negative /positive CME for the De- veloped Market Economies significantly affects the total ex- ports of Pakistan negatively.
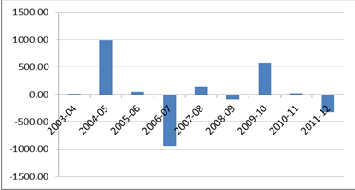
Figure 6: Competitiveness Effect of Developed Market Econ- omies
4 POLICY RECOMMENDATION
Based on the finding of this research, following policy rec- ommendations are being made to the Government of Pakistan to improve the growth of exports.
1. In order to stimulate exports from Pakistan, the govern- ment should diversify exports from lower world demanded products to relatively faster growing world demanded prod- ucts, for that the required diversification is from the commodi- ties (with HS 4 digits code) such as 1006, 4203, 5205, 5208,
5209, 5210, 5212, 6105, 6203, 6302and 6307 to other commodi- ties (with HS 4 digits code) such as 1001, 1302, 2207, 2610,
6103, 6104 and 9404. It is noted that most of Pakistan’s exports under these groups are outputs of agriculture based industries and the demand for these tends to be low so the government should consider the expansion of manufactured based more advanced end-products with higher value addition.
2. The study also showed that commodities 2710 (Petrole- um oils, not crude), 6105 (men shirts, knitted or crocheted),
6116 (gloves, mittens and mitts, knitted or crocheted), 7306 (tubes, pipes and hollow profiles of iron or steel, nes) and 7404 (copper waste and scrap) have not only a good share in the exports of Pakistan but their demand in the international mar- ket is also stable. The growth of these exports can promote export growth of Pakistan at the aggregate level more signifi- cantly.
3. In the case of Developed Markets Economies (See Table 3), Pakistan should focus on the commodity categories 27(mineral fuels, oils, distillation products, etc.), 84 (machinery, nuclear reactors, boilers, etc.), 85 (electrical, electronic equipment, 87
Vehicles other than railway, tramway), 30 (pharmaceutical products), 39 (plastics and articles thereof, 90 (optical, photo, technical, medical, etc apparatus), 29 (organic chemicals, 99 (commodities not elsewhere specified), 72 (iron and steel),
71(pearls, precious stones, metals, coins, etc.), 73 (articles of iron or steel) because these commodities have 68% share in total DMEs imports from the world, while Pakistan has only
4.31% share in exports of these to DMEs (see Table 3). Accord- ing to the Tribune (4 March, 2014) in the total Export Devel- opment Funds 80-90% of the project budget goes to salaries and administrative costs, the Government of Pakistan should focus on these funds and use them for giving special incen- tives to targeted industries, such as in the form of tax holidays (especially for initial establishment), tax reduction and tariff reduction on some specific supported imported raw materials
5 CONCULSION
Based on the analysis, this research concludes as follows:
1. World Trade Effect (WTE) has a high positive impact on total export growth of Pakistan, while the Commodity Com- position Effect (CCE), Market Distribution Effect (MDE) are causing problems for Pakistan’s exports growth since their
impact on growth has been negative almost throughout the period 2003-12 except for a few years. Moreover, the Competi- tiveness Effects (CME) has shown both positive and negative impacts.
2. The main factor for the negative CCE is that Pakistan’s ex- ports are mainly concentrated among eleven (4 digit disaggre- gated) major commodities (products), as is shown in Appen- dix B, Table 2. These eleven commodities (4 digit disaggregat- ed) which contain 45% -50% share of total exports from Paki- stan, while at the same time these products have low growth rate in the world as compared to other commodities, which results in a negative Commodity Composition Effect (CCE).
3. Market Distribution Effect (MDE) measures the concentra- tion and diversification of Pakistan’s exports with respect to the importing country. In the case of Developed Market Econ- omies the MDE is negative. Since the commodities which have
90.57% share in total exports from Pakistan to DMEs, are 11.48
% in total DMEs imports from the world (see Table- 4), which
shows that the commodities exported by Pakistan do not have
great demand in these countries, especially 63 (Other made
textile articles, sets, worn clothing etc.), 61 (articles of apparel, accessories, knit or crochet, 62 (articles of apparel, accessories, not knit or crochet, 52 (cotton),42 (articles of leather, animal gut, harness, travel goods), which have 80% share in total ex-
ports from Pakistan to MDEs and 4.06% share in total imports into DMEs from the world. This shows that the commodities which are exported to the DME from Pakistan do not have high growth demand in the DME markets, so Pakistan has to diversify its exports.
4. We find that United States of America and European DMEs have 90% share in total exports from Pakistan to DMEs and the exchange rate among Pakistan and the DMEs is very high (Table.5) due to which DMEs imports to Pakistan are relative- ly cheap giving Pakistani exporters a major competitive ad- vantage.
APPENDIXES
Appendix- A
HS 4 digits code Commodity Name
IJSER © 2015 http://www.ijser.org
International Journal of Scientific & Engineering Research, Volume 6, Issue 4, April-2015 177
ISSN 2229-5518
6302 Bed, table, toilet and kitchen linens
1006 Rice
5205 Cotton yarn (not sewing thread) 85% or more cotton,
not retail
2710 Petroleum oils, not crude
6203 Men's suits, jackets, trousers etc. & shorts
5209 Woven cotton fabrics, 85% or more cotton, weight over 200 g/m2
5208 Woven cotton fabrics, 85% or more cotton, weight less than 200 g/m2
1001 Wheat and muslin
4203 Articles of apparel & clothing access, of leather or
composition leather
6105 Men's shirts, knitted or crocheted
6204 Women's suits, jackets, dresses skirts etc. & shorts
'5210 Woven cotton fabrics, less than 85% cotton, mixed
with manmade fibers
2523 Cements, Portland, aluminous, slag, super sulfate &
similar hydraulic c
7113 Articles of jewelry & parts thereof
5513 Woven fabric of synthetic staple fib (< 85% of such
fiber),mixed with cotton (wt.
6307 Made up articles nes, including dress patterns
5201 Cotton, not carded or combed
1101 Wheat or muslin flour
6103 Men's suits, jackets, trousers etc. & shorts,
knit/crochet
6109 T-shirts, single and other vests, knitted or crocheted
9018 Electro-medical apparatus (electro-cardiographs, in-
fra-red ray app, sy
6115 Panty hose, tights, stockings & other hosiery, knitted or crocheted
3907 Polyacetal, polyether, epoxide resin, polycarbonate, etc., in primary form
5212 Woven fabrics of cotton, nes
2207 Ethyl alcohol & other spirits (if under natured then
higher than 80% by
9506 Articles & equip for gymnastics, athletics, or
sports/outdoor games nes
4113 Leather further prepared after tanning or crusting
""incl. parchment-dressed leather"", of
4107 Leather of other animals, o/t leather of hd no
41.08/41.09
1516 Animal or veg. fats, oils & factose, hydrogenated
0303 Fish, frozen, whole
5211 Woven fabric of cotton, less than 85%,mxd with
manmade fiber, weight >200
0805 Citrus fruit, fresh or dried
6104 Women's suits, dresses, skirt etc. & short,
knit/crochet
5701 Carpets and other textile floor covering knotted
6303 Curtains, drapes & interior blinds
6116 Gloves, mittens and mitts, knitted or crocheted
5514 Woven fabric of synthetic staple fib (> 85% of such
fiber), mixed with cotton (wt.
0804 Dates, figs, pineapples, mangoes, avocadoes, guavas
6110 Jerseys, pullovers, cardigans, etc., knitted or cro-
cheted
7306 Tubes, pipes and hollow profiles of iron or steel, nes
2610 Chromium ores and concentrates
0701 Potatoes
9404 Mattress supports; mattresses, quilts, etc.
3004 Medicament mixtures (not 3002, 3005, 3006), put in
dosage
7404 Copper waste and scrap
6403 Footwear, upper of leather
6106 Women's blouses & shirts, knitted or crocheted
1302 Vegetable saps & extracts
6306 Tents& camping goods, tarpaulins, sails for boats, etc.
0201 Meat of bovine animals, fresh or chilled
Appendix- B
Table 2 % Share of Commodities in the Total Exports of Pa- kistan
IJSER © 2015 http://www.ijser.org
International Journal of Scientific & Engineering Research, Volume 6, Issue 4, April-2015 178
ISSN 2229-5518
Table 3
IJSER © 2015 http://www.ijser.org
Table 4
International Journal of Scientific & Engineering Research, Volume 6, Issue 4, April-2015 179
ISSN 2229-5518
Table 5
REFERENCES
[1] Tyszynski, H., (1951), “World Trade in Manufactured Commodities,
1899-1950”, The Manchester School of Economic and Social Studies,
Vol.19, pp222-304.
[2] Leamer, E.E. and Stern, R.M. 1970, Quantitative International Econom- ics, Boston: Allen & Bacon.
[3] Jepma. C.J. (1986). “Extensions and Application Possibilities of the
Constant Market Shares Analysis”. Rijkusiniversiteit, Groningen
[4] Aurangzeb, (2006) “Exports, Productivity and Economic Growth in
Pakistan: A Time Series Analysis”, The Lahore Journal of Economics Vol
11 : 1 (Summer 2006) pp.1-18
[5] Barbaros. et. al., (2007), “Competitiveness of Turkey’s Organic Exports in the European Union Market” Ege University, Turkey; Dokuz Eylül University, 105th EAAE Seminar “International Marketing and Interna- tional Trade of Quality Food Products”, Bologna, Italy, March 8-10, 2007
[6] Amador.J. and Cabral.S., (2008), “The Portuguese Export Performance In Perspective: A Constant Market Share Analysis”, Economic Bulletin, Autumn,2008
[7] Wizarat.S, Iftikhar. K and Kamran A. N (2009), “Major determinants of export growth”, Pakistan Business Review, volume 11 number 2, July 2009 [8] Skriner, E., (2010), “Competitiveness and Specialization of the Austrian Export Sector”, Economic Series, No. 235, Institute for Advanced Studies, Vienna
[9] Panayiotis P., Backinezos, C. and Evangelia A. (May,2010) “Export
Performance, Competitiveness And Commodity Composition” ISSN 1109-
6691(JEL classification codes: C22; F12; F14; O14) Working Papers, Bank of
Greece, Economic Research Department – Special Studies Division
[10] Jiménez, N. and Martín,E. (2010).“A Constant Market Share Analysis of the Euro Area in the Period 1994-2007”, Economic Bulletin, January
2010.
[11] Crespo. N & Maria Paula Fontoura, (2010). "What determines the export performance? A comparative analysis at the world level," Working Papers Department of Economics 2010/27, ISEG - School of Economics and Management, Department of Economics, University of Lisbon
[12] Naseeb Zada, Malik Muhammad, Khan Bahadar (2011), “Determi-
nants of Exports of Pakistan: A Country-wise Disaggregated Analysis”, The Pakistan Development Review, Winter 2011,Vol. 50, No.4 Part II
[13] Kaur, A. and Nanda, P. (2011), “Competitiveness of India’s Manufac- tured Exports: A Constant Market Share Analysis”, Indian Journal of Eco- nomics and Business ISSN: 09725784, April-Sept, 2011 Vol.10, Issue: 2-3. [14] Finicelli, A., M. Sbracia and A. Zaghini, (2008), “A Disaggregated Analysis of the Export Performance of Some Industrial and Emerging Countries”, MPRA Paper, No. 11000
[15] Clipa. P, (2012) “The Analysis of the Competitiveness of Romanian
Exports Using Constant Market Share Method”, CES Working Papers,
2012, vol. 4(3a), pages 502 511. http://www.cse.uaic.ro/WorkingPapers/articles/CESWP2012_IV3a_CLI. pdf
[16] Amjad, R ,Ghani, E , Musleh ud Din, and Mahmood,.T, (2012), “Ex- port Barriers in Pakistan: Results of a Firm-Level Survey”, The Lahore Journal of Economics 17 : SE (September 2012): pp. 103–134
IJSER © 2015 http://www.ijser.org