International Journal of Scientific & Engineering Research, Volume 4, Issue 12, December-2013 1629
ISSN 2229-5518
Concentration of Radon and its Progeny Levels in water in District Moradabad of Western Uttar Pradesh
Parag Mishra , R B S Rawat* and V K Sharma
Department of Physics, K.G.K (P.G) College, Moradabad
* Department of Physics, M S College Saharanpur
E.mail: parag.misra2009@gmail.com
Abstract
Radon concentration in ground water from different loca- tions of Moradabad district of Uttar Pradesh was measured during year–2012. Water samples were collected from the selected locations around Moradabad City from manually operated bore wells, open wells, lakes and running water. To estimate 226Ra activity, 20 liters of water was collected and pre-concentrated by chemical methods. The pre-concentrated sample of about 60 ml was then transferred to and evacuated radon bubbler. An evacuated scintillation cell was then con- nected to the bubbler and radon in the water was transferred to the cell. The cell was coupled to an alpha counter for analysis. The radon and radium concentration in water was determined by measuring the net alpha counts using a stand- ard procedure . The graphs were plotted for radon concentra- tion versus number of houses for different seasons. The re-
sulting radon concentration level due to radon varied from
port, EPA estimates that radon in drinking water causes about 168 cancer deaths per year: 89% from lung cancer caused by breathing radon released to the indoor air from water and 11% from stomach cancer caused by consuming water containing radon Due to recent surveys in Dehradun [4] and nearby towns of U.P [5] suggest a little higher con- centration of radon than the normal one, hence radon con- centration survey was required for different regions of the state. So Moradabad district of western Uttar Pradesh are chosen as study area. The aim of proposed investigation is to carry out the systematic study of radon and their daugh- ter products in relation to their application in radiation pro- tection
Study area
The measurements of groundwater radon concentration were made in various locations of Moradabad district of western Uttar Pradesh.
Experimental method
IJSER
28.34 Bq/l to 40.98Bq/l . The observed radon concentration in ground water was found to be lower than the ICRP rec- ommended value and thus are within safe limits.
Keywords: Radon; Radon bubbler ; Scintillation cell; Alpha counter;
Introduction
Naturally occurring radionuclides are frequently measured in ground waters. Of these radionuclides, radon (222Rn) has sufficient properties, solubility, and half-live (3.8 d) that during household use of groundwater (showering, cooking, or washing dishes and clothes) the dissolved ra- don can contribute substantially to indoor-air levels (Fitz- gerald, 1997). The radon released from the water into the home's air will contribute to the radon concentration in the indoor air[1].The global value of radon concentration in water range from 500 pCi/I to 170.00 pCi/I (Fleisher et.al.,
1965).Radon is very soluble in water (Fleisher, 1988).
In equilibrium with radon gas at a partial pressure of one
atmosphere, the solubility range from 51cc of radon per
100cc of water at 0°C to 13cc per 100cc of water at 50°C [2].Studies from deferent parts of the world show that well planned and systematic measurements of radon activity concentrations for all seasons during a calendar year are necessary to calculate the actual dose due to radon. Maps of radon prone areas showing different potential radon
The radon and its daughter products in environment were
measured in 66 locations of the Moradabad district of west- ern Uttar Pradesh . The measurement in drinking water will be made by Alpha-Scintillometer. In this 750 ml water is taken in radon light reagent bottle of one liter capacity connected in a closed with ZnS coated detection chamber through a hand operated rubber pump and a glass tube con- taining Calcium Chloride to absorb the moisture. The air is circulated in a closed circuit for a period of ten minutes till radon forms a uniform mixture with air and resulting alpha activity is recorded. Lucas cell is used to grab a gas sam- ple, filter out the radon daughter through a special filter at
0.01 microns, and counts the radioactive decay of radon gas.
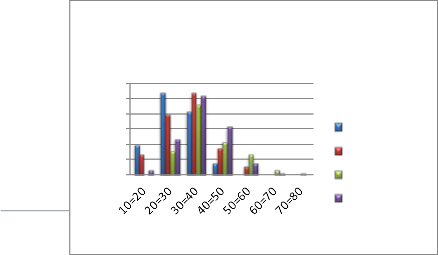
Fig.1
Ground Water Radon
Concentration (Bq/l)
30
25
20
emission levels are very helpful to assist the authority in 15 identifying populations with a higher risk of radon gas ex- 10 posure. [3] Based on a National Academy of Science re- 5
0
IJSER © 2013 http://www.ijser.org
AUTUM N
SUMMER RAINY S EASON WINTER
Bq/l
International Journal of Scientific & Engineering Research, Volume 4, Issue 12, December-2013 1630
ISSN 2229-5518
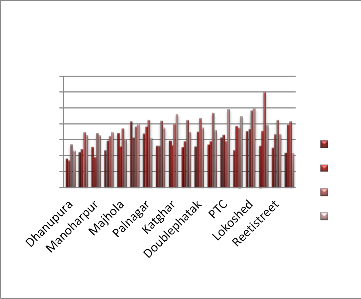
FIG.2.
Conclus ions
Average Ground Water Radon variation
70
60
50
40
Based on the results obtained from the study area, the activ- ity concentrations of Ground water Radon in the locations of Moradabad district of Uttar Pradesh is studied for all four seasons. The resulting doses were found to be well below internationally recommended levels and are within the safe limit from the radiation protection point of view.
30 Autum References
20
10 Summ [1]Alter, H.W. and Fleischer, R.L., Depth Dependence Ra-
0 Rainy
don Study in Indian Tube Wells, Health Phys., 40(5), 693
Sample locations
Results and Discussion
Winte (1981).
[2] Abu-Jarad, F., Fremlin, J.H. and Bull, R., A Study of Radon Emitted Building Materials Using Plastic Alpha Tracks Detectors., Phys. Med. Biol., 25, 683-694 (1980).
[3] UNSCEAR (2000), United Nations Scientific Committee on the Effects of Atomic Radiation, Sources, Effects and Risks of Ionizing Radiation, Re-

IJSER
Measured values of radon for four different seasons of a
calendar year are shown in Fig.1. In autumn season the ra-
don concentration in water varies from 15 Bq/l to 48 Bq/l with an average of 28.34 Bq/l. During summer season in- door radon concentration was found to vary from 14 Bq/l to
48 Bq/l with an average of 30.54 Bq/l. During monsoon
radon concentration was found to vary from 21 Bq/l to 77
Bq/l with an average of 40.98 Bq/l. During winter radon concentration was found to vary from 17 Bq/l to 61 Bq/l with an average of 37.34 Bq/l.It is found that the overall average value of radon concentration is maximum (40.98
Bq/l) during rainy season and minimum (14 Bq/l) during summer season.
It was observed that radon concentrations in ground water are governed by the litho logy of the study area. Observed data reveal that radon concentration is low in air and slight- ly higher in ground water. In rainy season flow of water through rivers and canals come to the ground and increase the level of water, Because of this the radon kept low in other seasons flow upwards with water level and hence a slight increase in the radon concentration is observed.
At the same time flow of radioactive atoms from hilly re-
gion reach to the planes of Moradabad, which is one of the reason in the increase of concentration in water.
However, the recorded values of radon and progeny and
resulting doses are well below internationally recommend- ed levels (ICRP, 1993). This clearly indicates that the loca- tions in Moradabad district of Uttar Pradesh are quite safe from the radiation protection point of view.
port to the General Assembly, (United Nations, New
York).
[4] Radon and thoron monitoring in the environment of Kumaun Himalayas: survey and outcomesJournal of Envi- ronmental Radioactivity, Volume 79, Issue 1, 2005, Pages
85-92 R.C.Ramola, M.S. Negi, V.M. Choubey.
IJSER © 2013 http://www.ijser.org