International Journal of Scientific & Engineering Research, Volume 4, Issue 9, September-2013 46
ISSN 2229-5518
Comparison of Clustering Techniques for
Microarray Image Segmentation
Kavitha M G, Suresh Kumar D S
Abstract— Microarray is new techniques to investigate the e xpression levels of thousands of genes simultaneously. Gene expres- sions provide information about the cell activity in an organism. cDNA (complementary DNA) microarray is one of the most recent and important technology for exploring the genome. By comparing gene expression in normal and abnormal cells, microarrays may be used to identify genes, which are involved in particular diseases. These genes may then be targeted by therapeutic drug. The seg- mentation step is important, because it considerably affects the precision of microarray data. This paper makes a fine distinction against the gene expressions in the microarray image processing. For this reason, the k-means and fuzzy c–means methods and ob- served the results. And the method of thresholding the intensity of each spot is calculated and the gene expression is observed.
Index Terms— Clustering, DNA gene expressions, Fuzzy c-means, Gridding, Intensity, K-means, Thresholding
—————————— ——————————
1 INTRODUCTION
icroarray images [1] contain thousands of gene spots need to be analyzed in a very fast automated way. [8 9
10] Microarray technology is used in many fields such as medical diagnoses, mostly on cancer and diabetic, and bio-
medicine. Thousands of genes can possibly be concurrently computed by employing microarray technology out of a digital
image and information about a cell activity of an organism can be extracted by analyzing the gene expressions. Gene ex-
pression data have important applications in pharmaceutical and clinical research. For example, the comparison of the
gene expression levels before and after cancer treatment helps identify the genes that the drug affects. Thus, this pro-
cess helps provide a quicker and more accurate diagnosis and the subsequent treatment of the disease. The most promising
commercial application of microarrays is their potential use in clinical diagnostics. Its potential application goes from drug
discovery to gene-based diagnostics. The most appropriate treatments can be reached by the study of changing the ex-
pression of genes over time, among tissues, and disease sta- tus. In addition, microarrays have a huge potential impact in
the areas of preventative medicine, ability to diagnose accu- rately the disease, and design drugs that treat disease caus-
es, rather than symptoms. More precisely, the process of a microarray experiment (Campbell et al., 2007)[9] starts with
the selection of a set of DNA probes that are of particular interest.
Firstly, two samples of RNAs are collected of which one will be the normal RNA and other will be the affected (cancer affected, tumor).These samples undergo reverse transcription
————————————————
• Kavitha M G, M.Tech [Electronics] Student, Department of Electronics & Com- munication Engineering, Channabasaveshwara Institute of Technology, Gubbi, Tumkur, Karnataka, India, PH-9743811066. E-mail: kavitha.mg08@mail.com
• Suresh Kumar D S, Professor, Department of Electronics and Communication Engineering. Channabasaveshwara Institute of Technology, Gubbi, Tumkur, Karnataka, India. E-mail: sureshtumkur@yahoo.co.in
process is to convert the RNAs into cDNAs.
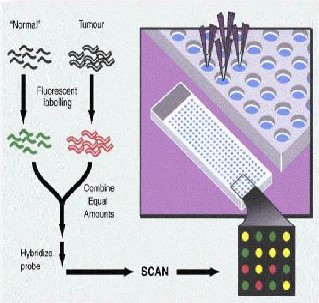
Fig 1: Schematic diagram of microarray image experiment cDNA’s are labeled with fluorescent probes nor m al
c DNA ’ s wi t h Cy3 (green) for the control and infected
one with the Cy5 (red) for the experimental channel. Finally, the hybridized glass slide is fluorescently scanned twice; one scan for each dye’s wavelength. Hence, two digital images are produced, one for each population of RNA. Each digital image contains a number of spots of various fluorescence intensities. Given that the intensity of each spot is proportional to the hy- bridization level of the cDNAs and the DNA spots, the gene expression information is obtained by analyzing the digital im- ages. Image is segmented into numerous compartments, each containing one individual spot and background.
IJSER © 2013 http://www.ijser.org
International Journal of Scientific & Engineering Research, Volume 4, Issue 9, September-2013 47
ISSN 2229-5518
To develop segmentation technique for Microarray images, to cater the need of Microarray imaging to solve the problem specified. The processing of the microarray images can be separated into three sequential steps namely,
• Gridding
• Segmentation
• Intensity extraction
The Analysis of microarray gene expression data involves many steps, the initial step consist of extracting the gene expression data from the microarray image and include spot localization o r gridding, foreground and background separa- tion, intensity extraction.
2. Methedology
2.1 Gridding
Gridding is the process of locating and addressing of each spot on a microarray image. Spots are separated from each other using vertical and horizontal grid lines. Ideally the spots would be periodically spaced consistently printed, but in prac- tice they tend to have different sizes and intensities, so the horizontal profile is irregular. We can use autocorrelation to enhance the self similarity of the profile. The smooth result promotes peak finding and estimation of spot spacing. Peak values have been obtained by differentiating left and right slopes of the means. Once the peak values are found, the centroids of the peaks have been extracted. These centroids correspond to the centers of the spots. The midpoint between two centers gives the grid locations. Thus, grid lines pass through these grid locations.
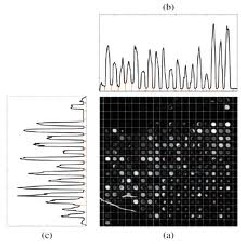
Fig:2 (a) Schematic diagram of gridded image. (b) Horizontal microarray Profile (c) Vertical Profile
2.2 Segmentation
Segmentation [2] is a partition process used to separate a spot area f rom a foreground f ro m t he background. Segmentation [6] is t he p rocess of clustering pixel-based cDNA microarray image into spots and image background. The accuracy of microarray data is significantly affected from the segmentation step. The segmentation step is im- portant, because it considerably affects the precision of micro- array data. The accuracy of the segmentation process affects quality of the gene expression information and impacts the confidence in any conclusion derived from this task.
2.3 Intensity Extraction
The last step in microarray processing is the intensity extrac- tion step. The numerical values of gene expressions are calcu- lated from red and green fluorescence intensities of the spots. The numerical values that quantify the intensity of each spot correspond to the gene expressions [3].Extracting inten- sity values are significant and each gene expression has to be accurately computed as they are used in the analysis by the biologists. Intensity extraction, which calculates red and green foreground fluorescence intensity pairs and background inten- sities. Information extraction calculates signal intensity for each spot of the array.
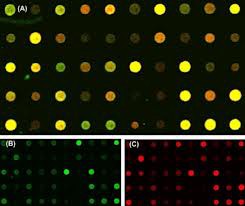
Fig 3: Red and Green mapped Microarray Image
3. Clustering Techniques
Cluster analysis [7] or clustering is the assignment of a set of observations into subsets (called clusters) so that observations in the same cluster are similar in some sense.Clustering is a method of unsupervised learning, and a common technique for statistical data analysis used in many fields, including machine learning, data mining, pattern recognition, image analysis, information retrieval, and bioin- formatics. The proposed paper is based on three main seg- mentation techniques using clustering methods.
• K-means Clustering
• Fuzzy c-means Clustering
IJSER © 2013 http://www.ijser.org
International Journal of Scientific & Engineering Research, Volume 4, Issue 9, September-2013 48
ISSN 2229-5518
• Thresholding
3.1 K-Means Clustering Algorithm
K-means algorithm [11] is an algorithm to classify or to group your objects based on attributes/features into K number of group. K-means clustering algorithm implemented in this paper aims to group the pixels into two clusters. Given  and c
and c representing the pixel of microarray image and the clusters respectively, the objective is to minimize the sum of squares of the distances given by the following:
more than one cluster with different degrees of membership. Given two cluster centers  and
and  c2 that denotes the center values of foreground and background pixels in a micro- array image respectively, each pixel should have a degree of membership to those designated clusters. So the goal is to find the membership values of pixels belonging to each cluster. The membership degree of a pixel
  is is a value in (0, 1). The sum of all membership values of a pixel belonging to clusters should satisfy the constraint expressed in the following:

(4)
 (1)
(1)  (2)
(2)
First two cluster centers  and
and  the centroid of spots and background have to be initialized at the outset. Iteratively, the pixels are assigned to the closest cluster and the new
centroid of a cluster is calculated by the following:
 (3) The k -means a lg o r it hm to s egm en t m ic roa rra y image is
summarized as below:
Algorithm KM Input:
N=Number of pixels to be clustered;  : Pixels of the microarray images;
c=2: foreground and background cluster;
Output:
Cl: cluster of pixels
Begin
Step_1: Cluster centroids are initialized,
Step_2: Compute the closest cluster for each pixel and classi- fy it to that cluster,
Step_3: Compute new centroids after all the pixels are clus- tered,
Step_4: repeat the Step 2-3 till the sum of squares are given in Equation 2 is minimized,
End
3.2 Fuzzy C-Means Clustering Algorithm
Fuzzy c-means is a well-known clustering method originally introduced by Bezdek in 1981 [4] [12]. In the nature of fuzzy logic, each point has a degree of membership to clusters ra- ther than belonging to only one cluster. Fuzzy c- means clus- tering algorithm implemented in this study aims to segment microarray image so that a set of pixels were assigned to a given number of clusters such that each pixel may belong to
Where c is the number of clusters and N is the number of pixels in the microarray image. The Euclidean distance from a pixel to a cluster center is given as follows:
 . (5) The objective function F utilized in minimizing the absolute
value of the difference between two consecutive objective functions given by the following:
 (6)
(6)  (7)
(7)
Where m is the fuzziness and € is the infinitesimal value given.

Iteratively in each step, the updated membership  and the cluster centers are given by the following equations:
(8)  (9)
(9)
The Fuzzy c-means algorithm to segment microarray image is summarized as below:
Algorithm
FCM (x, n, c, m) Input: N=number of pixels to be
clustered;

: Pixels of microarray images;
c=2: foreground and background clusters;
m=2: the fuzziness parameter; Output;
U: membership values of pixels
Begin
Step_1: Initialize the membership matrix uij and the fuzziness parameter m,
Step_2: Compute the centroid values for each cluster cj,. Step_3: Compute the membership values uij belonging to clusters for each pixel,
Step_4: Repeat steps 2-3 until the objective function is minimized,
IJSER © 2013 http://www.ijser.org
International Journal of Scientific & Engineering Research, Volume 4, Issue 9, September-2013 49
ISSN 2229-5518
End.
3.3 Thresholding
Thresholding is a simple but effective tool for image seg- mentation. The purpose of this operation is that objects and background are separated into non-overlapping sets. The log transformation done for the spots. The global threshold- ing and local thresholding is combined to get better result for the spot segmentation and intensity calculation.Each spot is considered and the measurement of each red and green intensities are calculated and ultimately quantify its gene [12] expression value. The measurement technique can then be repeated for all spots. Calculate the nominal intensity over the spot for both the red and green layers. A measure of gene expression level can then be calculated from the two color intensities.
4. Experimental Results
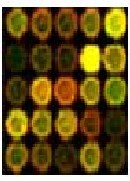
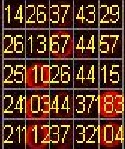
The gridding process is done for 5*5 microarray image seg- mentation. Automatic gridding is performed by vertical and horizontal profiling. The centers of each spots are calculat- ed. The three clust ering t echniques are K - m eans; Fuzzy c-m eans and Thr esholding tec hniques ar e ap- plied on 5*5 m icroarray im age. K-means and fuzzy c- means are compared respectively. By the comparison the result obtained fuzzy c-means is more efficient thee k- means algorithm. The resultshas been showed in figure 4. By applying thresholding technique local thresholding, global thresholding and log thresholding are obtained. By using colour mapping the red and green layers are separat- ed which are the point of our interest.Both red and green intensity of each spot is calculated and measured. And fi- nally the Gene expressions of all the spots are estimated and are measured values were tabulated on each spot.
(a) (b)
5. Conclusion
The goal of this project is to make a fine distinction against the gene expressions in the microarray image processing. For this reason, the k-means and fuzzy c–means methods and ob- served the results. In this paper two clustering methods have been used to make a fine distinction against the gene expres-
sions in the microarray image processing. The clustering
(c) (d)
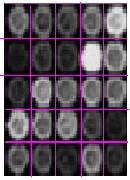
Fig: 4 (a) 5*5 Microarray Image (b) 5*5 Microarray Gridded image (c) K-means clustered microarray image (d) Fuzzy C-- means clustered image

(a) (b)
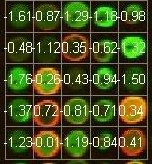
(c)
Fig: 5 (a) Red Intensity of Microarray Image (b) Green Intensi- ty of Microarray Image (c) Microarray Gene Expression.
methods used are fuzzy c-means, k-means and thresholding. The 5*5 segmented microarray images are taken and meas- ured values have been obtained and compared each other. One can conclude that fuzzy c- means is more efficient than the k-means in terms of clustering the signal pixels. This is because fuzzy c-means has ensured a sensitive classification when compared with the k- means. And the method of thresh- olding the intensity of each spot is calculated and the gene expression is observed. These intensity values and gene ex- pression helps in dialogize the disease. The future work would be refining of k-means classification method, so that classi- fication of foreground / background is accurate which works
IJSER © 2013 http://www.ijser.org
International Journal of Scientific & Engineering Research, Volume 4, Issue 9, September-2013 50
ISSN 2229-5518
best even for noisy spots, weakly expressed spots and spots with artifacts.
REFERENCES
[1] Yee Hwa Yang, Buckley M.J. et.al, Comparison of methods for image analysis on cDNA microarray data, 584.
[2] A. A. Ahmed, M. Vias, N. Gopalakrishno Iyer, C.Caldas, and J. D.
Brenton, Microarray segmentation methods significantly influence da- ta precision, Nucleic Acids Research, 32, no.5 e50, 2004.
[3] M.B. Eisen an d P. O . Brown, DNA Arrays f or Analysis of G en e
E x p r es s i on s , Methods Enzymol, 303, 179-205, 1999.
[4] R. Adams and L. Bischof, Seeded Region Grow ing, IEEE Trans.
On Pattern Analysis and Machine Intelligence, 16, 641-647, 1994.
[5] GSI Lumonics, QuantArray Analysis Software, Operator’s Manual,
1999.
[6] M.J. Buckley, Spot’s User Guide, CSIRO Mathematical and Infor-
mation Sciences, Australia, 2000.
[7] S. Wu and H. Yan, Microarray Image Processing Based on Clus- tering and Morphological Analysis,Proc. Of First Asia-Pasific
Bioinformatics Conference, Adelaide, Australia, 111-118, 2003.
[8] Shuanuhu Wu and Hong Yan (2003) Asia-Pacific Bioinformat- ics Conference, Adelaide, Australia. [13] National Human Genome Re- search Institute,
[9] Martin Elbs, Michael Hulko, Jens Frauenfeld, Rainer fischer and
Roland Brock (2007) Anal. Bioanal. Chem., 387, 2017-2025.
[10] N. Giannakeas and D.I. Fotiadis, Image Processing and Machine Learning Techniques for the Segmentation of cDNA Microarray Images, Handbook of research on advanced techniques in diag- nostic images and biomedical application,2008.
[11] J.A. Hartigan and M.A. Wong, “A K-means clustering algorithm”,
Applied Statistics, 28, 1979, pp. 100-108.
[12] J. C. Bezdek, Pattern Recognition with Fuzzy Objective Function
Algorithms, Plenum Press, New York, 1981.
[13] http://www.genome.gov, 2009.
IJSER © 2013 http://www.ijser.org