International Journal of Scientific & Engineering Research, Volume 4, Issue 4, April‐2013 1597
ISSN 2229‐5518
Comparative Analysis and Evaluation of Critical Success Factors and Barriers of Power Quality Programme Implementation Failure in
Developing Countries
Saad. S. Sultan, Abraham. O. Olatoke, M. K. Darwish
Abstract—The aim of this paper is to study the implementation of a Power Quality Programme (PQP) framework, and the obstacles and barriers faced by Libyan Distribution Networks (LDNs) in implementing a PQP. Firstly, to identify the most critical success factors that would have a major impact on PQP implementation in LDNs. Five Critical Success Factors (CSFs) for PQP were identified to examine the level of power quality in LDNs. They are PQ awareness, PQ disturbances, PQ management commitment, PQ employee’s participation and training and PQ customers’ satisfaction. It revealed that all five CSFs were significantly affected by the level of PQ awareness, and the suspension of PQP implementation. An appropriate PQP framework was developed for the purpose of this study to guide LDNs as a case study on developing countries. The proposed PQP framework model was validated based on the identified CSFs, and the barriers and benefits of PQP, which were analysed using different techniques based on both SPSS and NVivo software. The PQP framework was developed from the findings based on the responses of
397 PQ survey participants, and supported by 44 face-to-face semi-structured interviews conducted with professionals and expert LDNs staff. Out of 16 PQP barriers, 13 were statistically significant, which indicated that Libya distribution systems have already surmounted various barriers to implementing a PQP effectively. This framework encourages and guides the implementation teams to have an obvious and clear awareness and vision of how to prevent existing obstacles from reappearing in different forms, leading to long-term PQP improvements. There were 11 overall benefits of PQP implementation, which would have a positive impact on LDNs.
Keywords— CSFs of PQP, PQP Barriers, PQP Benefits, Libyan Distribution Networks, Developing Countries, PQP Framework, PQP Roadmap.
—————————— ——————————
1 INTRODUCTION
n recent years, PQPs have become one of the most recent services offered to distribution companies, both private and state suppliers. For any distribution system to satisfy its consumers, the utility must keep improving PQ in a way, which accommodates the increased demand for electricity [1][2]. This requires a PQP to be implemented to start tackling the difficulties facing the distribution utilities in sustaining a high standard of PQ. A PQP can help in reducing the huge number of complaints from end users, and the costs represented in the damage to their equipment [3]. It can also have a positive impact on the electrical distribution companies, improving their service and saving some of the significant resources spent. Therefore, distribution companies need to implement a PQ investigation programme, given all the facts indicating an increase in PQDs, particularly in the last
two decades [4].
On the other hand, PQP implementation is essential for the future of PQ, especially in urban, rural and remote areas in developing countries [5][6]. PQPs allow distribution utilities to improve the power supply by conducting such programmes regularly to reduce end users’ complaints, and satisfy them in a way appropriate to their expectations. In addition, implementing a PQP can overcome barriers, including the lack
of: a clear strategy, end user awareness, accommodation for economic growth, equipment standards, distribution network design, planning and infrastructure, resources, staff awareness, skills and experience, top management responsibility and commitment, training courses and support, and financial resources, as well as PQ measurement, consultants, standards, monitoring and databases. Furthermore, PQPs can increase the knowledge and skills of distribution utilities’ staff by overcoming the complicated PQDs that most frequently occur by offering them education and training courses to raise PQ awareness.
2 POWER QUALITY PROGRAMMES (PQPS)
PQPs are particularly successful in developed countries rather than developing countries, due to the rapid adoption of sophisticated technology, as well as the higher level of PQ awareness among most of the end users, who recognize its importance. Furthermore, power suppliers in developed regions are trying to establish a high level of PQ standards in a short time, due to pressure from large industrial customers, as the use of sophisticated equipment increases[4]. Developing countries should exploit the PQP experience of developed countries to help in overcoming the shortcomings mentioned above in large and small distribution systems. PQP implementation will require effort from top management,
IJSER © 2013 http://www.ijser.org
International Journal of Scientific & Engineering Research, Volume 4, Issue 4, April‐2013 1598
ISSN 2229‐5518
staff and end users. In addition, government-controlled distribution utilities need support from public and private sector bodies in raising PQ awareness, so as to become part of their culture.
The absence of PQ awareness will lead to significant effect on both utilities’ and end users’ equipment, costing them money.
Therefore, there is a need for a “PQ awareness programme”, which would be responsible for spreading PQP services across the distribution systems, and can provide those services to the utilities that need to improve PQ performance [1]. As a result, table1 states the cost of industries and end users suffer losses due to poor PQ and the failure of implementing PQP.
TABLE 1
COST OF INDUSTRIES AND END USERS LOSSES DUE TO POOR POWER QUALITY
Industrial Type | PQ Disturbances | Total Cost | Author s |
Large Brazilian Customer | Harmonics, Voltage Sag, Interruption | 1.2 $ million annually | [7] |
International’s paper mill in Deferiet, New York | Voltage sag, Power Interruption | $1 million annually | [8] |
Textile Industrial plant Italy | Voltage sag | 235,600 $ million annually | [9] |
plastics manufacturing facility | Voltage sag | 1.7 $ million annually | [10] |
Production Problems in a Plastics plant | Voltage sags Momentary interruptions | 30$ million annually | [11] |
Information Technology Equipment (ITE) Industry | Transients, Outages Voltage sags | 4 $ million annually | [12] |
Champion International Corporation’s Deferiet Paper Mill in Deferiet, NY | Voltage sags | 1 $ million annually | [13] |
Semiconductor Industry China | Power Interruption | 1.5 $ million annually | [14] |
DuPont International Company | Outage | 75 $ million annually | [15] |
Industrial Process Equipment Germany | Voltage sags, Power Interruption | €32 billion | [16] |
Industrial and Commercial Power Systems | Voltage sags | 2 $ million annually | [17] |
Electrical Power Quality and Utilisation Industrial sectors 8 Developed Countries Austria, France, Italy, Poland, Portugal, Slovenia, Spain and United Kingdom | Voltage dips, Short interruptions, Long interruptions, Harmonics, Transients, and surges | €150 billion | [18] |
Massachusetts’ industrial and Digital Economy Companies USA | Voltage Fluctuations, Voltage sags Outage | 1.4 $ billion annually | [19] |
industrial & digital economy companies USA | voltage dips, short interruptions | 119$ to 188 $ billion Ann | [20] |
The semiconductor industry in Taiwan | voltage dip | € 1.7 million annually | [21] |
plastic extrusion industry Singapore | A short interruptions voltage dip | € 3 million annually | [22] |
steel industry Sweden | Voltage dip | € 2.4 million annually | [23] |
California businesses DE, CPM , and F&ES industries sectors | outages | 18.8 $ billion annually | [24] |
A glass factory in France | Outages, Harmonic Distortions, Power supply reliability, Voltage dips | €1 million annually | [25] |
Cost to Customer of Power Quality Disturbances UK | Transients, Interruption | £ 200 million annually | [26] |
Industrial and Domestic sectors, 330 large power users , South Africa | Voltage sag and transients | $ 350 million annually | [27] |
domestic and industrial customers , Norway | Transient, overvoltage, voltage dips | €107.6 million annually | [28] |
industrial customers, Sweden | short interruption and voltage sag | €157 million annually | [28] |
industrial and residential customers, France | Long interruptions and voltage quality | €37 million annually | [28] |
256 industrial companies, Italy | long interruption and voltage sag | €180 million annually | [28] |
To classify the barriers facing the implementation of a PQP and also the expected benefits from implementing such a programme, a literature review has been carried out and is summarized in two sections, namely PQP barriers and PQP benefits:
3 BARRIERS TO IMPLEMENTING A PQP
Since 1980, PQ issues have been causing real and significant disturbances to the distribution systems and end users,
becoming a global concern. Hence, the lack of awareness of PQ could result in utilities still suffering from PQ problems caused by end users’ sensitive equipment for industrial, agriculture, residential and commercial [1]. Therefore, providing sufficient introduction, definitions and explanations for the most widespread PQ terms, will help in identifying the more common PQ disturbances that occur. Moreover, those producing or using the power, in particular in less developed countries, should understand what PQ means. The reason is that as long as the concept of PQ is misunderstood by both the staff of the electrical distribution
IJSER © 2013 http://www.ijser.org
International Journal of Scientific & Engineering Research, Volume 4, Issue 4, April‐2013 1599
ISSN 2229‐5518
company and the end users, then the severity of PQ issues will increase every day, because the demand for power will increase and even double [29].
Several authors and researchers have determined different aspects of barriers according to their experience and their studies on the implementation of PQP.
A study in the UK revealed eight major categories of PQP barriers: lack of staff awareness regarding PQ issues; lack of enough resources; lack of PQ training courses; lack of top management committed to implementing good PQP; lack of long-term strategy for successful implementation; lack of end users’ awareness; lack of PQ standards and lack of regular maintenance [30]. A study conducted by Ghatol and Kushare found two aspects of PQP barriers in less developed countries; lack of network designing; and lack of end users’ awareness regarding power quality [31]. A survey in the USA, conducted for the North American Delivery Systems found two barriers to PQP implementation; lack of customer cooperation i.e. illegal connection made by end users; and lack of top management responsibility to face customer complaints [32]. A study in a Massachusetts distribution system found three barriers to PQP implementation; lack of PQ standards; lack of cooperation by end users; and lack of management commitment regarding end users’ complaints [19].
A study by EPRI in the USA pointed out nine components of PQP implementation barriers; lack of top management commitment, support and encouragement; lack of skills, knowledge and experience among engineers’ and technicians; lack of proper teams to analyse PQ disturbances; lack of training courses; and lack of a PQ database [33]. Another study in the USA, Asia, Africa, Australia, South America and Europe revealed a lack of power quality awareness among end users; and lack of PQ training courses [34]. A further study in the USA revealed two barriers believed to hinder the successful implementation of PQP; lack of a utilities distribution structure; and lack of suitable management structure and operation [35]. A study in Malaysia found that five barriers to implementing a PQP were a ; lack of education programs; lack of PQ awareness and guidelines; lack of training courses and support; lack of continuing research and
development; and lack of financial incentives to encourage the staff to resolve PQ issues [36].
A survey conducted in 8 developed European countries, namely; Austria, France, Italy, Poland, Portugal, Slovenia, Spain and the UK, found that a lack of end users’ awareness; lack of employee awareness and skills; lack of management commitment; and lack of PQ measurements and maintenance are the main barriers to PQP implementation. These factors have led to huge economic losses in Europe, exceeding €150bn annually [37]. Another survey in Europe found that the main difficulties encountered during the implementation of PQP are lack of PQ awareness among top management, engineers and end users; lack of network designing, due to increased power demand; lack of PQ standards; lack of PQ measurement [25].
A study in Canada revealed that three main factors impede the wider spread of PQPs; lack of PQ consultants; lack of PQ standards; and lack of PQ awareness on the part of end users [38]. A study in the Netherlands found five significant difficulties in implementing PQP, namely; lack of a distribution networks infrastructure; failure to handle end users’ complaints so as to identify the underlying problems; lack of PQ contracts between suppliers and end users; increasing sensitive electronic equipments; lack of PQ training courses to raise the education and awareness levels of engineers to understand consumers’ complaints better [39].
Another study in Germany found twelve barriers to PQP implementation; lack of distribution network designing, structure and size; lack of data on end users’ load characteristics and structure; inadequate background and experience among employees regarding PQ; lack of PQ standards; lack of PQ measurement; lack of management planning and strategy [32]. A study in India found two major barriers to PQP implementation; lack of PQ measurement; lack of PQ awareness and skills among employees [40]. A second study in India found four significant categories of PQP barriers; lack of planning and designing the distribution network; lack of proper PQ teams; lack of PQ monitoring and databases to analyze customer complaints; and lack of PQ standards [41]. In Pakistan, a study found that lack of understanding PQ disturbances is a major obstacle to the implementation of a PQP to be achieved [42].
A study conducted by Moncrief, Dougherty, Richardson, and Craven found five main barriers to PQP implementation; lack of end users’ awareness; lack of PQ equipment standards; lack of PQ awareness among employees; lack of PQ monitoring and databases regarding end users’ complaints as a form of assistance to the utilities; lack of PQ measurements [43]. A study in Latin America found three barriers encountered during the implementation of PQP; lack of PQ monitoring and datasets; lack of PQ standards; lack of PQ employee’ awareness and experience [44]. A study in Brazil
found seven factors as the main barriers to PQP implementation; lack of distribution networks infrastructure; lack of studies and research; lack of distribution network design; lack of management planning; lack of technician and engineer skills and experience; lack of end users’ awareness; lack of a clear strategy[45]. The 16 PQP barriers are listed in table 2.
IJSER © 2013 http://www.ijser.org
International Journal of Scientific & Engineering Research, Volume 4, Issue 4, April‐2013 1600
ISSN 2229‐5518
TABLE 2
LIST OF POWER QUALITY PROGRAM BARRIERS
Item No | PQP Barriers |
BA1 | lack of staff awareness, skills and experience |
BA2 | lack of end users awareness |
BA3 | lack of customer cooperation |
BA4 | lack of long‐term strategy and planning |
BA5 | lack of top management commitment |
BA6 | lack of network designing |
BA7 | lack of distribution networks infrastructure |
BA8 | lack of conducting research and studies |
BA9 | lack of top management responsibility |
BA10 | lack of training courses, and support |
BA11 | lack of financial resources |
BA12 | lack of enough incentives |
BA13 | lack of PQ measurement |
BA14 | lack of PQ consultants |
BA15 | lack of PQ standards |
BA16 | lack of PQ monitoring and database |
4 POWER QUALITY SURVEY IN LIBYAN DISTRIBUTION
NETWORKS
The rapid growth of the Libyan economy began in 1999 [46,
47]. Therefore, since the early 1999, tackling PQ events has been a priority for Libyan distribution systems (LDSs) [48, 49]. Since Before that, from 1991 to 1999, Libya was under a political, economic and trade blockade. Thus, the increase in peak load was not as rapid as it is nowadays; it was 4,756 MW in 2008, and expected to increase to 18,417 MW by 2025 [50] . Moreover, the level of power delivered was not at its worst level, this is mainly because sensitive equipments were not yet introduced widely before 1999. The current and grown new Libya economy is mainly based on digital equipments and high technology, such as sensitive electronic equipment and electrical tools used in industrial, commercial, and residential setting, which are very susceptible to PQ variations. Nonetheless, LDNs have not been implemented PQP to increase the level of awareness, as economic well being increased among all end users, and to measure the level of disturbances in the last two decades, current and future. The impact of PQ issues would be reduced, if a PQP was implemented to increase the level of PQ awareness due to competitiveness of a rapid developing economy [1]. As a result, since 1999 LDNs have suffered bad power quality. Despite previous PQP frameworks’ contributions to understanding the barriers and benefits of implementing PQP, they are not sufficient to explain the particular circumstances of PQ issues in LDNs. Therefore, after the comprehensive literature review, and the findings from the field study, and in order to gain full understanding of the LDNs case, there was a need to develop a PQP framework due to possible reasons:
There is a lack of PQP implementation resulting from a lack of management strategy to cope with the expansion in generation and transmission systems.
There is a lack of PQ standards to be followed by the company in any evaluation or comparison of PQD records in the Libyan distribution systems.
There is a lack of employee experience and skills arising from a lack of awareness of PQ, and so employees are not equipped to deal with PQ problems technically.
There is a lack of end user awareness of the concept of PQ given the excessive use of non-linear loads and sensitive equipment.
There is a lack of management planning in the proper design of distribution networks.
There is a lack of control over the import of electronic equipment since 1999, due to competitive marketing and deregulation.
In response to this, there was significant need to conduct a PQ survey. The survey was designed based on the literature review derived for this study. It is revealed that lack of PQ awareness is the main issue for Libyan west, east and south distribution networks. Table 3 shows the type of distribution networks along with the categories of end users involved in the study. Large distribution networks were considered to have more categories of end users; the western distribution network (WDN1), southern distribution network (SDN2) and eastern distribution network (EDN3).
TABLE 3
TYPE OF LIBYAN DISTRIBUTION NETWORKS (LDNS)
Distribution Networks | Residential | Commercial | Industrial | Agricultural |
WDN1 | √ | √ | √ | |
SDN2 | √ | | √ | √ |
EDN3 | √ | | √ | √ |
Power quality survey was designed to answer two main objectives;
1. To investigate the main reasons underlying PQP
barriers leading to PQDs in LDNs.
2. To identify the most critically significant factors, PQP
barriers that would have a major impact on PQDs and
PQP implementation, in order to facilitate developing
PQP framework as guidelines through which LDNs
could implement, maintain, and improve the power
supply, in terms of quality, for end users.
5 RESEARCH METHOD AND SURVEY INSTRUMENT
The above literature review helps the researcher to understand the different barriers to PQP implementation and the expected benefits of PQP. Two stages of data analysis
IJSER © 2013 http://www.ijser.org
International Journal of Scientific & Engineering Research, Volume 4, Issue 4, April‐2013
ISSN 2229‐5518
1601
were applied to answer the research objectives. The first stage involved PQ survey questionnaire data collection, conducted during April-June 2010. The second stage involved interview survey data collection, conducted in late December 2010 and early January 2011 in LDNs. PQ survey was designed based
due to being combined with varying user’s categories in the three networks.
on six factors, identified as CSFs for PQP

implementation
with total sub-factors comprising 34 items, where four factors were also identified as the main PQP barriers, with a total of
16 items to measure the level of PQP implementation,
397
PQ survey respondents
participated in assessing
the
current level of PQ and the implementation level of PQP from
LDNs staff involved in PQ improvements,
including head
managers, middle managers,
engineers,
technicians
and
employees, who
have between 6 to 15 years’ experience
giving a response rate of 81%. The data were analysed by using Statistical Package for Social Science (SPSS) software,
ng
ent, ters
version 18. Moreover, 44
face-to-face
semi-structured
interviews were
conducted with professionals, experts in
LDNs, and staff in four departments, which are distribution, planning, training and customer departments, including head managers, engineers, technicians and employees, to state the difficulties and barriers facing LDNs in implementing PQP and to make the developed PQP framework more valid. Data
6.2
Fig. 1: Sources of PQ Disturbances - by responses %
PQ Disturbances Affecting Networks
gathered by the questionnaire from the distribution system
Fig.
2 illustrates
the repeated level of power quality
respondents were checked in terms of accuracy, outliers and,
normality; then analyzed using (SPSS) software.
disturbances (PQDs) are occurred across the three networks. The disturbances which considered as highly significant are long interruption is pointed approximately 45 % in WDN, 34
6 POWER QUALITY SURVEY RESULTS AND DISCUSSION
% EDN
and 52% SDN. Voltage sags and swells are other
Some of the harmonics, short
power quality disturbances include:
interruptions, long interruptions, voltage
disturbances which are considered to be as highly significant and recorded 44 % in WDN, 30% in EDN and 43% in SDN
sags
& swells,
under voltage, over voltage, flicker &
among other disturbances and they are occur so often in both
unbalance, transient & surge, low power factor and voltage collapse. These disturbances are considered in the statistical
three networks. Roughly 43 % in WDN, 26% in EDN and 44%
in SDN refer to under voltage as one of the most disturbances
analysis presented in this paper. Results obtained from the
which
occur constantly. This was clear evidence that both
survey indicate the current status of power quality in Libyan
three
networks are affected
due to main sources of
distribution utility staff’s point of view. Almost 400 responses
equipments mentioned earlier in Fig. 1. However, the rest of
have
been provided by one
of the 3 major distribution
other
PQDs are
not as significant as the
long power
networks, indicating opinions of the level of PQ among both

residential, agriculture, commercial and industrial users.
interruption, under voltage and sags and swell.
6.1
Main Sources of PQ Disturbances
Fig. 1 shows
the differences between
the equipment
causing PQ problems across the three networks. The figure
shows that electronics equipment is the largest source of
PQDs. Although electronic equipments can be seen as a small load compare to, say, air conditioning loads; the disturbances generated by electronic equipments is extremely large with total harmonic distortion reaching 200% [29]. All loads shown in Fig.1 are non-linear loads and it is these types of loads which are in the increase. Approximately 54.3% respondents
refer
to Air conditioning equipment, which was the
top
causing of power quality problems in the
three networks,
which are operated intensively when the temperature rises, reaching 50 Celsius. As mentioned earlier, the effect of these equipment categories varied from one network to another,

IJSER © 2013 http://www.ijser.or
International Journal of Scientific & Engineering Research, Volume 4, Issue 4, April‐2013
ISSN 2229‐5518

Fig. 2: PQ Disturbances Affecting Network- %
1602
In addition, Fig. 2 indicates that Around 42 % of
the
participating resp
ndents refer to low power factor is one of
the disturbances, which caused PQ problems, especially in
SDN due to heavy loads such as the Great Man-Made River
Projects pumping
plants and
random private agriculture
projects are connected to this network.
6.3
Causes of PQ Disturbances
Fig. 3 shows the most common group causing PQDs. Lack of PQ awareness is considerably seen as the highest significant factor of causing the problems, where 31 % of the respondents cited that. As lack of awareness, approximately 26% of the
Natural
Causes
9%
end
users connected illegally,
as well as
it increased
the
Fig. 3: Causes of PQ Disturbances - by responses %
excessive use of
electronic equipments, which introduced
after
1999 of causing PQDs.
This was due to non-linear
equipments, which are very
sensitive to
power supply 7
CRITICAL SUCCESS FACTORS OF PQP
variation (long interruption
79%). In addition, lack of
network designing at higher level as the third factor caused
Table 4 shows the Pearson correlation between all pairs of
PQDs by 20 %.
Therefore,
the demand
on the power
the five CSFs, which used in this study to identify if there is
generated has led the industries to demand and share it along
any significant correlation among these factors to implement
with the increase demand in the domestic sector in the same
PQP.
The five factors were
PQDs Definitions, PQCS
line.
These complex combinations required
LDN to have
(Customer Satisfaction), PQMC (Management Commitment),
power quality programs to make the network more efficient
PQEPT
(Employee
Participation
and Training) and PQ
due
to the complex interconnection. Figure 3 gives more
(Customers and Company Awareness) throughout the three
details about each aspect causes PQ issues with level of
percentage by respondents.
networks.
TABLE 4
PEARSON’S CORRELATION THE CSFS OF PQP IN THREE NETWORKS
Networks | CSFs of PQP | PQDs | PQCS | PQMC | PQEPT | PQA |
West Network | PQ Disturbances (PQDs) | 1 | | | | |
West Network | Customers Satisfaction (CS) | 0.256** | 1 | | | |
West Network | Management Commitment (MC) | 0.299** | 0.486** | 1 | | |
West Network | Employees Participation and Training (EPT) | 0.361** | 0.482** | 0.485** | 1 | |
West Network | PQ Awareness (PQA) | 0.559** | 0.595** | 0.597** | 0.621** | 1 |
East Network | CSFs of PQP | PQDs | PQCS | PQMC | PQEPT | PQA |
East Network | PQ Disturbances (PQDs) | 1 | | | | |
East Network | Customers Satisfaction (CS) | 0.408** | 1 | | | |
East Network | Management Commitment (MC) | 0.338** | 0.470** | 1 | | |
East Network | Employees Participation and Training (EPT) | 0.486** | 0.641** | 0.554** | 1 | |
East Network | PQ Awareness (PQA) | 0.568** | 0.610** | 0.431** | 0.551** | 1 |
South Network | CSFs of PQP | PQDs | PQCS | PQMC | PQEPT | PQA |
South Network | PQ Disturbances (PQDs) | 1 | | | | |
South Network | Customers Satisfaction (CS) | 0.618** | 1 | | | |
South Network | Management Commitment (MC) | 0.442** | 0.464** | 1 | | |
South Network | Employees Participation and Training (EPT) | 0.481** | 0.497** | 0.665** | 1 | |
South Network | PQ Awareness (PQA) | 0.661** | 0.715** | 0.554** | 0.657** | 1 |

IJSER © 2013 http://www.ijser.org
International Journal of Scientific & Engineering Research, Volume 4, Issue 4, April‐2013 1603
ISSN 2229‐5518
From table 4, it is clear that the correlations of the entire five CSFs of PQP are positive and statistically significant. High correlation appeared between the Employee Participation and Training (PQEPT) and PQ Awareness (PQA), with Pearson’s Coefficient (r) of (0.621**) in the west network. Another high correlation appeared between the Employee Participation and Training (PQEPT) with Customer Satisfaction (PQCS) with (0.641**) in east network. Customer Satisfaction (PQCS) with PQ Awareness (PQA) were highly correlated (0. 715**), which was strong enough be proved statistically in south network. The correlations within the CSFs of PQP were tested to check the PQP implementation in LDNs. The test pointed out that all five factors were positively correlated. On the other hand, in order to find the significant answer concerning objective two, which is to identify the most important and significant factors to assess PQP implementation within LDNs, which could be applied and adapted internationally. In response, the relative importance index method (RII) was used to identify the relative importance of each critical success factor (CSF) in west, east and south distribution networks, as shown in table
5.
TABLE 5
THE RESULTS OF THE RII AND THE RANK OF CSFS AFFECTING PQP
IMPLEMENTATION
Table 5 illustrates the most important CSFs, which significantly affected PQP implementation according to each west, east and south distribution network current level. These are 1) PQ awareness, 2) PQ disturbances, 3) PQ management commitment, 4) PQ employees participation and training and
5) PQ customers satisfaction. According to LDNs, it seems that PQ awareness was the most important factor, which delayed the implementation of PQP, as it was ranked first among all CSFs, with relative index (RII) = 6.493 for west distribution network, 6.691 for east distribution network, and 6.626 south distribution network. This agreement between all three distribution networks may be referred to lack of PQ awareness among LDNs top management to implement PQP effectively. Consequently, this can confirm that the ranked importance factors of all five CSFs of PQP are positive, and statistically significant among west, east and south distribution network, since the p-values (Sig.) are less than 0.05.
8 POWER QUALITY PROGRAMME BARRIERS
Respondents were asked to define how far any of the 16
PQP potential barriers (BA) cause current difficulties in implementing a PQP in LDNs. The 16 PQP barriers are listed in table 6. All factors were designed in a five-point Likert scale format (1=not applicable; 2= very low extent; 3= low extent; 4= moderate; 5= high extent). Data gathered were checked once more in terms of accuracy, outliers and, normality; then analysed using (SPSS) software version 18.1 [51]. Barriers BA
1-4 belong to factor 1 and can be categorized under ‘lack of PQP awareness’, whereas barriers BA 5-9, belong to factor 2 and are categorized as ‘lack of PQP top management attention’. Barriers BA 10-12 belong to factor 3 and pertain to
‘lack of PQP resources’ and finally barriers BA 13-16 belong to factor 4, dealing with ‘lack of PQP involvement’[52].
TABLE 6
LIST OF PQP BARRIERS MEAN, STD. DEVIATION AND SIGNIFICANT VALUES
Items | Factors | Barriers | Sig | Mean | S.D |
BA1 | F1: Lack of PQP Awareness | lack of staff awareness, skills and experience | 0.035 | 3.44 | 1.335 |
BA2 | F1: Lack of PQP Awareness | lack of end users awareness | 0.033 | 3.68 | 1.349 |
BA3 | F1: Lack of PQP Awareness | lack of customer cooperation | 0.337 | 3.52 | 1.321 |
BA4 | F1: Lack of PQP Awareness | lack of long‐term strategy and planning | 0.036 | 3.16 | 1.407 |
BA5 | F2: Lack of PQP Top Management Attention | lack of top management commitment | 0.044 | 3.51 | 1.411 |
BA6 | F2: Lack of PQP Top Management Attention | lack of network designing | 0.049 | 3.52 | 1.332 |
BA7 | F2: Lack of PQP Top Management Attention | lack of distribution networks infrastructure | 0.021 | 3.47 | 1.332 |
BA8 | F2: Lack of PQP Top Management Attention | lack of conducting research and studies | 0.447 | 3.01 | 0.863 |
BA9 | F2: Lack of PQP Top Management Attention | lack of top management responsibility | 0.043 | 3.34 | 0.732 |
BA10 | F3: Lack of PQP Resources | lack of training courses, education and support | 0.022 | 3.06 | 0.952 |
BA11 | F3: Lack of PQP Resources | lack of enough resources | 0.044 | 3.09 | 0.965 |
IJSER © 2013 http://www.ijser.org
International Journal of Scientific & Engineering Research, Volume 4, Issue 4, April‐2013 1604
ISSN 2229‐5518
BA12 | | lack of financial incentives | 0.242 | 3.09 | 1.002 |
BA13 | F4: Lack of PQP Involvement | lack of PQ measurement | 0.031 | 3.76 | 1.015 |
BA14 | F4: Lack of PQP Involvement | lack of PQ consultants | 0.041 | 3.81 | 0.934 |
BA15 | F4: Lack of PQP Involvement | lack of PQ standards | 0.029 | 3.75 | 1.068 |
BA16 | F4: Lack of PQP Involvement | lack of PQ monitoring and database | 0.028 | 3.94 | 0.997 |
Overall Mean | 3.44 | 1.126 |
Table 6 illustrates the ANOVA test along with the list of PQP Barriers Mean, Std. Deviation and Sig values. Out of 16 barriers, 13 were statistically significantly different at the P value <0.05. The significant PQP barriers were BA1, lack of staff awareness, skills and experience, BA2, lack of end users awareness, BA4, lack of long-term strategy and planning, BA5, lack of top management commitment, BA6, lack of network designing, BA7, lack of distribution networks infrastructure, BA9, lack of top management responsibility, BA10 lack of training courses, education and support, BA11, lack of
sufficient resources, BA13, lack of PQ measurement, BA14,
lack of PQ consultants, BA15, lack of PQ standards, and BA16, lack of PQ monitoring and database.
Table 7 illustrates the post-hoc tests to point out, where the differences lie between PQP factors among LDNs after obtaining the significant values from the ANOVA table. If the Sig. value was equal to or less than 0.05 then the asterisks (*) in the column mean difference indicate that the three LDNs being compared are significantly different from one another at the p< 0.05 level with PQP factors.
TABLE 7
POST-HOC MULTIPLE COMPARISONS USING THE TUKEY HSD TEST
Dependent Variable | (I) Which Network do you work at? | (J) Which Network do you work at? | Mean Difference (I‐J) | Std. Error | Sig. |
PQP Awareness | DN1 | DN3 | ‐.228(*) | 0.078 | 0.010 |
PQP Awareness | DN1 | DN2 | ‐0.079 | 0.083 | 0.606 |
PQP Awareness | DN3 | DN1 | .228(*) | 0.078 | 0.010 |
PQP Awareness | DN3 | DN2 | 0.149 | 0.086 | 0.193 |
PQP Awareness | DN2 | DN1 | 0.079 | 0.083 | 0.606 |
PQP Awareness | DN2 | DN3 | ‐0.149 | 0.086 | 0.193 |
PQP Top Management Attention | DN1 | DN3 | ‐0.183(*) | 0.066 | 0.016 |
PQP Top Management Attention | DN1 | DN2 | ‐0.155 | 0.070 | 0.069 |
PQP Top Management Attention | DN3 | DN1 | 0.183(*) | 0.066 | 0.016 |
PQP Top Management Attention | DN3 | DN2 | 0.028 | 0.073 | 0.924 |
PQP Top Management Attention | DN2 | DN1 | 0.155 | 0.070 | 0.069 |
PQP Top Management Attention | DN2 | DN3 | ‐0.028 | 0.073 | 0.924 |
PQP Resources | DN1 | DN3 | 0.140 | 0.106 | 0.383 |
PQP Resources | DN1 | DN2 | ‐0.178 | 0.112 | 0.252 |
PQP Resources | DN3 | DN1 | ‐0.140 | 0.106 | 0.383 |
PQP Resources | DN3 | DN2 | ‐0.317(*) | 0.117 | 0.019 |
PQP Resources | DN2 | DN1 | 0.178 | 0.112 | 0.252 |
PQP Resources | DN2 | DN3 | 0.317(*) | 0.117 | 0.019 |
PQP Involvement | DN1 | DN3 | ‐0.150(*) | 0.060 | 0.033 |
PQP Involvement | DN1 | DN2 | ‐0.084 | 0.063 | 0.377 |
PQP Involvement | DN3 | DN1 | 0.150(*) | 0.060 | 0.033 |
PQP Involvement | DN3 | DN2 | 0.066 | 0.066 | 0.578 |
PQP Involvement | DN2 | DN1 | 0.084 | 0.063 | 0.377 |
PQP Involvement | DN2 | DN3 | ‐0.066 | 0.066 | 0.578 |
In brief, a post-hoc Least Significance Difference (LSD) test was carried for the four PQP framework factors. The respondents agreed that PQP factors have significant effect on LDNs in terms of level of PQP Awareness, PQP Top Management Attention, PQP Resources and PQP Involvement. As a result, it can be said that LDNs have so far struggled to implement PQP effectively [53][54].
9 THE RELATIVE IMPORTANCE INDEX (RII) AND RANK OF PQP BARRIERS IMPLEMENTATION
The relative importance index is technique, which has been used widely in different types of questionnaire to rate each factor based on the weight given by the respondents [55]. It is very important to state, which significant barrier is most affecting the implementation of PQP. The relative importance index method (RII) is employed in this thesis to identify,
IJSER © 2013 http://www.ijser.org
International Journal of Scientific & Engineering Research, Volume 4, Issue 4, April‐2013 1605
ISSN 2229‐5518
which one of the sixteenth PQP barriers is most affected the implementation of PQP in three LDNs west, east and south after the significant level is obtained.
The relative importance index (RII) and rank of PQP barriers, which are considered as the key factors affecting the implementation of PQP presented in table 8. Lack of PQ standards has been ranked the first factor affecting the implementation of PQP by the west distribution network respondents (RII) = 0.541 and east distribution network respondents (RII) = 0.543 respondents. However, this factor has been ranked as third by south distribution network respondents (RII) = 0.532. The overall rank for this factor among all factors with relative index (RII) = 0.538. It is noted that this factor identified as most important for west and east distribution network as they lack of PQ standards, which affect both the supplier and end user. Moreover, this factor has
affected the end user sensitive equipments as well as the distribution network operators to assess the level of PQ. As a result, end user complaint regarding PQDs due to lack of PQ standards. Lack of staff awareness, skills and experience has been ranked the second factor affecting the implementation of PQP by east respondents (RII) = 0.542 and south distribution network respondents (RII) = 0.546. However, this factor has been ranked as third by west distribution network respondents (RII) = 0.525. The overall rank for this factor among all factors with relative index (RII) = 0.537. This factor is considered as a significant obstacle for LDNs staff, whereby they could not improve PQDs, satisfy end user, identified PQDs roots, increase their knowledge and skills, aware end user regarding PQ issues and the most important element their contribution in implementing PQP.
TABLE 8
PRESENTED THE RELATIVE IMPORTANCE INDEX (RII) AND PQP BARRIERS RANKING
Items | Barriers | West Network | East Network | South Network | Overall |
Items | Barriers | RII | Rank | RII | Rank | RII | Rank | RII | Rank |
BA1 | lack of staff awareness, skills and experience | 0.525 | 3 | 0.542 | 2 | 0.546 | 2 | 0.537 | 2 |
BA2 | lack of end users awareness | 0.447 | 8 | 0.481 | 5 | 0.459 | 10 | 0.462 | 8 |
BA3 | lack of customer cooperation | 0.518 | 4 | 0.523 | 4 | 0.562 | 1 | 0.534 | 3 |
BA4 | lack of long‐term strategy, planning | 0.501 | 5 | 0.468 | 7 | 0.493 | 7 | 0.487 | 5 |
BA5 | lack of top management commitment | 0.471 | 6 | 0.435 | 9 | 0.458 | 11 | 0.454 | 9 |
BA6 | lack of network designing | 0.532 | 2 | 0.525 | 3 | 0.514 | 5 | 0.523 | 4 |
BA7 | lack of DNs infrastructure | 0.441 | 11 | 0.447 | 8 | 0.439 | 13 | 0.442 | 11 |
BA8 | lack of conducting research and studies | 0.443 | 9 | 0.432 | 10 | 0.515 | 4 | 0.463 | 7 |
BA9 | lack of top management responsibility | 0.423 | 13 | 0.412 | 13 | 0.462 | 8 | 0.432 | 12 |
BA10 | lack of training education courses | 0.408 | 14 | 0.358 | 16 | 0.441 | 12 | 0.402 | 16 |
BA11 | lack of enough resources, , and support | 0.398 | 15 | 0.407 | 14 | 0.428 | 14 | 0.411 | 14 |
BA12 | lack of financial incentives | 0.456 | 7 | 0.421 | 11 | 0.461 | 9 | 0.446 | 10 |
BA13 | lack of PQ measurement | 0.392 | 16 | 0.406 | 15 | 0.424 | 16 | 0.407 | 15 |
BA14 | lack of PQ consultants | 0.442 | 10 | 0.474 | 6 | 0.502 | 6 | 0.472 | 6 |
BA15 | lack of PQ standards | 0.541 | 1 | 0.543 | 1 | 0.532 | 3 | 0.538 | 1 |
BA16 | lack of PQ monitoring and database | 0.427 | 12 | 0.415 | 12 | 0.426 | 15 | 0.422 | 13 |
As indicated in table 8, lack of customer cooperation has been ranked by the west respondents as the fourth factor with RII equal 0.518. It has been ranked by the east respondents as the fourth factor with RII equal 0.523 and has been ranked by the south respondents as the first factor with RII equal 0.562.
The overall rank for this factor among all factors with relative index (RII) = 0.534. The three distribution network respondents considered this factor as an important due to the neglect of end user to cooperate with LDN management in order to improve PQDs and implement PQP. As a result, the end user are not satisfied about the bad PQ they utilize as well as their complaints are not taken seriously. Therefore, this factor affects directly on PQP implementation as they do not trust LDN department to take their suggestion into account,
when measuring or improving PQDs. If customers are not
cooperated as part of PQP implementation, the implementation will suffer from issues of considering end user satisfaction to estimate the real outcome expected from such programme. This result confirms what Grady and Noyola stated regarding PQP implementation, if customer cooperated, which will give necessary and sufficient results needed [56]. In addition, table 8 presented the relative importance index (RII) and rank of PQP barriers, which indicated the most affecting barriers on the implementation from 1 to 16, based on the three LDNs respondents respectively. The relative importance index (RII) and the rank closes to one is considered most important factors affecting on PQP implementation in three west, east and south LDNs. Therefore, from table 8, LDNs need to consider and evaluate each importance barrier based on its rank, which affecting on the whole programme
IJSER © 2013 http://www.ijser.org
International Journal of Scientific & Engineering Research, Volume 4, Issue 4, April‐2013 1606
ISSN 2229‐5518
implementation in order to make significant change on PQDs. This can be done by link all the four factors of PQP framework together in order to make dramatically change within time specified.
10 INTERVIEW RESULTS
The PQP is the first and most significant factor chosen to assess how top management and staff bear their commitment to, and support for implementing PQP. Their commitments
are to understand PQ definition, and the difficulties and benefits of implementing PQP. It was clear that without establishing a clear vision of these factors, which have significant effect on LDNs, then any efforts aimed at improving PQ issues will be a waste in both time and resources. Table 9 shows PQP barriers, which affect LDNs in implementing the PQP framework, and the significant effect of each barrier on each department.
TABLE 9: PQP FRAMEWORK EFFECT BY BARRIER ON EACH DEPARTMENT
PQP Barriers | Customer Department | Planning Department | Distribution Department | Training Department |
1 : Lack of Infrastructure | 0% | 36.17% | 46.29% | 17.54% |
2 : Lack of Customer Awareness | 2.57% | 18.22% | 56.19% | 23.02% |
3 : Lack of Enough Resources | 0% | 10.33% | 11.65% | 78.01% |
4 : Lack of Long Term Strategy | 4.55% | 29.46% | 17.83% | 48.16% |
5 : Lack of Management Commitment | 0.42% | 29.32% | 26.45% | 43.81% |
6 : Lack of Networks Designing | 4.11% | 55.53% | 26.13% | 14.23% |
7 : Lack of PQ Measurement | 2.13% | 49.41% | 43.74% | 4.73% |
8 : Lack of PQ Standards | 0% | 61.65% | 19.63% | 18.72% |
9 : Lack of PQ Training Courses | 0% | 15.15% | 3.72% | 81.13% |
10 : Lack of Regular Maintenance | 0% | 45.79% | 27.97% | 26.25% |
11 : Lack of Staff Awareness | 0.73% | 32.1% | 38.54% | 28.63% |
12 : Lack of Top Management Responsibility | 0% | 80.42% | 19.58% | 0% |
Table 9 illustrates the most common PQP barriers, which affect LDNs in implementing the PQP framework. As can be seen, the four departments, which are supposed to implement PQP, are affected by the twelve PQP barriers. The level of each barrier and its effect on each department are identified by the interviewees. In general, the table shows that all PQP barriers (they are all above 15%) seriously affect LDNs progressing to implement a PQP. One of the clear points is that there was no PQP awareness, which can at least match the significant increase in PQP barriers.
These results indicate that LDNs have not implemented PQP. It showed that the top management has not paid enough attention, support, commitment and responsibility to setting up long-term strategies to implement PQP. Therefore, LDNs have lost LD 464 million annually due to poor PQ and the failure to implement PQP [57]. Moreover, most of members of staff involved in implementing PQDs are middle managers,
52.4% of who held of high diploma qualifications, which is considered the minimum educational level. This means that they are not highly knowledgeable and aware enough to cope with the current severe level of power quality as well; moreover, this level of education would not enable them to understand and participate in implementing PQP. Almost 38% of engineers and technicians have between 6 and15 years of experience, but lack awareness and skills. They should be better taught and trained before they can deal with PQP implementation.
11 DEVELOPED PQP FRAMEWORK
The four PQP framework factors each have their own variables, derived from the literature review, to determine the assumptions, which should exist in LDNs, in order to implement the PQP framework. As a result, an acceptable model was developed based on these factors. It is clear that all these factors are significantly correlated, since all p values are less than (<0.05) and are substantially affected by the implementation of PQP in LDNs, as shown in Fig.4.
IJSER © 2013 http://www.ijser.org
International Journal of Scientific & Engineering Research, Volume 4, Issue 4, April‐2013
ISSN 2229‐5518
1607
F4 PQP Involvement,
T= 10.207
F3 PQP Resources, T=
-3.451
PQP Framework
R²= 78.8%
F1 PQP Awareness, T=
15.204
F2 PQP Management
Attention,
T= 10.829
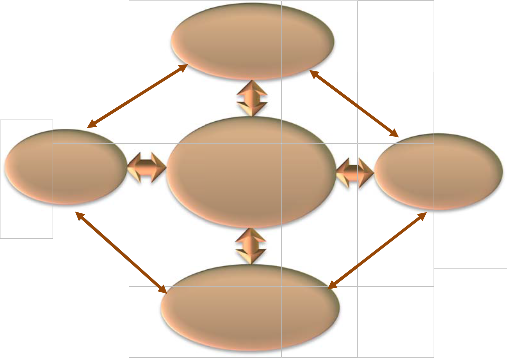
Fig. 4: Developed Model for PQP Framework Implementation
Figure 4 and Table 10 showed that the value of R² was
indicated that the validity of this model is very good. As a
78.8% for this model, which
indicated how much of
the
result, this model can be accepted and applied for LDNs to
variability in the outcome was explained by the predictors,
implement PQP, since all the predictors increase by one unit
which are (PQP Awareness, PQP Management commitment,
(see β
value) as these constructs explained
78.8% of PQP
PQP Resources, and PQP involvement). Since all factors of the
implementation construct (R² = 0.788).
model were statistically significant (p <0.05). This
also
TABLE 10
CONTRIBUTION FACTORS OF PQP FRAMEWORK IMPLEMENTATION
| B | Std .Error | β | T | P | R² | Collinearity Statistics |
Constant PQP Framework | 0.717 | 0.109 | | 6.588 | <0.001 | 0.788 | Tolerance | VIF |
F1 PQP Awareness | 0.516 | 0.034 | 0.546 | 15.204 | <0.000 | | 0.474 | 2.112 |
F2 PQP Management Attention | 0.201 | 0.019 | 0.314 | 10.829 | <0.000 | | 0.729 | 1.373 |
F3 PQP Resources | ‐0.065 | 0.019 | 0.099 | ‐3.451 | <0.001 | | 0.740 | 1.351 |
F4 PQP Involvement | 0.206 | 0.020 | 0.289 | 10.207 | <0.000 | | 0.763 | 1.310 |
model
[58], and has significantly positive effect on PQP
The factors highly contributed to the model were F1 PQP Awareness (β=0.546, p< 0.05), which makes for the strongest
framework implementation and has explained 54.6%
unique contribution factor explaining the
outcome of
the
(T=15.204). F2 PQP Management Attention (β=0.314, p < 0.05), which has significant positive effect on PQP framework
IJSER © 2013 http://www.ijser.org
International Journal of Scientific & Engineering Research, Volume 4, Issue 4, April‐2013
ISSN 2229‐5518
1608
11.1
A ROADMAP FOR POWER QUALITY PROGRAM
implementation and has explained 31.4% (T =10.829), when the variance is explained by all other predictor factors in the
FRAMEWORK
The PQP framework is consisted three essential phases. Phase
model. F3 PQP
Resources (β=0.099, p <
0.05), which
has
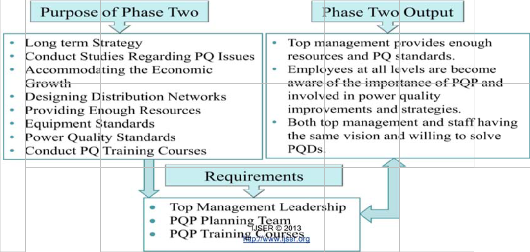
one designed to increase the awareness level. Phase two is
significantly positive effect on PQP framework
involved in preparation of PQP, which contains seven crucial
implementation and has explained 10% (T=-3.451), indicating
requirements. Phase three is
designed to
prevent the
that
it made less
contribution [58]. F4 PQP Involvement
outstanding problems from phase 1 and 2 of not reoccurring
(β=0.289, p < 0.05), which has significant positive effect on
PQP framework implementation, and has explained 29% (T=
again to determine both the weaknesses and obstacles facin
the implementation, to reach a high level of power quality.
10.207). It revealed that all these factors significant positive
Therefore, PQP
framework
is influenced by top
contributors, and have an effect on the implementation of PQP
management’s awareness, which must move from studies an
in LDNs in terms of PQP
Awareness, PQP Management
recommendation to practice. This framework is designed as a
commitment, PQP Resources, and PQP involvement, as shown
guideline for implementation
of PQP in
the Libya
in figure 4.
distribution networks environment. The progress of this
framework and moving through from phase to other will be depended on the level of awareness, knowledge, skills gained respectively after each phase performed. Figures. 5, 6, and 7
show
the three phases of the
proposed
model PQP of
framework respectively.
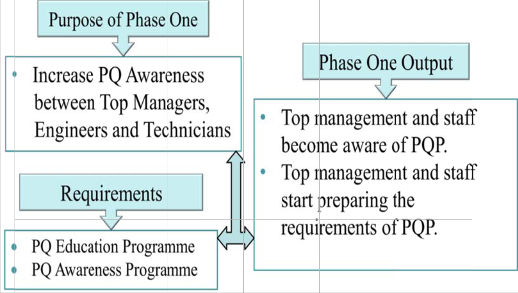
Fig. 5. Phase One Awareness of PQP framework
International Journal of Scientific & Engineering Research, Volume 4, Issue 4, April‐2013
ISSN 2229‐5518
1609
Fig. 6. Phase Two Preparation of PQP framework
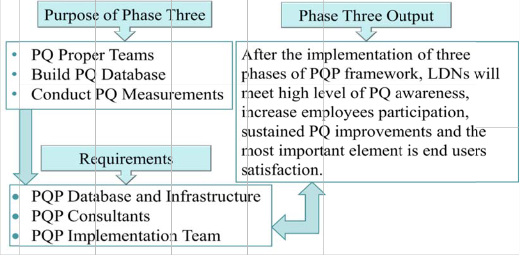
Fig. 7. Phase Three Implementation of PQP framework
Table 11 explains the three phases of the proposed PQP
awareness, knowledge, and skills gained after each phase is
framework. The
progress of
this framework and moving
completed.
through from one phase to another depends on the level of
TABLE 11

PQP FRAMEWORK PROCESS STAGES DEVELOPED FOR THE PURPOSE OF THIS RESEARCH
Framework
Process
Objectives
To determine the present
Purpose
Motivating the top management to be
level of knowledge and
eager and enthusiastic to
start
Stage One: Awareness
awareness regarding PQ
among LDNs staff.
To state the actual needs of
PQP, in terms of training,
implementing the PQP based on the staff knowledge and awareness
Understand the importance of PQP and its features
Gain top management commitment and responsibility
management planning, and
Providing enough
resources regarding
Stage Two: Preparation
commitment, and providing enough resources to implement PQP.
the implementation of PQP
Accommodating economic growth
Involve staff at all levels; engineers, technicians and top managers
Top
managers,
engineers,
and
technicians from all departments have become aware of the importance of PQP
Stage Three: implementatio n
To investigate and solve the main reasons underlying PQ disturbances in LDNs.
Monitor and collect PQ data
Focus on existing end user complaints regarding PQDs
Identify the real causes underlying PQDs
Considering all conditions in the contracts
IJSER © 2013
http://www.ijser.boryg taking legal action against illegal
connections by end users
International Journal of Scientific & Engineering Research, Volume 4, Issue 4, April‐2013 1610
ISSN 2229‐5518
PQP implementation requires great attention from top management that can help the distribution networks to achieve their goals in converting the studies and
11.2 Benefits of PQP Framework Implementation
The mean level of PQP benefits indicates whether or not LDNs will gain significant outcomes after PQP is implemented successfully following the roadmap process for each phase. In response, participants were asked to judge how far one of 11
PQP possible benefits (BN) would be achieved by implementing PQP within Libyan distribution systems. The 11
PQP expected benefits are listed in table 12. All factors were
recommendations into practice by implementing a PQP
practically.
designed in a five-point Likert scale format (1= not sure;
2=negative; 3= moderate; 4= positive; 5= very positive). The
response scale of the survey was divided into three levels of
outcome, where (1.51 to ≤ 2.50 was negative, 2.51to ≤ 3.50,
moderate and, 3.51to ≤ 5 positive).
TABLE 12
LIST OF MEANS LEVEL OF PQP BENEFITS
Item | PQP Benefits | DN1 | DN2 | DN3 | Overall |
BN1 | Increasing the end users awareness | 3.84 | 3.96 | 3.45 | 3.75 |
BN2 | Increasing the end users satisfaction | 3.91 | 3.56 | 3.54 | 3.67 |
BN3 | Improving PQ performance | 3.65 | 3.68 | 3.54 | 3.62 |
BN4 | Reducing the end users complaints | 3.51 | 3.52 | 3.68 | 3.57 |
BN5 | Monitor & Measuring PQ disturbances | 3.48 | 3.48 | 3.82 | 3.59 |
BN6 | providing PQ diagnosis system and database | 3.73 | 3.56 | 3.67 | 3.65 |
BN7 | Reducing the huge losses of PQ cost | 3.52 | 3.48 | 3.69 | 3.56 |
BN8 | Increasing the top management awareness | 3.76 | 3.88 | 3.82 | 3.82 |
BN9 | Increasing the employee skills and awareness | 4.25 | 3.31 | 3.75 | 3.77 |
BN10 | Increasing PQ training courses | 3.43 | 3.68 | 3.73 | 3.61 |
BN11 | Providing strategic planning | 3.48 | 3.66 | 3.61 | 3.58 |
The overall outcomes of implementing the PQP presented in figure 4 and table 12, which would have a positive impact on LDNs after implementing the PQP framework can be tangible, such as increasing end users’ awareness, increasing their satisfaction, improving PQ performance, reducing end users’ complaints, monitoring and measuring PQDs, providing PQ diagnostic systems and databases, reducing the huge losses associated with PQ, increasing top management awareness, increasing employee skills and awareness, increasing PQ training courses and providing strategic planning in LDNs. As explained in sections 7 and 8, both the CSFs and barriers of PQP framework implementation are correlated and belong to each other to affect PQP implementation and how they significantly influence PQ improvement within LDNs. Therefore, from the field study conducted in this research, the positive benefits of implementing PQP are not accidental, but can be obtained simultaneously after creating trigger changes in the framework implementation requirements. These are to be carried continuously, and help in finding the outstanding
barriers, and defining each difficulty separately, whether it belongs to technical or non-technical issues [34].
In addition, the relative importance index (RII) and rank of PQP benefits is identified, in that which one of the 11 PQP benefits is most important for three LDNs after implementing the three phases of PQP respectively. Table 13 presented the relative importance index (RII) and ranks of PQP benefit results.
IJSER © 2013 http://www.ijser.org
International Journal of Scientific & Engineering Research, Volume 4, Issue 4, April‐2013 1611
ISSN 2229‐5518
TABLE 13
THE RELATIVE IMPORTANCE INDEX (RII) AND RANK OF PQP BENEFITS
As indicated in table 13, providing a PQ diagnosis system and database has been ranked the first benefit by west network respondents RII = 0.742 and by east network respondents RII = 0.723. However, this factor has been ranked as second by south distribution network respondents RII =
0.742. According to the three distribution network
respondents, the overall rank for this factor RII = 0.735, which
indicated agreement on how it is very significant for LDNs to
prepare and build a PQ database and diagnostic systems. This
is due to lack of measurement and monitoring archives to
compare past measurements with current ones, in order to
identify the problems roots and the factors beyond them.
Moreover, the three distribution network respondents have
ranked increasing PQ training courses as the second important
factor among all PQP benefits with relative index (RII) = 0.706.
However, this factor was ranked third by each network, but
the overall ranking was the second. This is mainly because if
LDNs staff have enough training courses, then PQP
from table 13, the relative
increasing the employee
skills and awareness.
These factors may have a direct change on LDNs staff and end user after implementin g PQP. It can be seen
implementation can performed and conducted to monitor
PQDs with accurate outcome.
Increasing the employee skills and awareness has been
ranked the third important factor of PQP benefit RII =0.705. It
has been ranked by west network respondents RII = 0.689, by
east network respondents RII = 0.681 and by south network
respondents RII = 0.745. PQDs were not solved due lack of
staff awareness, which affect PQP implementation and rise the
end user complaint’s. Therefore, increasing the employee
skills and awareness considered one of the most important
benefits that LDNs will gain after implementing the PQP
framework successfully. The three first factors can be
considered as the most important benefits for three
distribution networks, which are: providing PQ diagnosis
system and database, increasing PQ training courses and
importance index (RII) and rank of PQP benefits show the top important factors from 1 to 11, which are categorised based on the three LDNs respondents, as they decided, which benefit is most important for each distribution network, after implementing PQP successfully.
12 CONCLUSION
A power quality survey was conducted in LDNs west, east and south, networks as example one of distribution utilities in less developed countries. The survey provided various conclusions about occurrence of PQ issues, their sources and equipment affected LDNs. The results showed that most power quality issues were due to lack of PQ awareness and
IJSER © 2013 http://www.ijser.org
International Journal of Scientific & Engineering Research, Volume 4, Issue 4, April‐2013 1612
ISSN 2229‐5518
knowledge on part of Libyan distribution staff and customers. The rapid economic growth was a very significant factor causing huge PQDs in LDNs after 1999. Statistical data also show that in the last two decades, LDNs have not implemented PQP. This due to the absence of a PQ department resulted by lack of awareness on the part of top management regarding the importance of power quality. As a result, lack of power quality awareness has led LDNs to face twelve significant difficulties through not implementing PQP.
A new model of PQP framework is developed and proposed to guideline LDNs improves PQDs.. WDN1 faces three factors; F1, lack of PQP awareness, F2, lack of PQP top management attention, and F4, lack of PQP involvement, whereas EDN3 faces F1, lack of PQP awareness, F2, lack of PQP top management attention, F3, lack of PQP resources and F4, lack of PQP involvement and SDN2 faces F3, lack of PQP resources. As a result, it can be said that LDNs have so far struggled to implement PQP effectively. These four factors appeared in USA, European, India, Malaysia, Latin America, Brazil, Germany, Pakistan, Austria, France, Italy, Poland, Portugal, Slovenia, Spain and UK. For that reason, LDN must implement PQP based on increasing the level of awareness as the economic level is increased due to competitiveness of rapid developed projects. Thus, without adequate knowledge, awareness, planning, designing, preparation, training, PQ standards, clear strategy, and most important the support of
top management for this programme, PQDs will never end and their severity will affect all end users. Finally, the regression was sufficiently representative to conclude that the relationship between the model and the depended variables of PQP is very strong and not accident. The developed PQP framework significantly contributed as following:
The implementation of PQP will enable LDNs to step forward, to tackle any PQ problems by setting up a clear and long term strategy, with the most crucial objectives, by involving all the departments and staff, who have direct relation and are responsible for improving PQDs.
If the proposed framework is adopted and adapted to suit the General Electricity Company of Libya (GECOL) circumstances of PQ problems, it will help them to make a smooth transformation from poor PQ in the network to efficiency and effectiveness that satisfy their customers.
This study indicates that PQP framework implementation will grow rapidly and will become one of the key approaches for most distribution companies in solving PQDs. Nonetheless, it will take more time for some utilities in under-developed countries, such as GECOL, to employ it and gain the significant and expected improvements.
REFERENCES
[1] J. V. Milanovic and M. Negnevitsky, "Power quality problems and solutions: Current understanding," in Harmonics and Quality of Power, 1998. Proceedings. 8th International Conference on, 1998, pp.
30-35 vol.1.
[2] H. M. S. C. Herath. Power quality data management and reporting methodologies. [University of Wollongong]. 2008.
[3] M. R. Wadi, M. F. Bara, O. Carlson and K. M. Elarroudi, "Voltage stability analysis for the south-west libyan electrical power system: Problem simulation and analysis," in Universities Power Engineering Conference (UPEC), 2009 Proceedings of the 44th International, 2009, pp. 1-5.
[4] G. Nicholson, "Investigation of Data Reporting Techniques and analysis of Continuous Power Quality Data in the Vector Distribution Networks," 2006.
[5] M. A. Mousa, I. M. Saleh Ibrahim and I. M. Molokhia, "Comparative study in supplying electrical energy to small remote loads in Libya," Renewable Energy, vol. 14, pp. 135-140, 8, 1998.
[6] S. S. Sultan, M. K. Darwish, "Power quality evaluation in libyan electrical distribution networks," in International Conference on Renewable Energies and VEhicular Technology, Hammamet, Tunisia, 2012, pp. 217-223.
[7] A. Lima, C. Barreiero, M. DeMarco, J. Martins, R. Roncolatto, and N.
Santos, "Cost of Power Quality Problems in Large Industrial Customers," Proceedings of PQA ‘93/PECON IV Conference and Exhibition, Power Quality: Issues and Opportunities, Power Electronics: Solutions and Responses, vol. 1, 1993.
[8] EPRI, "The Customer Cost of Voltage Sags and Interruptions," vol. 5,
1995.
[9] R. Caldon, M. Fauri, L. Fellin, "Voltage Sag Effects on Continuous Industrial Processes: Desensitizing Study for Textile Manufacture," Proceedings of the Second International Conference on Power Quality: End-use Applications and Perspectives, 1992.
[10] G. L. Kopps, J. Lamoree, A. Khan, and M. Samotyj, "Impact of Voltage Sags in Plastics Manufacturing," Proceedings of PQA ‘93/PECON IV Conference and Exhibition, Power Quality: Issues and Opportunities, Power Electronics: Solutions and Responses, vol. 1, 1993.
[11] J. L. McClaine, "Cost of Momentary Interruptions and Voltage Sags," IEEE PES Summer Meeting, 1995.
[12] J.P. Wagner, "The Cost of Power Quality in the ITE Industry," Proceedings of the Second International Conference on Power Quality: End-use Applications and Perspectives, 1992.
[13] H. Morosini, C. Burns, C.A. Warren, T. Dack, J. Burke, T. Short, "Cost of momentary interruptions and voltage sags to an industrial customer," IEEE Summer Power Meeting, 1995.
[14] C. R. Cleavelin, "Power Quality: A Semiconductor Manufacturer’s Perspective," Presented at PQ for the Semiconductor Fabrication Industry, vol. 2, 1997.
[15] C.D. Potts, "Cost of Power Quality," Proceedings of PQA ’91, the First International Conference on Power Quality: End-use Applications and Perspectives, 1992.
[16] V. Wagner, T. Grebe, R. Kretschmann, L. Morgan, A. Price, "Power System Compatibility with Industrial Process Equipment," A Panel Discussion,” Conference Record of the 1994 IEEE Industry Applications Society, 29th Annual Meeting, vol. 3, 1994.
[17] D.O. Koval, "Impact of power supply disturbances on industrial and
commercial electrical equipment, proceedings of the 4th alberta
IJSER © 2013 http://www.ijser.org
International Journal of Scientific & Engineering Research, Volume 4, Issue 4, April‐2013 1613
ISSN 2229‐5518
exposition and conference on power quality," 1992.
[18] J. M. R. Targosz, "PAN european LPQI power quality survey," in 19th International Conference on Electricity Distribution (CIRED 2007) , Vienna, May 2007, .
[19] B. H. S. McNulty. Power quality problems and renewable energy
solutions, analysis of the prospects for renewable PQ solutions in massachusetts. Massachusetts Renewable Energy Trust. USA. 2002.
[20] D. Lineweber, S. R. McNulty, "The cost of power disturbances to
industrial & digital economy companies," EPRI IntelliGrid Initiative
(A Primen report from EPRI & CEIDS, USA, Tech. Rep. 1006274,
2001.
[21] R. Langley, A. Mansoor, E. R. Collins Jr. and R. L. Morgan, "Voltage sag ride-through testing of adjustable speed drives using a controllable dynamic dynamometer," in Harmonics and Quality of Power, 1998. Proceedings. 8th International Conference on, 1998, pp.
566-571 vol.1.
[22] G. R. Ronghua, H. C. Suan, "A customer - oriented approach in managing power quality in Singapore," International Power Quality Conference IPQC 2002, vol. 2, pp. 188- 192, 2002.
[23] F. Carlsson, B. Widell and C. Sadarangani, "Ride-through
investigations for a hot rolling mill process," in Power System Technology, 2000. Proceedings. PowerCon 2000. International Conference on, 2000, pp. 1605-1608 vol.3.
[24] S. M. D. Lineweber, "The cost of power disturbances to industrial & digital economy companies," EPRI’s Consortium for Electric Infrastructure for a Digital Society (CEIDS), USA, Tech. Rep. 108829,
2001.
[25] H. De. Keulenaer, "The Hidden Cost of poor Power Quality," pp.
Leonardo Energy, European Copper Institute, October 2003.
[26] C. C. Pearson, V. Uthayanan, "THE BSRIA POWER QUALITY GUIDE," vol. Application Guide AG 2, pp. 1-3, 2000.
[27] R. G. Coney, T. D. J. Hennessy and R. G. Koch, "A national approach
to power quality and the minimization of negative impacts on an economy," in Electricity Distribution. Part 1: Contributions. CIRED.
14th International Conference and Exhibition on (IEE Conf. Publ. no.
438), 1997, pp. 32/1-32/5 vol.2.
[28] B. Silvestri, " Towards voltage quality regulation in europe " ERGEG, An ERGEG Public Consultation Paper, Italy, Tech. Rep. E06-EQS-09-
03, 2006.
[29] B. E. Kushare, A. A. Ghatol, "Power quality characteristics of industrial electric distribution systems," Institute of Engineering Education & Research, Nashik, India, 2008.
[30] Ph. Ferracci, "Power quality," Cahier Technique Schneider Electric, UK, Tech. Rep. 199, 2001.
[31] G. D. N. Aniruddh. Technical report on power quality management.
Electrical and Electronics ENGG. INDIA. 2003.
[32] J.Meyer, P. Schegner, G. Winkler, M. Muhlwitz and L. Schulze, "Efficient method for power quality surveying in distribution networks," in Electricity Distribution, 2005. CIRED 2005. 18th International Conference and Exhibition on, 2005, pp. 1-4.
[33] C. M. D. Dorr. Power quality for satisfied commercial and residential customers field test plan: Monitoring residential power quality. EPRI. USA. 2000.
[34] A. Barnard, A. Van Voorhis. Investigation utility-based power quality programs: Domestic and international perspectives. EPRI. USA. 2000.
[35] J. G. D. L.A. Schienbein. Distributed energy resources, power quality
and reliability –Background. PACIFIC NORTHWEST NATIONAL
LABORATORY. USA. 2002.
[36] M. A. Hannan, A. Hussain, A. Mohamed and R. A. Begum, "Methodological Framework for Industrial Flicker Severity Assessment and Awareness," Australian Journal of Basic & Applied Sciences, vol. 4, pp. 5578-5583, 11, 2010.
[37] J. M. R. Targosz, "Pan-european power quality survey," in 9th International Conference on Electrical Power Quality and Utilisation, EPQU 2007, 2007, pp. 1-6.
[38] I.N. Labricciosa. A case study of power quality enhancement in an electrical distribution system. 1996.
[39] W. T. J. Hulshorst, E. L. M. Smeets, and J. A. Wolse, "Premium power
quality contracts and labeling," Work package 2 of the Quality of Supply and Regulation project, Netherlands, Tech. Rep. 30620162- Consulting 07-0401, 2007.
[40] U. K. Deshpande, P. A. Chitre, "Total power quality management in a large distribution system: A case study national seminar on “Total power quality management”," Mumbai, India, 2009.
[41] C. Radhakrishna, "ELECTRIC POWER QUALITY: SOME TECHNICAL AND COST PERSPECTIVES " Global Energy Consulting Engineers, INDIA, Tech. Rep. 265, 2008.
[42] S. A. Qureshi, F. Mahmood, Z. J. Paracha, S. A. Kashif, "POWER QUALITY DISTURBANCES IN POWER SYSTEMS AND COMPARISON OF DEVELOPED COUNTRIES STANDARDS," Electrical Engineering Department, UET Lahore, Pakistan, vol. 4,
2007.
[43] W. Moncrief, J. Dougherty, L. Richardson, K. Craven, "Power quality applications guide for architects and engineers," EPRICSG, Palo Alto, CA, USA, Tech. Rep. 113874, 1999.
[44] B. C. A. Abreu, "Power quality site survey process for regulated
electricity market," in Transmission & Distribution Conference and
Exposition: Latin America, 2006. TDC '06. IEEE/PES, 2006, pp. 1-6. [45] R. J. R. Gomes, D. O. C. Brasil and J. R. de Medeiros, "Power quality
management issues over the brazilian transmission system," in Harmonics and Quality of Power, 2002. 10th International Conference on, 2002, pp. 27-32 vol.1.
[46] GPCIET. Existing and potential trade between libyan arab jamahiriya and world. 2010(07/30), 2007.
[47] General Electrical Company of Libya. Annual report. GECOL. Tripoli,
Libya. 2007.
[48] M.H.J. Bollen, Understanding Power Quality Problems "Voltage Sags
& Interruption". USA: John Wiley & Sons Inc, 2000.
[49] D. Kottick. Electrical power quality & utilization magazine, power quality monitoring System—Voltage dips, short interruptions and flicker. 3(2), pp. 2. 2008.
[50] General Electrical Company of Libya. Annual report. GECOL. Tripoli, Libya. 2008.
[51] V. Thiessen, Arguing with Numbers: Statistics for the Social Sciences.
Halifax: Fernwood. Publishing, 1993.
[52] S. S. Sultan, M. K. Darwish, "Barriers and benefits of implementing a power quality programme: Case Study Libyan distribution networks," ISSN 2229-5518, vol. 3, April, 2012.
[53] S. S. Sultan, M. K. Darwish, "Critical Factors Facing Implementation of Power Quality Programme Framework: Case Study-Libyan Electrical Distribution Networks," ISSN 2229-5518, vol. 3, April, 2012.
[54] S. S. Sultan and M. K. Darwish, "Power quality evaluation in libyan electrical distribution networks," in Renewable Energies and
Vehicular Technology (REVET), 2012 First International Conference
IJSER © 2013 http://www.ijser.org
International Journal of Scientific & Engineering Research, Volume 4, Issue 4, April‐2013 1614
ISSN 2229‐5518
on, 2012, pp. 372-378.
[55] G. D. Holt, "Construction Research Questionnaires and Attitude
Measurement: Relative Index or Mean? " vol. 3, pp. pp. 88-96, 1997. [56] W.M. Grady, A.H. Noyola, D. Dorr, P. Nelsen. Results of power
quality surveys in the united states: End user and utility
perspectives. Presented at Power Quality Business Analyzer Survey
Progress Report on PQ Costs. 2000, [EPRI].
[57] B. A. Hamilton, "Strategic plan corporate objectives; business, functional unit plans, financial model and lessons learned," GECOL, Tripoli, Libya, 2006.
[58] J. Pallant, Ed., SPSS Survival Manual: A Step by Step Guide to Data
Analysis using SPSS for Windows (Version 12). Maidenhead, Berkshire. U. K: New York, NY: Open University Press, 2005.
IJSER © 2013 http://www.ijser.org