International Journal of Scientific & Engineering Research Volume 2, Issue 10, Oct-2011 1
ISSN 2229-5518
Combating Problems with Solar Power: A cost Effective Improvement on the Conversion Efficiency of Solar Panels
Engr. C.O. Osueke (Ph.D), Engr. E.M. Onyekachi, Engr. I.O. Nwabueze
Absract - There is no point harnessing an energy resource that has no economic value. Solar energy poses a strong threat to other forms of energy due to its purity and availability. The problem associated with harnessing solar power mainly comes from the cost and efficiency of the photovoltaic (P-V) panels. This work proffers a solution to this problem by combining the effect of colours and lenses based on the principle of white light spectrum and its behavior with lenses. A 0.9m by 0.3m mono-crystalline solar panel with a manufacturer specification of 18% efficiency, 50W maximum output power, 18V maximum voltage output & 2.77A maximum current output was used for experiments in combination with a sheet of convex lens, glass panes dyed with various colours of the light spectrum, a battery operated portable multi- meter, a meter rule, and a mount frame. Experiments were conducted for different time schedules for three days of assumed equal intensity. The results of the experiments are presented in stages and it was discovered that at stage 3, the system which is a combination of solar panel, violet colour filter and convex lens yielded a productivity of over 96% with power output of 47.67W.A. This is almost a total extortion of white light energy as provided by the solar panel.
Index Terms – Colour filter, Combat, Convex lens, Efficiency, Problem, Solar panel, Solar power.
—————————— ——————————
1 INTRODUCTION
olar power is actually one of the cleanest methods of energy production the world has ever known. Infact, most
of the energy known to man is derived in some way from the sun. When we burn wood or other fuels, we are releasing the stored energy of the sun. Infact, there would be no life on earth without the sun which provides energy needed for the growth of plants and indirectly, the existence of all animal life [24]. The form that is of major interest to researchers and the world at large is the direct conversion of the sun rays into a usable energy source (electricity). Every second, 3.38 * 1026 J of nuclear energy is released by the sun's core [23]. This makes the solar energy from the sun a truly enormous one. on the average, the Earth's surface receives about 1.2 * 1017 W of solar power. This means that in less than one hour, enough energy is supplied to the earth to satisfy the entire energy demand of the human population over the whole year [16]. This led to numerous researches and discoveries in a bid to harness this energy. In 1839, a nineteen year old by the name Alexander Edmond Becquerel discovered the photovoltaic effect [22]. This effect is the physical process through which a solar cell converts sunlight into electricity. The basis for the modern solar cell, however, can more directly be traced back to William Grylls Adams [22]. Back in 1876, Mr. Adams
————————————————
1. Engr. C. O. Osueke (Ph.D), Department of Mechanical Engineering, Enugu State University of Science and Technology, Enugu, Nigeria. krisosueke@yahoo.com
2. Engr. E.M. Onyekachi, Department of Mechanical Engineering, Enugu
State University of Science and Technology, Enugu, Nigeria.
3. Engr. I.O.Nwabueze, Department of Mechanical Engineering, Enugu State
University of Science and Technology, Enugu, Nigeria.
discovered that selenium generated an electric current when exposed to light [22]. For the next 50 – 60 yrs, the developments were not so bold, but even Albert Einstein was working on using solar power, he was even granted a Nobel prize in 1921 for his work on the photoelectric effect.
While the years of solar power went by quietly, in the
1950's the development of solar power was benefitted by the
production of the Czochralski meter. This was a process that
produced pure crystalline silicon and by 1954, Bell telephone
laboratories had developed a silicon photovoltaic cell that had a four percent (4%) efficiency that was later boosted to 11% efficiency [8]. Since then, the evolution of solar technologies and photovoltaics have been gaining increasing market share for the last 20 yrs. Even though the development of photovoltaic system has been increasing steadily for the last 20 years, solar technologies still suffer from some draw-backs that make them poorly competitive on an energy market dominated by fossil fuels. Nevertheless global generation of solar electricity is still small compared to the potential of this resource [4]. Current electricity generation from PV's is only of the order of 2.6 GW compared to 36.3GW for all renewable energies, excluding hydroelectric power [6,5].
This low consumption of solar power led to the force
behind this work. It was found out that the major setback was
as a result of the cost and efficiency of the conversion medium
(solar panel). The objective of this work then becomes to combat these constraints using simple technologies to achieve the aim of developing affordable and highly efficient conversion medium.
2 LITERATURE REVIEW
IJSER © 2011 http://www.ijser.org
International Journal of Scientific & Engineering Research Volume 2, Issue 10, Oct-2011 2
ISSN 2229-5518
Before procession, a further brief look into the achievements of few past researchers needs to be done in order to understand the magnitude of the task ahead. Solar energy collection efficiency has improved, growing from the first passive collection methods (efficiency approx 1%) to the current applicable methods (efficiency approx 15-20%) [11]. This issue has been examined from several angles, both from that of maximum possible efficiency, and from that of highest possible efficiency while remaining industrially feasible.
Kribus study [11] delivered an examination of a new process with efficiencies approaching 70%, although it would be difficult and extremely expensive, probably too much so to be economically feasible. Normal panels use a double cycle conversion process. Kribus [11] introduces a triple cycle, the first of which operates at extremely high temperatures, it is called a magneto-hydro-dynamic (MHD) cycle, and can operate at temperatures in the range of 2000° - 2500°, up from the current limit of about 1300°.
Dauwe et al., [2] study presented a panel with increased
efficiency, possibly approaching 30%, that is still feasible for mass production. His design uses a different kind of silicon, called Czochralski silicon, with oblique evaporated contacts (OECO). The contact points are metalized using low-cost aluminum and obliquely evaporated using a very simple four- step process that may prove to be feasible for mass production.
Crystalline silicon technologies have potential for further
increment improvement in performance and cost reduction.
The most successful c-Si cell designs of the last 15 years with
efficiencies above 20% are the photo-lithographically based
passivated emitter solar cell (PESC) [13], the back point- contact (BCP) cell (22.3% efficiency [19]), and the passivated emitter, rear locally – diffused (PERL – 24.7% [10]). Future developments in c-Si cells are likely to be decreased wafer thickness and improved light – trapping scheme. Enhanced buried contact designs [12], and Heterojunctions with intrinsic thin – layer (HIT) [15], are two of the newer commercial designs. Ribbon technologies such as edge defined film – fed growth (EFG), dendritic web, and string ribbon have the potential to produce thin cells at lower cost [3,18]. Deposition of Si on foreign substates is a possible route for obtaining Low
– cost cells with acceptable performances. Poly crystalline
silicon on SiC graphite coated substrates [7], and glass
substrates [17] are examples of technologies under
investigation with the latter now in production.
These improvements being made to the technology are
more or less worthless if the panels eventually becomes non –
affordable by the common man.
3 PROMBLEMS WITH SOLAR POWER
Although solar power an inexhaustible fuel source, constitutes no pollution and is versatile, there are still challenges in harnessing this energy. The discovered major problems facing the exploration of this energy can be classified into three, namely:
IJSER © 2011 http://www.ijser.org
a) Cost of Photo-Voltaic (PV) panels b) Efficiency of panels
c) Insonation value of the area
3.1 Cost of Pv Panels
The current direct cost of solar PV power is widely acknowledged to be much greater than fossil fuel generation or many other renewable energy sources, although it is cheaper if considered on a long term run. The cost of these PV panels is accounted for by the materials and manufacturing techniques. Solar panels require carefully doped semiconductors to function, and these are a myriad of possible doping agents with different properties, and a lot of different production techniques possible. It takes time to work out which doping agent is best, and to find less expensive manufacturing process for producing the photovoltaic cells.
3.2 Efficiency of Panels

The efficiency of a PV panel depends on the type of solar panel used. Over the past 36 years, solar cell efficiencies have continuously improved for all technologies: figure I
Figure 1 Progress in PV technology & efficiencies [21] Among the most important accomplishment to be noted are
the 24.7% efficient c-Si solar cell (University of south wales, Australia), the 18.4% efficient CIGS solar cell (NREL), the
16.5% efficient CdTe solar cell (NREL), and the 39% efficient GaIP/GaAs/Ge triple-junction solar cell under 241-suns concentration (Spectrolab) [20]. Research on dye sensitized
solar cells (DSSCs) and organic solar cells (OSCs) began only during the last decade. The last reported record efficiencies are
10.4% for DSSCs (Ecoloe Polytechnique Federale de Lausanne,
Switzerland) [14], and 5.7% for OSCs (Princeton University)
[9].
According to literature, in mass production, only about
30% efficiency has been achieved for PV technology. This is
not quite reasonable when compared to the cost of procuring them.
3.3 Insonation Value of The Area
Insonation, or sunlight intensity is measured in equivalent full sun hours. One hour of maximum or 100% sunshine received by a solar panel equals one equivalent full sun hour. Even though the sun may be above the horizon for 14 hours a day,
International Journal of Scientific & Engineering Research Volume 2, Issue 10, Oct-2011 3
ISSN 2229-5518
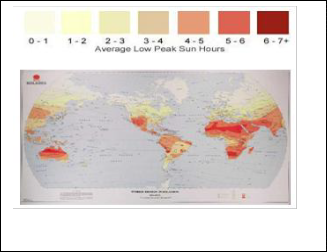
this may only result in six hours equivalent full sun. (Insonation value = 6). This is as a result of the position of the sun above the earth. The position of the sun reflects how much of the earth's atmosphere the light rays need to pass through. Early or late in the day, the sunlight is passing through much more of the atmosphere than in the middle of the day. This insonation value varies for various locations all around the earth. An overview of the world insonation data is shown below: figure 2
Figure 2 Overview of worldwide insonation map [16] Regions with higher latitudes tend to experience less sunshine
and vice versa.
4 THE IMPROVED CONVERSION PROCESS
With energy crises of the world today, solar power become the only savior and redeemer. The problem associated with this solar power leaves no other option order than improving on the conversion
The improved conversion process proffered by this work in-cooperates the technical application of principles of physics and light. Convex lens and colour filters was used to improve the quantity & quality (Energy level/colour) of light falling on the photovoltaic cells. The three make ups of this improved system have unique roles to play in order to achieve optimal conversion.
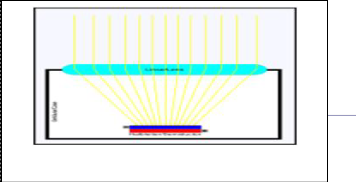
4.1 Role of Convex Lens
The convex lens (converging lens) based on the principle of physics converges rays of light falling on it at a point say “F” which is at a distance (Focal length) from a point say “O” on the radius of curvature of the lens.
By technical deduction, when a convex lens with a more surface area than that of the proposed solar array is placed at some distance over the solar panel, it converges light ray which would have fallen off the panel into the panel array thereby improving its efficiency.
4.2 Role of Colour Filter
The use of colour filter emanates from the theory of white light having 7 colours in its spectrum. These colours have different wavelengths and energy attached to it: table 1.
The principle of colour filtration has it that a material with
a particular colour tends to absorb all the colours of the
spectrum and emit its own colour. The violet and blue colour
has the shortest wavelength and highest energy level which
brings about using violet and blue glasses in sealing the solar
panel.
By so doing, only light with high energy level falls on the p- v cell which eventually enhances conversion.
TABLE 1
Different Spectrums of White Light and Associated
Wavelengths.
5 WORKING PRINCIPLE OF THE SOLAR PANEL
To better understand the concept of improving the conversion efficiency, it was necessary to have an idea of solar energy collection and its conversion into electricity. A solar panel is made up of tens of thousands of photovoltaic cells which has silicon semiconductor as its major constituent. The glass covering of the solar panel helps to protect the solar panel from environmental and biological effects like rain and other objects that may damage the panel. Light rays contain photons which are energy in discrete packets. When these light rays fall on the solar panel, it passes through the glass covering and impinges on the photovoltaic cells. A
2011 ijser.org
Fig 3 Effect of convex lens on light rays. [16]
International Journal of Scientific & Engineering Research Volume 2, Issue 10, Oct-2011 4
ISSN 2229-5518
photovoltaic cell is made up of silicon which has four valence electrons treated to increase its conductivity by doping it with impurities like phosphorus on one side which has five valence electrons which can be readily donated to silicon. On the other hand, the silicon is doped with atoms of boron with three valence electrons (P-donor) to create a greater affinity than silicon to attract electrons.
When these photons of light fall on the p-v cell, they
transfer their energy to the charge carriers (electrons). Because
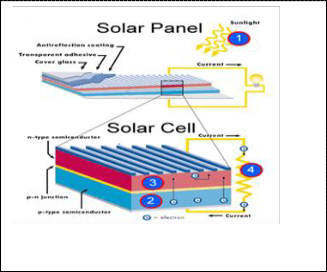
the P-type silicon is in intimate contact with the n-type silicon, a p-n junction is established and a diffusion of electrons occurs from the region of high electron concentration (the n-type silicon) into the region of low electron concentration (p-type side). When the electrons diffuse across the p-n junction, they recombine with holes on the other side. However, the diffusion of carriers does not occur indefinitely, because the imbalance of charge immediately on the other sides of the junction originates an electric field. This electric field separates photo – generated positive charge carriers (holes) from their negative counterpart (electrons) thereby forming a diode that promotes current to flow in only one direction. Ohmic metal semiconductor contacts are made to both the n-type and p- type sides of the solar cell. In this way an electric current is extracted. A combination of the electric currents produced by the individual p-v cells of the solar panel is channeled through the cords found protruding from the panel which is then connected to the rest of the components for storage and conversion (from DC to AC).
conversion efficiency as explained above, experiments were carried out.
Before the experiment is carried out, a relationship between the surface area of convex lens and solar array needs to be established.
Let the surface area of solar array be ASA
The surface area of convex lens be Acl &
The focal length of the convex lens be f
The lens need to be suspended at a distance (d) above the
solar array such that the converging beam of light spread
evenly over the surface area of solar array ASA and not
impinging on a particular spot.
Since these surface areas take a rectangular shape from an aerial view, the shape assumed to be rectangular.
This implies that
ASA = LSA ∗ WSA (1) Where LSA = length of solar array
& WSA = width of solar array
Also, Acl = Lcl ∗ Wcl (2)
Where Lcl = length of convex lens
& Wcl = width of convex lens
The shape formed by the convex lens, solar panel and focal
point f takes a triangular shape as shown in figure V.
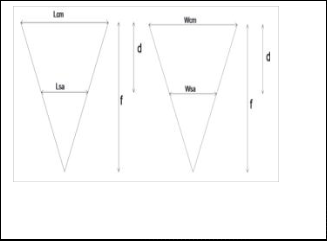
Figure 4 Working principle of a solar panel. [16]
From this explanation, it can be seen that the more intense and energetic the light falling on the panel, the more the tendency for more electron flow and hence electricity production.
6 EXPERIMENT SETUP
To establish the fact that in-cooperating the various technologies as mentioned above really improves the
Figure 5 Shape formed by convex lens, solar panel and
focal point f.
Using the law of similar triangles to obtain a relationship
between LSA , WSA and Lcl , Wcl:
IJSER © 2011 http://www.ijser.org
International Journal of Scientific & Engineering Research Volume 2, Issue 10, Oct-2011 5
ISSN 2229-5518
d LSA
WSA
A mount made of steel with planes inclined at an angle of 30°


f = Lei = Wei (3)
To achieve maximum concentration and at the same time
and avoiding over heating of the solar panel, the panel needs
to be placed at a distance of x the (yet to be discovered) focal
length of lens.
This implies that d = xf (4)
Substituting equation 4 into equation 1 becomes
to the horizontal facing west. This angle is dynamic and depends on the geographic location of the site of experiment.
The multimeter is used to take voltage reading from the solar panel terminal, while the meter rule is used to measure the distance between the solar panel and lens.
Four experiments were performed during this research:
1. The solar panel output reading were taken at
x f
LSA
WSA
different times of the day


f = Lei = Wei (5)
Onward further simplification LSA = xLcl (6)
& WSA = xWcl (7)
Note: the analysis for the width and length should be done
separately so that the length/width of the lens corresponds
with the length/width of solar array. By doing so, leakages or unnecessary loss of incident beam is avoided.
6.1 Materials Needed For The Experiment And
Experimental Setup
The materials needed to perform this experiment are stated as follows:
1. Solar Panel:
A mono-crystalline solar panel was used. Its maximum rating was found to be: 50watts; 18V; 2.77A. its size was also found to be 0.9m by 0.3m. The efficiency of mono-crystalline panels is known to be 18%.
2. Colour filter (dyed glass panes):
Glass panes dyed with one colour out of the seven visible
clours of light spectrum: violet, blue, green, yellow, orange, red.
3. A sheet of convex lens of approx 2.25m by 0.75m with a focal length of 0.98m. The length of the sides corresponds with the principle as shown in equation
6 &7
2. The various colour filters were placed on the panel while their individual output readings were taken at different times of the day.
3. The convex lens was placed at various distances from the solar panel to determine the position of maximum output.
4. The convex lens was then mounted above the panel at a specified distance from the panel and the readings were taken at different times of the day as well.
The experiment was carried out from 9:00am GMT to 3:00pm
GMT for three consecutive days.
6.2 Experimental Results And Discussion
If the maximum output of the solar panel as started above:
18V; 2.77A were considered 18% efficiency. This implies that
at this rating, the panel is 100% productive.
From Ohms law, Power output P is a product of voltage and current output (IV)
Efficiency of conversion (Eff) is given by;

Maximum ef iciency of solar panel
Effc = P
Maximum power output of solar panel

18
= 49.86 P = 0.361P (7)
4. A battery operated portable multimeter:

100
Productivity Pr is given by Effc
= 5.56Effc
(8)
A mains operated one is fine indoor, but a battery operated portable meter is easier if the experiment is taken outdoor.
5. A meter rule:
This is used to measure the distance between the converging lens and solar panel.
6. A Mount (frame)
18
The productivity figure goes a long way to tell if the solar
panel’s efficiency (ability) is optimally harnessed for use.
Based on the experiments performed, the results & discussion are presented in stages.
6.2.1 Stage I
Various time points were chosen for the first stage of the experiment as shown in the table II below.
IJSER © 2011 http://www.ijser.org
International Journal of Scientific & Engineering Research Volume 2, Issue 10, Oct-2011 6
ISSN 2229-5518
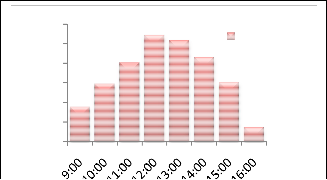
From the data given in the table above, a histogram of power output and productivity is plotted against time of experiment in GMT.
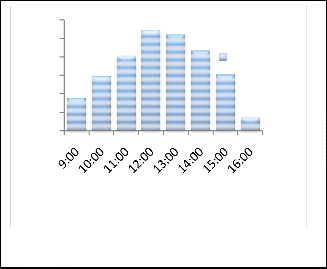
As explained above in figure VI, the productivity is directly proportional to the power output of the panel. The
30
25
20
15
10
5
0
Time (GMT)
Power output
TABLE 3A
Effect of Violet Colour Filter on Solar Panel Output
Figure 6 Comparison of power output at different time schedules (Stage 1)
A study of the graph above shows that the power output of the solar panel increases from 8:45 to 11:45 GMT and then subsequently drops till 2:45 GMT. This is because the insonation (Sun Intensity) keeps rising till 11:45 GMT when maximum insonation is experienced. This power then starts droping because beyond 11:45 GMT, the intensity starts start fading away. A drastic reduction in power is found to occur between 12:45 GMT and 13:45 GMT. This is because the solar intensity drops drastically as well. This is noticed by a sudden darkness filling up the atmosphere. It can be explained by movements of solar and planetary bodies.
The relationship between time of experiment & productivity of solar panel is also shown below.
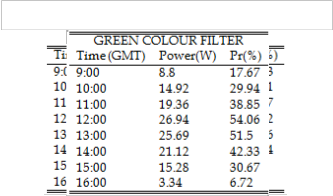
TABLE 3B
Effect of Green Colour Filter on Solar Panel Output
TABLE 3C
Effect of Red Colour Filter on Solar Panel Output
60
50 Productivity
40
30
20
10
0
R © 2011 ww.ijser.org
Time (GMT)
International Journal of Scientific & Engineering Research Volume 2, Issue 10, Oct-2011 7
ISSN 2229-5518
productivity of the panel is found to be maximum at 11:45
GMT with a value of about 54.72%
6.2.2 Stage II
Ordinarily, these direct output data becomes part of the data used for modeling the solar system which will eventually result to an increase in the number of solar modules as against the option being proposed by this work. A further improvement on this output data is accomplished by the use of colour filters.
At various time schedules of the next day, the different colour filters were placed on the solar panels and the reading were taken. Three colours were selected for this experiment. These are the violet, green and red colour . The result gotten can then be interpolated to account for the effect of other colours.
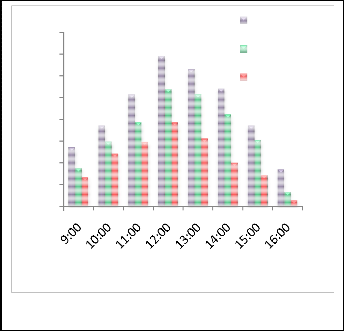
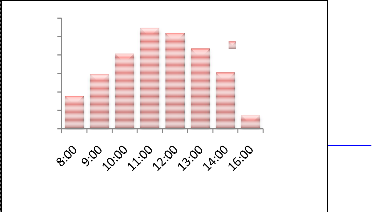
In order to compare the output of the solar panel when in use with the different colour filters, the relationship between the time of experiment and output is presented using a chart as shown below: figure 8
1. The closer the panel is to the lens, the less its efficiency. This is because at temperatures above 50 , the conductivity of the semiconductor increases. This balances out the charge within the material, reducing the magnitude of the electric field at the junction. This in turn inhibits charge separation which lowers the voltage across the cell.
2. If the panel is placed at a position which corresponds to the focal length of the lens, the converged light rays will impinge on a small ratio of P-V cells, thereby over working them and eventually leads to a reduction of the life span of the panel.
This calls for a balance to be created between these two extreme condition. On the first day of the experiment, the lens was placed at different distances above the panel and output readings were taken. It was discovered that the panel had more output readings at a distance of 0.4 of the focal length of the lens. i.e.: .
Stage III
40
35
30
25
20
15
10
5
0
Time (GMT)
Violet colour
filter
Green colour
filter
Red colour
filter
With use of the violet colour filter, the productivity of the solar panel just lies within 69%. This implies that the full capacity of the panel is yet to be experienced. The convex lens is then used to boost this output by combining its effect and that of
The convex lens is placed at a distance of from the solar output readings at different time schedules.
TABLE 4
Output Readings at Stage Three
Figure 8 Comparison of power output of various colour filters
From the bar chart presented above, the violet colour filter generated the greatest output at every time schedule. At 12:00
GMT, it generated the highest output of 34.53W followed by that of the green and red colour filter at 26.94W and 19.33W respectively. These results further validates the theory of light spectrum giving preference to the colour filter as the required colour filter to be used in boosting P-V panel output.
To determine the effect of this convergence on the solar panel, the relationship between time schedule & productivity is presented in chart analysis as shown below: figure 9
6.3.3 Distance Consideration 30
The distance of the lens from the panel also plays an 25
important role in the conversion efficiency of the panels. 20
15
IJSER © 2011 http://www.ijser.org
5
0
Productivity
International Journal of Scientific & Engineering Research Volume 2, Issue 10, Oct-2011 8
ISSN 2229-5518
TABLE 5A
Comparison of the output reading (stage I)
TABLE 5B
Comparison of the output reading (stage II)
TABLE 5C
Comparison of the output reading (stage III)
From the chart above, it is observed that a high productivity of
95.61% was realized at a time schedule of 12GMT. This is far
better than that experienced in stage 1 and II at 54.72% &
69.5% respectively. This proves that the combination of colour
filters and convex lens produces a better yield and should be
encouraged in solar power systems.
The table below shows the summary of the experimental results from the three various stages
7 CONCLUSION
Most often, the problem associated with solar power is the ability of one to maximize the capacity of the panel and not necessarily having a large array of it. In most cases, the productivity of the panels are under-utilized.
This work has helped to manage this problem by introducing a system of convex lens and colour filter. With this system, more light rays are converged into the solar array, the colour of white light spectrum with higher energy level is filtered in and made to impinge on the P-V cells which then triggers the photovoltaic effect for a better electricity yield. The gradual improvement on this conversion was exposed in three stages
1. The solar panel on its own yielded an output of : power = 27.28W; efficiency = 9.85% as against 18% maximum; productivity = 54.72%, at 12GMT of day
1.
2. On augmentation with the violet colour filter, the
system yielded an output of :power = 34.65W;
efficiency = 12.52% as against 18% maximum;
productivity = 69.5%, at 12GMT of day 2.
3. Under a combined effect of the violet colour filter
and convex lens, the system yielded an output of :
power = 47.67W; efficiency = 17.27 as against 18%
maximum; productivity = 95.61% at 12GMT of day 3.
The yield at stage 3 can be accommodated and said to be optimal when compared to the capacity of the panel.
The total effect of this system goes a long way to maximize solar electricity generation, reduce the cost procuring unnecessary solar panel modules thereby successfully combating problems associated with conversion of solar power into useful electricity.
ACKNOWLEDGEMENT
My sincere gratitude goes to Prof. E. I. E. Ofodile for his immense support and guidance. Also my appreciation goes to
IJSER © 2011 http://www.ijser.org
International Journal of Scientific & Engineering Research Volume 2, Issue 10, Oct-2011 9
ISSN 2229-5518
Dr. N. Ibekwe for his assistance with research equipments and materials.
REFERENCES
[1] C. Hebling, S. Reber, K. Schmidt, R. Ludermann, F. Lutz, “Oriented recrystallization of silicon layers for silicon thin-film cells”, Proc. 26th IEEE Photovoltaic Specialists Conference, Anaheim (CA), September 1997, p. 623
[2] Daure, S., Mittelstadt, L., Metz, A. & Hezel, R. 2002, Progress in photovoltaics: Research and Application, vol 10, p.271
[3] D.O. Bergin, “Shaped crystal growth - A selected bibliography”,
Journal of Crystal Growth, 50(1), 1980, p. 381
[4] European photovoltaic industry association/green peace, “Solar generation” report. Retrieved from http://archive.greenpeace.org/climate/climatecountdown/solar generation.
[5] IEA International Statistics 2005. Retrieved from http://www.iea- pvps-org/isr/index.htm
[6] IEA, “World energy outlook, 2004” International Enrgy Agency,
Paris, IEA/OECD,
[7] J.A. Rand, Y. Bai, J.C. Checchi, J.S. Culik, D.H. Ford, C.L. Kendall,
P.E. Sims, R.B. Hall, A.M. Barnett, “Large-area silicon-fillm manufacturing under the PVMAT program”, Proc. 26th IEEE Photovoltaic Specialists Conference, Anaheim (CA), September- October 1997, p. 1169
[8] John Perlin, (1990). From space to earth: Thestory of solar electricity,
aatec publications, Ann Arbor, MI 48107
[9] J. Xue, S. Uchida, B.P. Rand, S.R. Forrest, “Asymmetric tandem
organic photovoltaic cells with hybrid planar-mixed molecular heterojunctions”, Appl. Phys. Lett., 85(23), 2004, p. 5757J. Zhao, A. Wang, P. Altermatt, M. A. Green, “Twenty-four percent efficient silicon solar cells with double layer antireflection coatings and reduced resistance loss”, Appl. Phys. Lett., 66(26), 1995, p. 3636
[10] Kribus A & Harald R (2002) Li MoNAED; a limited motion, non- shading, asymmetric, ecliptic traking dish SOLAR ENERGY, Vol.73(5), pp337-344
[11] L.M. Koschier, S.R. Wenham. M. Gross, T. Puzzer, A.B. Sproul, “Low
temperature junction and back surface field formation for
photovoltaic devices”, Proc. 2nd World Conference and Exhibition on Photovoltaic Solar Energy Conversion, Vienna, Austria, July 1998, p. 1539
[12] M.A. Green, A.W. Blakers, S.R. Wenham, S. Narayanan, M.R.
Willison, M. Taouk, T. Szpitalak, “Improvements in silicon solar cell efficiency”, Proc. 18th IEEE Photovoltaic Specialists Conf., Las Vegas (CA), 1985, p. 39
[13] M. Grätzel, “Perspectives for dye-sensitized nanocrystalline solar cells”, Prog. Photovolt. Res. Appl., 8(1), 2000, p. 171
[14] M. Tanaka, M. Taguchi, T. Takahama, T. Sawada, S. Kuroda, T.
Matsuyama, S. Tsuda, A. Takeoka, S. Nakano, H. Hanfus, Y.
Kuwano, “Development of a new heterojunction structure (ACJ-HIT)
and its application to polycrystalline silicon solar cells”, Prog. Photovolt., 1, 1993, p. 85
[15] Nwabueze, I. O., Chinweike, E., Aliogor, O., (2010). Design and construction of a solar electricity generator. Unpublished undergraduate thesis, Enugu state University of Science and Technology, Enugu, Nigeria.
[16] P.A. Basore, “Pilot production of thin-film crystalline silicon on glass
modules”, Proc. 29th IEEE Photovoltaic Specialists Conference, New
Orleans (LS), May 2002, p. 49
[17] R. Janoch, R. Wallace, J.I. Hanoka, “Commercialization of silicon sheet via the string ribbon crystal growth technique”, Proc. 26th Photovoltaic Specialists Conference, Anaheim (CA), September- October 1997, p. 95
[18] R.M. Swanson, S.K. Beckwith, R.A. Crane, W.D. Eades, Y.H. Kwark, R.A. Sinton, S.E. Swirhun, “Point-contact silicon solar cells”, IEEE Transactions on Electron Devices, ED-31, 1984, p. 661
[19] R.R. King, “Pathways to 40%-efficienct concentrator photovoltaics”,
to be published in the Proc. Of the 20th European Photovoltaic
Conference, Barcelona, Spain, June 2005
[20] S.E. Shaheen, D.S. Ginley, G.E. Jabbour, “Organic-based
photovoltaics: toward low-cost power generation”, MRS Bulletin,30,
2005,p. 10 (www.mrs.org/publications/bulletin)
[21] Tyson Champagne (2001). Solar power beginner. Retrieved June, 12,
2009, from http://www.solarpowerbiginner.com/info-on-solar.html
[22] V. Smil, ‘energies), ed. The MIT press, Cambridge (MA),
[23] Xian, Justin & John (1998). Energy matters. Retrieved August, 2010, from http://www.thinkquest.org/pls/html/thinksite?p_site_id=20331
IJSER © 2011 http://www.ijser.org