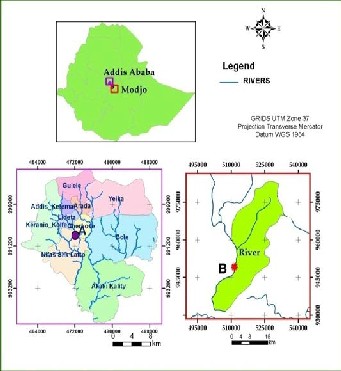
The study areas were two abattoirs out of the major abattoirs found in central Ethiopia. Those were Kera abattoir (in Addis Ababa city) and Luna abattoir (in Modjo town) their location map is as shown in Figure 2.1.
International Journal of Scientific & Engineering Research, Volume 6, Issue 4, April-2015 1026
ISSN 2229-5518
Characterization of Abattoir Wastewater and
Evaluation of the Effectiveness of the Wastewater Treatment Systems in Luna and Kera Abattoirs in Central Ethiopia
Abrha Mulu , Tenalem Ayenew
Abstract— The objectives of this study were characterization of abattoirs wastewater and evaluation of the performance of their wastewater treatment system (WWTS). Samples from untreated effluents of Kera and Luna abattoirs, and treated effluent of Luna abattoir were examined using standard procedure over the duration of two months period of dry season. It was found that extremely high turbidity, color, TS, TSS, BOD5, COD, NH3-N, NO2--N, NO3--N, S-2, SO4-2, PO4-3, TP, FC, TC and FOG. As a result except temperature and pH, the levels of all these parameters of the raw wastewater did not comply with effluent discharge limit of the country. The values of most parameters measured were significantly higher for Kera abattoir than Luna abattoir, at 0.05 significant level of post Hoc ANOVA. The Luna abattoir lagoon, overall percentage removal of the above parameters were 56.67%, 63.22%, 63.77%, 88.68%, 91.59%, 90.91%, -
743.08%, 84.33%, 97.7%, 40.76%, 89.19%, -117.43%, -11.43%, 50.41% , 36.30%, and 66.18% respectively which were also not complying with the Ethiopian EPA discharge limit. There is a need of establishment and improvement of abattoir wastewater treatment system, as well as an intervention of regulatory bodies to ensure discharging of high quality treated final effluents by the abattoir industries.
Index Terms— Abattoir wastewater, Bacteriological, Evaluation of WWTS, Lagoon, Physicochemical characteristics
—————————— ——————————
thiopia has the largest livestock population in Africa, with an estimated 47.57 million cattle, 26.12 million sheep, and
21.71 million goats [1]. Ethiopia’s increasing human popu-
lation, coupled with expanding urbanization and higher aver- age income is putting increasing pressure on the meat supply. The increasing demands on meat in the country led to expan- sion of abattoir industries in number and capacity. Among those are Kera abattoir and Luna abattoir in Addis Ababa and Modjo respectively. Despite the importance of those indus-
————————————————
• Abrha Mulu (MSc) is a lecturer of Environmental Chemistry
and Toxicology in Aksum University, Ethiopia , P.O.B: 1010 and
currently pursuing PhD degree program in Environmetal Science
in Addis Ababa University, Ethiopia, PH:-+251-913499472, P.O.B:
1176 , E-mail: chem.mulu@gmail.com or chem.mulu@yahoo.com.
• Tenalem Ayenew (PhD) is a professor of Hydrogeology, Depart-
ment of Earth Science, College of Natural Science, Addis Ababa
University, AddisAbaba, Ethiopia., E-mail:tenalema@yahoo.com.
tries, they consume large amount of water resource for wash-
ing of carcasses after hide removal from the animals; carcass washing after evisceration; equipment and facilities washing. These activities result to generate large amount of wastewater along with other by-products including blood, inedible inter- nal organs and intestines, bone, urine and feces, soft tissue removed during trimming and cutting, soil from hides and hooves, solubilized fat, and cleaning compounds.
Untreated abattoir wastewater comprises a mixture of fats, proteins and fibers, resulting in a high content of organic mat- ter and causes a contaminating effect to the rivers and sew- age systems. It also increases nitrogen, phosphorus, solids and BOD5 levels of the receiving water body, potentially leading to eutrophication [2, 3, 4, 5]. However, in the Addis Ababa city and its surrounding areas the effluents from abattoirs are di-
rectly or indirectly discharged into nearby rivers with and /or
IJSER © 2015 http://www.ijser.org
International Journal of Scientific & Engineering Research, Volume 6, Issue 4, April-2015 1027
ISSN 2229-5518
without any prior treatment. Akaki River and Modjo River are among the victims of this problem.
To prevent degradation of the receiving environment, wastewater needs to be treated. Different countries practice different wastewater treatment systems and is reported that the most common wastewater treatment methods in devel- oped countries are centralized aerobic wastewater treatment plants and lagoons for both domestic and industrial wastewater [6]. In similar way, in developing countries like Ethiopia, some abattoir industries have started to use lagoons as wastewater treatment. However, untreated effluent of Kera (in Addis Ababa) and partially treated effluents of Luna abat- toir (in Modjo) from the thousands of animals slaughtered daily throughout the year flows into Little Akaki River and Modjo River, respectively. These effluents may cause pollution over the rivers and also create other environmental stresses in the downstreams and nearby residential areas.
Wastewater management is an inherent aspect of many indus- trial operations and according to the guidelines and standards for industrial pollution control in Ethiopia, all discharges of effluent with constituents beyond the specified limits into public drains, streams, rivers or underground injection are unacceptable [7]. Therefore, it is also mandatory for these abat- toirs to evaluate the efficiency of their wastewater treatment system. To promote this, understanding of the physicochemi- cal and biological constituents their wastewater plays a major role. Besides, understanding of the nature and characteristics of wastewater is also important in the design and operation of wastewater treatment, and reusability of the wastewater. Thus implies knowing the characteristics of the wastewater of Kera and Luna abattoirs are crucial. Therefore, this study aimed at investigating the abattoir wastewaters for characterization and
evaluation of the available wastewater treatment methods.
The study areas were two abattoirs out of the major abattoirs found in central Ethiopia. Those were Kera abattoir (in Addis Ababa city) and Luna abattoir (in Modjo town) their location map is as shown in Figure 2.1.
Triplicate sampling was conducted from January to February,
2011. Five water samples designated by L1 to L4 (Luna abat- toir) and K1 (Kera abattoir) were collected from both sites. The types of samples were raw effluent from both abattoirs and treated effluent from Luna abattoir as clearly described in de- tail in Table 2.1.
IJSER © 2015 http://www.ijser.org
International Journal of Scientific & Engineering Research, Volume 6, Issue 4, April-2015 1028
ISSN 2229-5518
Sampling site | Designa- tion | Type of wastewater sam- ple | Remark |
Kera abattoir | K1 | Raw wastewater | There is no any treatment facility |
Luna abattoir | L1 | Raw wastewater | The plant is using biological wastewater lagoon along with three connected flotation and settling Cham- bers (C1 , C2 & C3 ) prior to the lagoon |
Luna abattoir | L2 | Wastewater after passing three con- nected flotation and sedimentation chambers | The plant is using biological wastewater lagoon along with three connected flotation and settling Cham- bers (C1 , C2 & C3 ) prior to the lagoon |
Luna abattoir | L3 | Wastewater in the biological wastewater La- goon | The plant is using biological wastewater lagoon along with three connected flotation and settling Cham- bers (C1 , C2 & C3 ) prior to the lagoon |
Luna abattoir | L4 | Treated Wastewater leav- ing the biological wastewater La- goon | The plant is using biological wastewater lagoon along with three connected flotation and settling Cham- bers (C1 , C2 & C3 ) prior to the lagoon |
Triplicate composite samples of raw effluent were collected from both sampling sites designated as L1 and K1 from Luna and Kera abattoirs, respectively. In addition to this, in the case of Luna export abattoirs a treated wastewater sample i.e. efflu- ent passing through the three floatation and sedimentation chambers (L 2 ), from the wastewater treatment lagoon (L 3 ) and leaving the wastewater treatment lagoon (L4 ) were also col- lected, but not from the Kera abattoir since it does not have any treatment facilities. These triplicate samplings were col- lected from both sites during four hours of production time two weeks interval. The samples from each period during four hours were mixed to produce half to one half liter representa- tive samples in each sampling date.
The reason for the selection of four hour is in order to produce representative samples. The selection of dry season and two weeks gap were in order to produce average data on the char-
acteristics of those abattoirs by taking in to consideration the time limit given to complete this work.
The conductivity (EC), temperature, pH, turbidity and dis- solved oxygen (DO) of the wastewater were measured imme- diately on the sampling sites. It was done using a conductivity meter (Wagtech International N374, +M207/03IM, USA) to measure conductivity (EC), portable DO meter (Hach P/N HQ30d, Loveland. CO, USA) to measure both the dissolved oxygen and temperature, a portable pH meter (Wagtech Inter- national N374, M128/03IM, USA) was used to determine pH and Jackson Candle Turbidimeter (in JTU) to measure turbidi- ty. These equipments were calibrated one day before each sampling period.
The Chemical oxygen demand (COD), color, nitrate nitrogen (NO3 --N), ammonia nitrogen (NH3 -N), nitrite nitrogen(NO2 - N), Total phosphorus (TP), Orthophosphate (PO4 -3), Sulfide (S-
2) and Sulfate (SO4 -2) were measured by using spectropho- tometer (Hach model DR/2400 portable spectrophotometer, Loveland, USA) according to Hach procedures[8]. Fat, oil and grease (FOG), Five-day biochemical oxygen demand (BOD5 ), total solids (TS), total suspended solids (TSS) , Total coliform (TC) and Fecal coliform (FC) were determined using the standard methods of American Public Health Association (APHA)[9]. Except for the FOG determination, which was done in the JIJE Laboglass analytical service laboratory, Addis Ababa, all the parameters analysis were done in the Environ- mental Science Program Laboratory, Addis Ababa University.
Evaluation of wastewater treatment was done from the charac- teristics of wastewater flowing in and out of the lagoon cell, i.e. its removal efficiency was obtained by calculating the dif- ference in each parameter concentrations between the influent
IJSER © 2015 http://www.ijser.org
International Journal of Scientific & Engineering Research, Volume 6, Issue 4, April-2015 1029
ISSN 2229-5518
![]()
and effluent of the lagoon cell by using the mathematical equestion below.
Where, Cinf = the concentration of the raw effluent, C eff = the concentration of the wastewater leaving the biological wastewater treatment lagoon.
Wastewater characteristics based on the analysis of the com- posite sample from raw wastewater of both abattoirs are shown in Table 3.1. This Table summarizes the mean and standard deviation of the physicochemical and bacteriological properties of wastewater of both plants. Except for FOG was analyzed in only one sample of the three sampling period, all the rest parameters were analyzed in each sampling period.
teristics of the abattoir raw wastewater![]()
![]()
N.B: The value in parenthesis in the above Table is the range of the corresponding
parameter and *JTU: Jackson turbidity unit.
It is known that pH is the measure of acidity and alkalinity of water. The pH of both abattoirs untreated wastewater samples were oscillating between slightly acidic and basic range, with values ranging from 6.8-7.6 for Kera abattoir and form 6.81-
8.10 for Luna abattoir (Table 3.1). However, the mean pH level of both abattoirs wastewater were slightly basic with values of
7.3 for the former and 7.24 for the latter, which were within the EPA tolerance limits of 6.0-9.0 for the discharged of wastewater from abattoir industries into surface water [10].
The temperatures of the untreated effluent in both abattoirs (Table 3.1) were also within the EPA abattoir wastewater dis- charge limit (not exceeding 40°C) [10]. However, the average temperature of Luna abattoir effluent (28.12°C) was slightly higher than that obtained at the effluent of Kera abattoir (26.55°C). This is due to the difference in climatic conditions of the two sites. Both temperature and pH value found in this study were in agreement with previous similar study done in Nigeria, which were ranging 26-29°C and 7.6 -8.2 pH units respectively[11].
The conductivity of water is an expression of its ability to con- duct an electric current. The conductivity levels of both abat- toirs wastewater were considerably high (Table 3.1). Those values indicate that both abattoirs wastewater contained sub- stantial dissolved (mobile) ions such as sulfate, nitrate, Iron ion and other ions.
Color is the measure of aesthetic value of water, the mean val- ues of the abattoirs wastewater were observed 19733.33 TCU in Kera abattoir and 1682 TCU in Luna abattoir which is much higher compared to the WHO aesthetically displeasing limit (typically exceeding 15 TCU) [12]. This is due to the fact that the abattoirs wastewater color was dominated by blood since blood is one of naturally colored substances. So that discharg-
IJSER © 2015 http://www.ijser.org
International Journal of Scientific & Engineering Research, Volume 6, Issue 4, April-2015 1030
ISSN 2229-5518
ing such effluent to rivers could alter the natural characteris- tics of the water.
The mean TS, TSS and turbidity level of both abattoirs were also found high (Table 3.1) enough to cause pollution. These Values were found similar with previous studies obtained between 2244 - 7121 mg/L for TS [13] and between 1300-3400 mg/L for TSS [14]. Such elevated value of solids in both abat- toirs wastewater could be attributed to various solid by- products such as animal feces, soft tissue removed during slaughtering and cutting, fats, and soil from hides and hooves. Discharge of solids as well as blood and urine would increase the turbidity of water. Further these cause a long term de- mand for oxygen because of the slow hydrolysis rate of the organic fraction of the material. This organic material may consist of fat, proteins and carbohydrates. The natural biodeg- radation of proteins will eventually lead to the discharge of ammonium, which ammonium oxidation into nitrite and ni- trate by nitrifying bacteria, leads to an extra consumption of oxygen on its oxidation by bacteria [15].
DO is a measure of the degree of pollution by organic matter, the destruction of organic substances. DO standard for sus- taining aquatic life is stipulated at 5 mg/L a concentration be- low this value adversely affects aquatic biological life [16] . However, the mean DO values of raw wastewater in both abat- toirs (Table 3.1) were obtained less than 5mg/L. So that dis- charging of those effluents to rivers would be harmful for sus- taining aquatic life.
The organic matter content of water is also measured as BOD and COD [17] . The mean BOD and COD values in this study were found extremely high (Table 3.1). These values were found much higher than EPA standard limits of 80mg/L (BOD) and 250mg/L (COD) for the discharged of abattoirs
wastewater into surface water [10]. However, the COD value
in this study was comparable with the value found by [13] ranging from 2333 to 11530 mg/L. Obtaining high BOD and COD result in this study is expected since abattoir wastewater quality depends on the degree of separation of blood and oth- er by-products[18]. However, blood collection and processing was not practiced in both plants rather it was main component of the wastewater, and is reported that blood as high contrib- utor of organic load with 1500,000 mg/L to 200,000 mg/L BOD and 375,000 mg/L COD[19]. Therefore, the high BOD and COD values obtained in this study could be mainly at- tributed to blood generated throughout the slaughtering oper- ations and point out that high organic materials present in both abattoirs wastewater.
The nutrients (N and P) concentrations of Kera abattoir wastewater was found four to five times higher than Luna abattoir (Table 3.1), which means comparatively low in Luna due to the partial segregation of rumen content (paunch) from the wastewater but in the case of Kera abattoir it is completely part of the wastewater. Discharge of such wastewater with high nutrients (N, P) (Table 3.1) may cause eutrophication of the receiving water bodies. Excessive algae growth and subse- quent dying off and mineralisation of these algae, may lead to the death of aquatic life because of oxygen depletion [20] . The phosphate and ammonia value obtained in this study was in parallel with the value obtained by [21] from hog slaughtering which were ranging 20-80 mg/L of phosphate and 19-169 mg/L ammonia.
The wastewater also contained substantial amount of sulfate and sulfide with average values of presented in Table 3.1. These values are tremendously high and might be attributed to by-products of dressed animals having protein nature since sulfur is constituents of some proteins. Discharging of such wastewater might cause unpleasant odor in the receiving wa-
ter body and toxic effect on the aquatic organism upon its re-
IJSER © 2015 http://www.ijser.org
International Journal of Scientific & Engineering Research, Volume 6, Issue 4, April-2015 1031
ISSN 2229-5518
duction and depletion of oxygen during its oxidation by mi- croorganisms in the water.
The determination of FOG level in both sampling sites (Table
3.1) was found beyond EPA discharge limit (15 mg/L) [10]. This level was recorded considerably higher in Kera abattoir than that of Luna abattoir wastewater. Thus might be due to the difference in the types of animals slaughtered and the ef- fectiveness of fat collection during the slaughtering process. Discharging effluents containing oil and grease to surface wa- ter could cause toxic effects on aquatic organisms e.g. fish [20].
The result from the bacteriological studies of these abattoirs effluent showed that it contains hundred thousand to millions colony forming units of total coliform and fecal coliform groups of bacteria per hundred milliliters of the wastewater (Table 3.1). It was observed that maximum counts were ob- tained in Kera abattoir samples in comparing Luna abattoir. The presence of these bacteria may indicate the possible pres- ence of pathogens such as Salmonella ssp, Campylobacter je- juni, and gastrointestinal parasites, including Ascaris sp., Gi- ardia lamblia, and Cryptosporidium parvum [22]. Pathogens might threaten public health by migrating into groundwater or through traveling off-site by surface water, wind, or vectors.
3.2 The Mean Variation and Correlation of the abattoirs
As it can be seen from the result (Table 3.1) the average physi- cal, chemical and bacteriological characteristics of the raw wastewater with the exception of temperature and DO, Kera abattoir is much higher than that of Luna abattoir. This was also viewed statically using a least significant difference (LSD) post Hoc multiple comparison of SPSS at the 0.05 significant levels to see whether the mean concentration of pollutants between the two abattoirs raw wastewater varied significantly
or not (Table 3.2).
* : The mean difference is significant at the 0.05 level.
No mark: The mean difference is not significant at the 0.05 level
The multiple comparison (Table 3.2) revealed that the mean value variations of sulfide, EC, TSS, TP, PO4 -3, nitrite, SO4 -2, COD, BOD, FC and TC are significantly varied (p<0.05) be- tween the two abattoirs during the triplicate sampling period analyses. However, the rest few parameters such as color, pH, temperature, DO, NO2 - and NH3 are not significantly varied (p>0.05) between the two abattoirs. The high variation in phys- icochemical characteristics such as COD, BOD and TS might be due to the difference in the type of animals slaughtered [23] i.e. types of animals slaughtered in the case of Kera abattoir is dominated by cattle and few numbers of goats and sheep whereas in the case of Luna abattoir mostly goats and sheep, and rarely cattle are slaughtered. This means larger animals are expected to generate large quantity of waste which led to generate high concentration of wastewater. Similarly, the total weight of the total number of animals slaughter during each sampling period may also varied. In addition to these, there is a by-product waste management variation i.e. part of the ru- men contents of Luna abattoir is transported and digested separately where as in Kera abattoir is constituents of the wastewater. The difference in water consumption may also affect the concentration of the wastewater [21], which means less water consumption led to generate concentrated wastewater.
IJSER © 2015 http://www.ijser.org
International Journal of Scientific & Engineering Research, Volume 6, Issue 4, April-2015 1032
ISSN 2229-5518
The difference in bacteriological loads of the two abattoirs mainly arises from the management of rumen contents. Part of the rumen contents (containing partly digested feed and m manure) of Luna abattoir is transported and digested sepa- rately but not practiced in Kera abattoir. Further, from the on- site observation the hygienic nature of the slaughtering opera- tions were also different. For instance, the workers’ clothes and shoes were quite unclean in case of Kera abattoir as com- pared to Luna. Moreover, the workers in this abattoir use same shoe in and out of slaughtering area. This could be attributed to high coliform bacterial load in Kera wastewater than Luna.
The correlations among some physicochemical properties of
both abattoirs raw wastewater is presented in Table 3.3. The results of the analyses for most parameters show the expected trends in water quality.
*. Correlation is significant at the 0.05 level (2-tailed). , **. Correlation is significant at the 0.01 level (2-tailed). No mark: not significant correlation, Correlation rating: >0.81= strong, 0.81- 0.31= moderate, <0.31=weak
International Journal of Scientific & Engineering Research, Volume 6, Issue 4, April-2015 1033
ISSN 2229-5518
Once the raw wastewater had made desired change by the lagoon system in Luna abattoir, it was resampled and ana- lyzed for physicochemical and bacteriological characteriza- tion. The recharacterisation was done to evaluate the overall reduction in pollution load of the wastewater by the wastewater treatment lagoon of Luna abattoir. This was per- formed from January to February 2011, resulted in a total of
four samples designated as L1 , L2, L3 and L4 .
The influent COD, BOD, turbidity, TS, TSS, orthophosphate, TP, ammonia nitrogen, nitrate nitrogen, nitrite nitrogen, sul- fide, sulfate, FC, TC, and FOG concentrations were selected as operational variables in evaluating the wastewater treatment lagoon. Influent physical and chemical characteristics were differing during the three sampling period for most of the pa- rameters. It showed a high variation with pronounced peaks during the 2nd sampling period (January) illustrated in Figure
4.1. It may be suggested that wastewater in the abattoir is var- ying from time to time due to the variation in number of ani- mals slaughtered.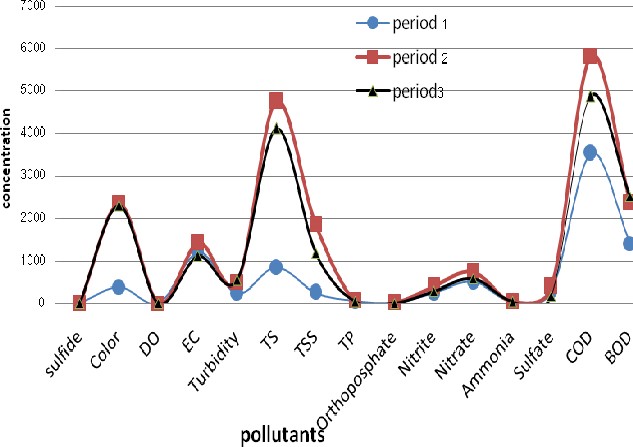
The average influent and effluent physicochemical and bacteriological characteristic the Luna abattoir wastewater at each sam- pling points were presented in Table 4.1
IJSER © 2015 http://www.ijser.org
International Journal of Scientific & Engineering Research, Volume 6, Issue 4, April-2015 1034
ISSN 2229-5518
It was observed that before treatment the water was turbid, high total solids, high total suspended solids and colorful. However, after treatment the color of water gradually be- comes clear and less turbid and solids, the removal efficien- cy of turbidity, total solids, total suspended solids and color are illustrated in Figure 4.2. This showed that the influents were reduced more than half its load after passing though the treatment and it is noticed that the overall performance of the treatment system was satisfactory for removal of these pollutants.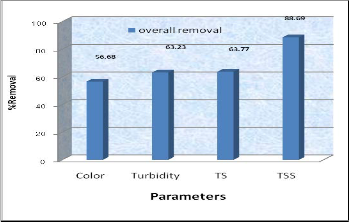
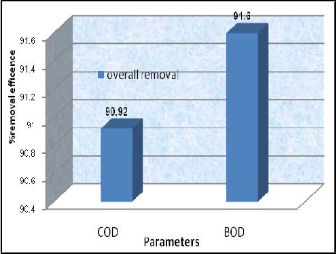
The nitrogen compounds removal by the treatment system was as clearly seen in the Figure 4.3. The nitrite nitrogen and nitrate nitrogen were seemed efficiently removed
84.34% and 97.78 %. This is due to scarcity of DO in the lagoon (0.58mg/L ) the facultative denitrifying bacteria in
the lagoon use organic waste as carbon source ( electron
IJSER © 2015 http://www.ijser.org
International Journal of Scientific & Engineering Research, Volume 6, Issue 4, April-2015 1035
ISSN 2229-5518
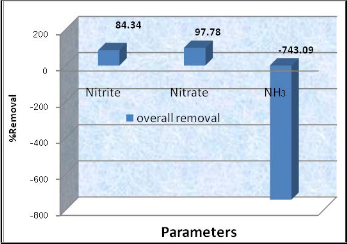
donor ) and the nitrite nitrogen and nitrate nitrogen was used as final electron acceptor ( source of oxygen) to oxi- dize the organic waste to produce bacteria biomass and carbon dioxide. The low concentrations of nitrates and ni- trites in lagoon effluents indicate that nitrification generally does not account for a significant portion of ammonia-N
removal [24]. Biological nitrification depends upon ade-
quate environmental conditions for nitrifiers to grow and is affected by several factors such as temperature, dissolved oxygen concentration, pH value, and wastewater character- istics [24]. The carbon dioxide produced made pH of the lagoon slightly acidic (6.66). The low pH in the lagoon pre- vented the rate of gaseous ammonia losses to the atmos- phere. Since ammonia lose to atmosphere depends mainly on the pH value, alkaline pH shifts the equilibrium equa- tion (NH3 + H2 O NH4 + + OH-) toward gaseous ammonia, where as acidity pH favored towards the formation of am- monium ion. This result ammonia concentration negatively removed from wastewater lagoon (Figure 4.3). The increase in concentration of ammonia indicated that absence of nitri- fication (oxidation of ammonia) in the lagoon system since nitrification affected by different factors such as carbona-
ceous organic matter (BOD ): the nitrifying bacteria convert
5
the ammonia to nitrite and nitrate much more efficiently
when there is little carbonaceous organic matter (BOD )
5
present, pH (nitrification is favored at alkaline condition pH greater than eight) and DO (greater than two mg/L) [25].However, the lagoon system was characterized with
low pH and DO level.
The results of the BOD and COD of the various samples after each stage of the treatment are represented in Table
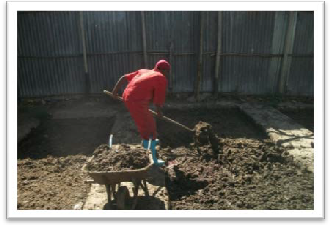
4.1. The table shows the result of the BOD and COD analy- sis and it gives the BOD of the influent sample to be 2110 mg/L and COD 4752.67 mg/L which is higher than [10] standard for effluent discharge of 25mg/L. After the first stage of treatment, which is the chambers, the BOD reduced to 633.33 mg/L and COD 3858 mg/L. This is due to the chambers acted as anaerobic pond. Since the floating mate- rial in the wastewater such as animal dung, fat, and other lighter solids were served as a lid to the chambers and led to be anaerobic condition as shown in Figure 4.5. Influent after passing through all stages of treatment BOD and COD were reduced to 177.33 mg/L and 431.67mg/L respectively. The overall percentage removal of BOD and COD are illus-
trated in Figure 4.4.
IJSER © 2015 http://www.ijser.org
International Journal of Scientific & Engineering Research, Volume 6, Issue 4, April-2015 1036
ISSN 2229-5518
BOD
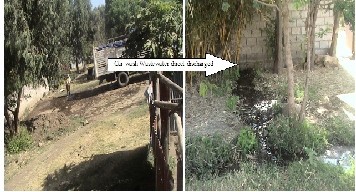
The overall removal of organic load of the treatment system was substantially high. However, due to in proper man- agement and lack of trained professionals in the factory as well as limited capacity of the lagoon, all the wastewater generated from the factory is not passing through the avail- able treatment system. A portion of the wastewater was directly channeled to the environment for example carwash wastewater (Figure 4.6) and also when the lagoon is filled sometimes wastewater was discharged from the chambers before the required reduction had been performed by la- goon system. This undermines wastewater management of the industry.
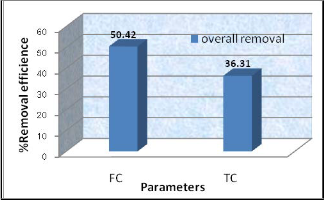
Similarly, the bacteriological reduction i.e. FC and TC level in each of stage treatment is presented in the Table 4.1, and their removal efficiency are depicted in Figure 4.7. This shows the reduction of the bacteriological load by the treatment was very limited. The limited bacteriological load reduction by wastewater treatment system at each stage was due to bacterial pathogen removal is dependent on long retention times, high pH and DO (mainly generated by algal photosynthesis) necessary for photo-oxidative damage which in turn is promoted by high light intensity [25] . However, in the chambers and lagoon was observed low pH, less dissolved oxygen (DO) due to limited photo-
synthesis and inadequate exposure to direct sunlight. The
IJSER © 2015 http://www.ijser.org
International Journal of Scientific & Engineering Research, Volume 6, Issue 4, April-2015 1037
ISSN 2229-5518
result suggested that disinfection is required before dis- charging the wastewater to environment.
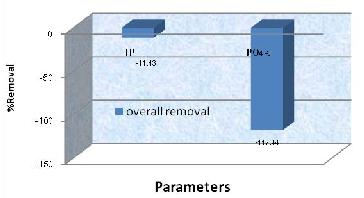
PO4 -3 and TP
and TC .
The level of phosphate in the outlet of the treatment system was higher than the inlet which led to the negative removal of phosphate by the wastewater treatment facility as shown
in the graph below (Figure 4.8). This might be happening from the anaerobic condition of the chamber (Figure 4.5) and the lagoon with negligible DO concentration less than
1mg/L due to the scum formation of the floating materials at top of the lagoon system (Figure 4.9) which led to the polyphosphate bacteria to release phosphate. However, to achieve phosphate removal, it needs aerobic condition where polyphosphate bacteria have the ability to accumu- late phosphorus in excess of the normal requirements. Phosphate precipitation also can be achieved at alkaline condition, but the pH of the chamber as well as lagoon was slightly acidic which hindered phosphate precipitation.
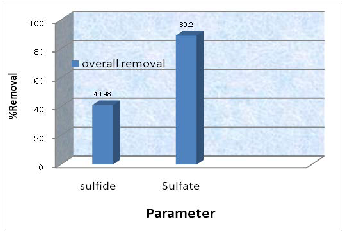
Sulfate considerably reduced from wastewater in all stages of the treatment system (Table 4.1). This is due to very low DO concentration of (Less than 1mg/L ) the lagoon and chambers (anaerobic conditions) where sulfate-reducing bacteria (SRB) utilize sulfate to oxidize organic compounds of the wastewater and generate sulfide (S-2) and elemental sulfur. This attributed to the increased sulfide (S-2) concen- tration in the chambers. However, portion of the sulfide (S-
2) escaped during the transfer of the wastewater from chamber to the lagoon as well as during discharge of the effluent out of the lagoon which led to be positively re-
moved from the wastewater (Figure 4.10).
IJSER © 2015 http://www.ijser.org
International Journal of Scientific & Engineering Research, Volume 6, Issue 4, April-2015 1038
ISSN 2229-5518
Figure 4.10 Overall percentage of removal efficiency of sulfate (SO4 -2) and sulfide(S-2)
The removal of Fat, Oil and grease (FOG) content of the wastewater was 66.18% after passing through all stages of the treatment system. This removal is not satisfactory since FOG consists of a group of related constituents of special concern in wastewater treatment due to their unique phys- ical properties, i.e. they are hydrophobic and have low sol- ubility in wastewater, resulting relatively low biodegrada- bility by microorganism [26]. As a result their removed
from such biological treatment system is very limited.
As it can be seen from Table 5.1 except pH and Tempera- ture, all the physicochemical parameters of the untreated wastewater (Kera abattoir) and partially treated wastewater (Luna abattoir) do not comply with the EPA [10] abattoir effluent discharge limit into surface waters. This indicates that discharging such effluents devastate the receiving environment.
Raw wastewater of both abattoirs were characterized by high concentration of organic matter (COD and BOD), Ni- trogen and phosphorus nutrients, sulfates, solids (TS and
IJSER © 2015 http://www.ijser.org
International Journal of Scientific & Engineering Research, Volume 6, Issue 4, April-2015 1039
ISSN 2229-5518
TSS) and fats, oil and grease (FOG) as well as high bacterio- logical load (FC and TC).
The concentration of both abattoirs wastewater was signifi- cantly differing (p<0.05) due to the difference in the type of animals slaughtered, rumen content separation, and live weight killed as well as water consumption in both abat- toirs. As a result of these variations, Kera abattoir raw wastewater was found higher concentration of pollutants than Luna abattoir raw wastewater.
The temperature and pH of both abattoirs raw wastewater were within EPA [10] effluent discharge limits to surface water. However, the rest parameters were much higher than these discharge limits. These can lead significant effect on the receiving environment.
Even though a high reduction in pollutants load of the Lu- na abattoir wastewater, the overall performance of wastewater treatment system was did not comply with EPA [10] effluent discharge limit with the exception of the pH and temperature. Therefore a there is need of improvement and optimization of its wastewater treatment system.
The authers would like to thank Center for Environmental Science, School of Graduate Studies, Addis Ababa Universi- ty for financial and laboratory facilities support.
[2]Benka-Coker, M. and Ojioro, O. (1995). Effect of slaughter- house wastes on the water quality of Ikpoba River, Ni- geria. Bioresource Technol 52: 5-12.
[3] Caixeta, C. E. T., Cammarota, M. C. and Xavier, A.M. F. (2002). Slaughterhouse wastewater treatment: valuation of a new three-phase separation system in an UASB re- actor, Biores.Technol. 81: 61-69.
[4]Kobya, M., Senturk, E., and Bayramoglu, M. (2005). Treat- ment of poultry slaughterhouse wastewater by eletro- coagulation, Journal of Hazardous Materials, 133:172-176.
[5]AL-Mutairi, N.Z. (2006). Coagulant toxicity and effectiveness in a slaughterhouse wastewater treatment plant, Ecotox- icology and Environmental Safety 65:74-83.
1-28.
[11] Akan, J.C., Abdurahman, F.I. and Yusu, F.E. (2010). Physical and chemical parameters in slaughterhouse wastewater samples. pacific journal of science and technology 11:640-
648.
World Health Organisation, Jeneva.
[13]Masse, D.I., and Masse L. (2000a). Treatment of slaughter- house wastewater in anaerobic sequencing batch reac- tors. Can. Agric. Eng. 42: 375-387.
Operating experience: anaerobic treatment at Packer- land Packing. In Proc.44th Purdue Ind. Waste Conf., Chelsea, MI, pp.825-834.
IJSER © 2015 http://www.ijser.org
International Journal of Scientific & Engineering Research, Volume 6, Issue 4, April-2015 1040
ISSN 2229-5518
01.htm#TopOfPage accessed July20, 2011>.
[16] Chapman, D. (1996). Water quality assessments: A guide to the use of biota, sediments and water in environmental monitoring 2nd Ed. UNESCO, World Health Organiza- tion and United Nations Environment Programme, London.
93.
[18] Mittal, G.S. (2004). 'Characterization of the Effluent Wastewater from Slaughterhouses for Land Applica- tion', Food Reviews International, 20:229 -256.
41:235- 245.
821-B-01008, Office of Water, US Environmental Protec-
tion Agency, Washington, DC.
[21] Masse, D.I. and Masse, L.(2000b). Characterization of wastewater from hog slaughterhouses in Eastern Can- ada and evaluation of their in plant wastewater treat- ment systems. Can. Agric. Eng. 42:139-146.
[23] Johns, M.R. (1995). Developments in wastewater treatment in the meat processing industry: A review. Bioresource Technology. 54: 203-216.
IJSER © 2015 http://www.ijser.org