International Journal of Scientific & Engineering Research Volume 4, Issue 1, January-2013 1
ISSN 2229-5518
Cavity Distribution in a Multi-strained AA5083 Product
Samuel T. Adedokun
Department of Mechanical Engineering, Covenant University, Canaanland, Ota, Ogun State, Nigeria. e-mail: ogboman@yahoo.com
Abstract
Cavitation in superplastically formed aluminum alloy 5083 (AA5083) material has been found to be dependent on factors such as tensile strain, stress, strain rate and temperature. In this work, the cavity size distribution in a multi-strained item produced through biaxial superplastic forming process is presented using Image Pro Plus analysis of the metallographs. It was generally found that there is an increase in the average number of cavity per unit area from the less-strained to the more strained regions of the product. Also, there is a significant textural homogeneity across the material as indicated in the inverse pole figures obtained through x-ray pole figure scan.
Keywords: Biaxial superplastic forming, Strained regions, Cavities, Texture
1 INTRODUCTION
A
—————————— • ——————————
proper temperature and strain rate [6].
Superplastically formed materials have been found to
t the International Conference on Superplasticity
(ICSAM – 91) in Osaka, Japan, superplasticity was defined as the ability of polycrystalline materials to exhibit very high elongation prior to failure in a generally isotropic manner. Superplasticity has also been defined as the ability of certain materials to undergo extreme elongation at the
————————————————
• S. T. Adedokun is a lecturer in the Mechanical Engineering Department of
Covenant University, Canaanland, Ota, Ogun State, Nigeria., PH-
+2348071156114. E-mail: sta07@my.fsu.edu
develop reasonable amount of cavitation after their deformation. The size and distribution of cavitation have also been found to depend on strain, stress, strain rate and temperature conditions during deformation. Cavitation behaviour of superplastic materials has been less examined when deformed biaxially [1]. In this work, the cavitation behaviour of AA5083 formed by a biaxial superplastic forming process to form a multi-strained product is presented. Also, the results from an x-ray diffractometer scan on the different strained parts are given in the form of
inverse pole figures.
IJSER © 2013 http://www.ijser.org
International Journal of Scientific & Engineering Research Volume 4, Issue 1, January-2013 2
ISSN 2229-5518
EXPERIMENTAL METHODOLOGY
A sheet of AA5083 with chemical composition of Al-4.6%Mg-
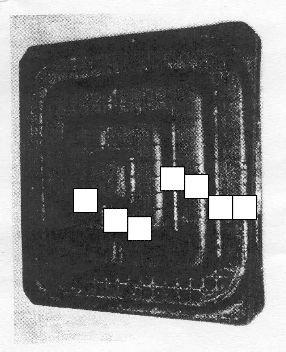
0.7%Mn-0.15%Cr was deformed to form into a die using a gas- blowing superplastically forming machine after being heated up to about 5000C. Figure 1 shows the multi-strained item after its formation from a sheet 30cm x 30cm x 0.2cm dimensions of the alloy. A small piece of the AA5083 material under investigation was cut from each of the seven (7) regions (also referred to as samples 1 to 7) as indicated in Figure 1. The strained regions are marked 2, 3, 4, 5, 6 and 7, while ‘1’ is unstrained. Each piece was then mounted using epoxy resin, ground, polished and observed under an optical microscope at a magnification of 100. The grinding was done on SiC backed
papers with grit sizes of 800,
1200 and 2400. Thereafter, the polishing was carried out on MD-Mol© (3µ) using DP-Red© with the final polishing performed on MD-Chem (0.04 µ) with
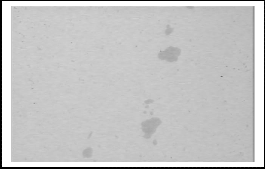
OP-AN©. All the grinding and polishing products were obtained from Struers©. Two of the images obtained are given in Figures 2 and 3 for strained levels 1 & 7 respectively. Fifteen (15) different areas of each of the samples were examined on the microscope and analyzed to obtain a good statistical result. The analysis of the microscopic images was carried out using an Image ProPlus© software to quantify the cavity area distribution on the specimens. Results obtained are graphically presented
4 3
7 2 1
6 5
IJSER © 2013 http://www.ijser.org
International Journal of Scientific & Engineering Research Volume 4, Issue 1, January-2013 3
ISSN 2229-5518
Figure 1: AA5083 tray with multi-strained regions 1 -7 superplastically produced by a gas blown method.
in Figures 4 and 5. In addition, the strain and thickness distribution from levels 1 to 7 is presented in Table 1 and
Figure 5. Phillips© x-ray diffractometer was later used to take the pole figure scan of the samples in order to assess their
crystal orientation distribution using the inverse pole figure.
RESULTS AND DISCUSSION
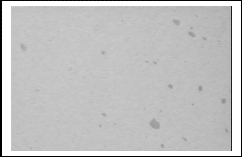
Figure 2: Strained level 1. Figure 3: Strained level 7.
Figures 2 and 3 are typical microstructures of samples 1 and 7 respectively which show cavities as dark gray areas. Analyses of the sizes of the cavities in terms of their average areas are graphically shown in Figures 4 and 5. Figure 4 represent cavities with areas between 2.01 µm2 and 8.00 µm2, while Fig.
5 is for those cavities greater or equal to 8.01 µm2 in area.
While there is a regular behavior with respect to the variation of the cavity area with the strained levels for areas between
2.01 µm2 and 8.0 µm2, an irregular observation was noticed for those cavities of areas greater than 8.0 µm2. This might have been due to the mechanisms involved in the migration and merging of cavities at higher strain levels (3). Usually, at
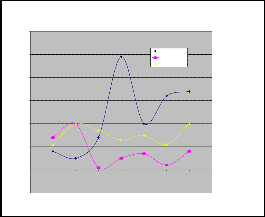
higher strains, smaller cavities merge to form bigger cavities.
120
Small Cavity Area Distribution in Multi-Strained Item
Large CavityArea Distribution in Multi-Strained Item
60
100
2.01 - 3.0
3.01 - 4.0
4.01 - 5.0
5.01 - 6.0
6.01 - 7.0
7.01 - 8.0
8.01 - 20.0
50
20.01 - 30.0
30.01 and above
40
80
30
60
20
40
10
20
0
0 1 2 3 4 5 6 7 8
0
0 1 2 3 4 5 6 7 8
Strained Levels
-10
StrainedLevels
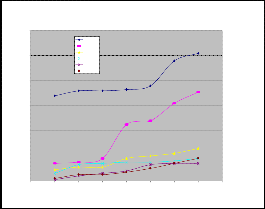
Figure 4: The Small Cavity Area Distribution . Figure 5: The Large Cavity Area Distribution
IJSER © 2013 http://www.ijser.org
International Journal of Scientific & Engineering Research Volume 4, Issue 1, January-2013 4
ISSN 2229-5518
of samples 1 to 7 produced the 2 theta peaks shown in Figure
Variation of the thickness and strain across the levels are presented in Figure 6. As expected, there is an increase in
strains from levels 1 to 7. Finally, x-ray diffractometry analysis
7. The inverse pole figures of some of the samples are presented in Figures 8 and 9 and they show textural
homogeneity across the samples.
Variation of Thickness, Strain vrs Strained Levels
counts
2.5
3500
2
1.5
1
0.5
Average thickness
Strain
3000
2500
2000
1500
1000
500
0
STEP 7
STEP 6
STEP 5
STEP 4
STEP 3
STEP 2
STEP 1
0
0 1 2 3 4 5 6 7 8
Strained Levels
10 20 30 40 50 60 70 80
°2Theta
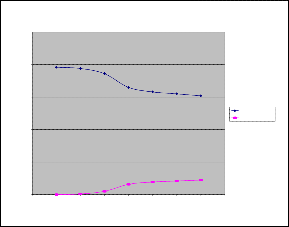
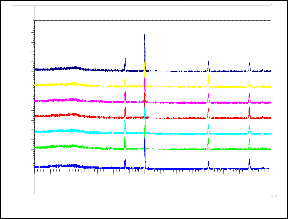
Figure 6: The variation of thickness and strain. Figure 7: The 28 peaks from 28 scan.
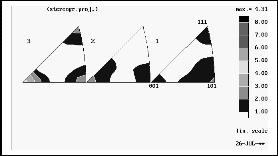
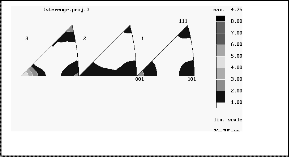
Figure 8: Inverse Pole Figure for Sample 1. Figure 9: Inverse Pole Figure for Sample 7.
CONCLUSION
The cavitation distribution in the multi-strained AA5083 item was found to follow an irregular order from regions 1 to 7. However, an increase in strain was reported from the lowest
to the highest regions. Finally, a textural homogeneity occurred through the test piece.
ACKNOWLEGEMENT
IJSER © 2013 http://www.ijser.org
International Journal of Scientific & Engineering Research Volume 4, Issue 1, January-2013 5
ISSN 2229-5518
I appreciate the contribution of the University of Lagos, Lagos, Nigeria for the opportunity given to me to carry out this work at the Mechanical Engineering Department, FAMU-FSU College of Engineering, Tallahassee, Florida, USA and many
thanks to National Science Foundation, USA for the funding.
REFERENCES
1. D. H. Bae, A. K. Ghosh “Cavity growth during superplastic flow in an Al-Mg alloy: I. Experimental Study”. Journal of Acta Materialia 50 (2002) 993 – 1009
2. D. H. Bae, A. K. Ghosh “Observations related to healing of interface damage and cavity nucleation during superplastic flow”. Journal of Materials Science and Engineering A000 (2001) pp000 -000
3. D. H. Bae, A. K. Ghosh “Cavity growth in a superplastic Al-Mg alloy: II. An improved plasticity based model”. Journal of Acta Materialia 50 (2002)
1011 – 1029
4. Hajime Iwasaki, Mamoru Mabuchi, Kenji Higashi and Terence G. Langdon. “The characteristics of microcavitation in high strain rate superplasticity”. Journal of Materials Science and Engineering A246
(1998) pp117 – 123.
5. K. C. Chan and K. K. Chow “The stress state dependence of cavitation in commercial superplastic Al5083 alloy” Journal of Materials Letters. 56 (2002). Pp 38 – 42. Sept. 2002.
6. Namas Chandra “Constitutive behaviour of superplastic materials” International Journal of Non-
Linear Mechanics 37 (2002) 461 – 484.
IJSER © 2013 http://www.ijser.org