tronic Nose (E-nose) is a device used to detect and recognize odours/vapours. Although it has been in the market for sev- eral years, but the size is large and expensive.
International Journal of Scientific & Engineering Research Volume 2, Issue 11, November-2011 1
ISSN 2229-5518
Carbon black polymer composite gas sensor for electronic nose
Fauzan Khairi Che Harun, Andik Marwintan Jumadi, Nasrul Humaimi Mahmood
Abstract— Nowadays, electronic noses (E-nose) become popular in industry. There are a few types of E-noses which are used to detect odorant and gases such as surface acoustic wave (SAW) device, optical sensor, metal oxide semiconductors (MeOX), and carbon b lack polymer composite. Electronic nose is a device that can be mimicking biological human nose, which can detect and differentiate types of odorant. This work focuses on how to fabricate carbon black polymer composite gas sensor. In addition, constant current source circuit has been designed to act as interface circuitry so that the change of resistance when exposed to the gas can be observed via LabVIEW. Besides that, the characteristics of each sensor were observed and study. This is to ensure the fabricated sensor gives the s ame responds with actual sensor. The result from the experiments shows that the fabricated carbon black polymer composite gas able to detect and gives respond just like the actual gas sensor.
Index Terms— Carbon black, E-nose, Gas sensor, polymer, LabVIEW, Metal oxide semiconductors (MeOX), surface acoustic wave(SAW)
—————————— ——————————
owadays, sensor for gaseous molecules plays an impor- tant part in monitoring the environment, controlling chemical processes, and in medical applications. Elec-
tronic Nose (E-nose) is a device used to detect and recognize odours/vapours. Although it has been in the market for sev- eral years, but the size is large and expensive.
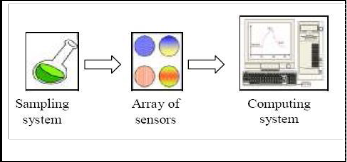
Fig.1. E-nose instrument.
Figure 1 shows the basic E-nose instrument. Basically there are three important parts in E-nose systems which are sam- pling system, array of sensors and a computer with pattern recognition. Sampling system is necessary to ensure constant operating condition. Array of sensors acts as detection system in E-nose instrument. When the sensors react with odorant, the change of electrical properties will occur. Lastly is the computing system which used to combine the response for all sensors.
The E-nose attempts to emulate the mammalian nose by us- ing an array of sensors that can simulate mammalian olfactory responses to aromas.
————————————————
Fauzan Khairi Che Harun is currently a Senior Lecturer at Faculty of
Electrical Engineering, Universiti Teknologi Malaysia.
Andik Marwintan Jumadi is a graduate student in Medical Electronics at
Faculty of Electrical Engineering, Universiti Teknologi Malaysia.
Nasrul Humaimi Mahmood is currently a Senior Lecturer at Faculty of
Electrical Engineering, Universiti Teknologi Malaysia.
E-mail: nasrul@fke.utm.my
E-noses based on the biological model work in a similar man- ner. Sensor array in E-nose system act as olfactory epithelium of human nose which contains million of sensing sense. The human olfactory receptors detect the odorant and convert the chemical response to electronic nerve impulses. In E-nose sys- tem, chemoresistive sensors react with the odorant and gener- ate electrical signal. In biological olfactory system also consist of olfactory bulb which operates the same task as the signal processing in E-nose. After pass through the olfactory bulb, the nerve impulses will go to the brain for analysis. Similarly, the chemical reactions in E-nose are interpreted in pattern rec- ognition using computer.
The human olfactory receptors detect the odorant and con- vert the chemical response to electronic nerve impulses. In E- nose system, chemoresistive sensors react with the odorant and generate electrical signal. In biological olfactory system also consist of olfactory bulb which operates the same task as the signal processing in E-nose. After pass through the olfacto- ry bulb, the nerve impulses will go to the brain for analysis. Similarly, the chemical reactions in E-nose are interpreted in pattern recognition using computer.
Carbon black polymer composite has shown great potential
in identifying gaseous analytics, which make it suitable for E-
nose sensor [1]. Sensor prepared from these materials can op-
erate in conditions of high relatively humidity and also show
highly linear responses for a wide range of gases. There are three main properties of carbon black, which are particle size,
structure and surface chemistry.
The diameter of spheric particles affects blackness and dis-
persibility when carbon black is mixed with other vehicles.
The size of structure also acted like particle size. But the in-
crease of structure size improves dispersibility but lowers blackness [12]. In the other words, carbon black with a larger
structure shows an excellent conductivity property. Besides that, these materials can operate at room temperature; make it suitable for this study. Moreover, current research is focused on making the devices smaller, less expensive and more sensi- tive.
IJSER © 2011
International Journal of Scientific & Engineering Research Volume 2, Issue 11, November -2011 2
ISSN 2229-5518
Carbon black (CB) is a good conductor. It has been used to form composites with a number of polymers in order to pre- pare sensitive materials for the measurements of organic va- pours [2]. CB can be used to improve the physical properties of polymers. CB with high structure has a high ability to form a continuous network in polymer matrix and hence leads to higher conductivity [3]. CB is a conductive filter and polymer is a non-conductive phase. The combination of this conductive filter and insulating phase will produce conductive polymer composite. CB incorporation with polymer matrix reduces the resistance of the composite to make it a potent resistive sensor [4]. The exposure to particular analyte cause the sensor to swell resulting in increasing of electrical resistance [1, 5].
Some works have shown that chemically sensitive resistors formed from composites of carbon black with collection of swellable insulating polymers are broadly responsive to a va- riety of odours yet allow classification and identification of organic vapours through application of pattern reorganization methods [6-8].
There are three main objectives in this study which are to fabricate carbon black/polymer gas sensor for the use of E- nose, to build interface circuitry and to investigate the beha- viour of carbon black/polymer composite. The scope has been divided into two parts which are hardware and software.
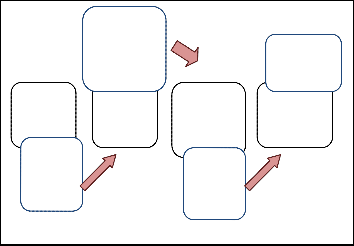
Figure 2 demonstrates the block diagram of project flow. Basi- cally, this project involves hardware and software implemen- tation. Sample gas is tested on the sensors which located in- side the measuring chamber. Measuring chamber is needed in order to avoid background odour. DC pump is used to flush the sample gas. By using interface circuitry, the sensors are connected to the computer via NI USB 6008.
and two different types of insulating polymers, which are PVPD (Poly (Vinyl pyrrolidon)) and PEG (Poly (Ethylene gly- col)). The solvent use is ethanol.
These types of polymer were chosen because they can dis- solve in ethanol. Carbon black polymer sensors are potential to have various responses by choosing the used materials of insulating polymers and conductive carbon blacks, and by modifiable relative quantities among them [9].
To begin with, the insulating polymer is dissolve in a solvent. To ensure the polymers are fully dissolved, the solutions were left overnight. Next, CB is suspended in the solution to pro- duce a composite solution of polymers and carbon black. The solvent use is ethanol 98%. They are homogeneously dis- persed by the physical agitation for a few minutes. The com- bination of polymer and CB should be 80% and 20% ratio. The contents of the composite solution are shown in Table 1. Based on the table, A refers to content of PEG in grams while B is content of PVPD.
TABLE 1
CONTENTS OF THE COMPOSITE SOLUTION
Carbon black po- lymer composite
Sample Sen- sors
Will
be test on
Inter- face circuitry
NI USB
6008
Lab- VIEW
Computer
The sensor electrodes were made by using a pair of thin wires separated between 1 to 5 mm. These wires were attached us- ing adhesive. Figure 3 (a) present the sensor before the fabrica- tion process. The composite solution will be put on the surface of the wire. The process was repeated until the resistance magnitude of sensors became to be in the range of 1 kΩ –
1 MΩ. Figure 3 (b) illustrate the sensor after the composition.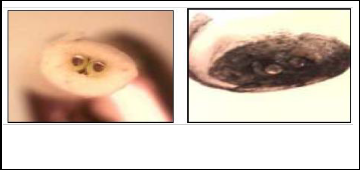
Fig. 2. Schematic block diagram of the E-nose system
Hardware construction is divided into two parts, which is in- cludes the built of the sensor electrode and preparation of the carbon black polymer composite solution. The materials use to fabricate the sensors are carbon black with good conductivity,
(a) Before (b) After
Fig.3. Sensor before and after the fabrication process.
IJSER © 2011
International Journal of Scientific & Engineering Research Volume 2, Issue 11, November -2011 3
ISSN 2229-5518
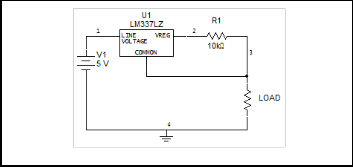
For measuring the change of sensor resistance upon odour exposure, interface circuitry was designed. Constant current source circuits are used as the interface circuit in this project. LM334 were used to build the circuit a constant current source for each sensor. LM334 has an ability to produce a small cur- rent value from 1µA to 1mA. Figure 4 shows the schematic diagram of constant current source circuit.
After fabrication process, the sensors were tested with an odour to see the responses. The first stage of odour analysis is to pump a reference gas through the sensor to obtain a base- line. In this experiment, the reference gas used is clean air which is pure gas. Next, the sensor was exposed to the se- lected odorant for 5 seconds. This will cause change in output signal. Then the sensor was flushed again with clean air for 20 seconds. The change of output signal was observed using mul- timeter MT-1820 for each sensor. Figure 5 shows the typical E- nose sensor response to an odorant.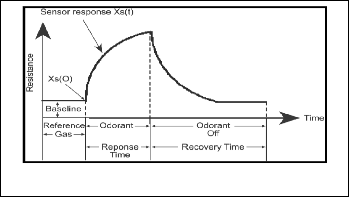
Fig. 4. Schematic diagram of constant current source circuit.
The main area of development in this work is to display the results using LabVIEW. The ability to design a layout that can shows the respond is necessary. In this project, NI USB 6008 was used as communication protocol between the hardware and LabVIEW programming.
In this work, the experiment setup consists of the flow control system, LabVIEW software, and a computer. The flow control system includes the DC pump motor and measuring chamber. The sensors are placed inside the measuring chamber to re- duce background odour effect. DC pump is used to flush sample gas in and out from the chamber. The sensors were directly connected to the multimeter and computer. The pro- cedures of the experiments is as following: (1) The sensor was exposed to the clean air for 20 seconds using DC pump motor, (2) Next, an odorant was exposed to the sensor for 5 seconds, (3) Then the sensor was ignored for 20 seconds with clean air, (4) The responds were observed and recorded using multime- ter which was connected to the computer, (5) Steps 1 until 4 were repeated for several times.
These sensors were tested on a perfume and the respond were observed using multimeter MT-1820. The responses for each sensor were observed to verify their characteristics. Addition- ally, the magnitudes of percentage ratio of maximum resis- tance change with respect to the initial resistance were discov- ered in order to know which sensor is more sensitive.
Next, by using the interface circuitry the sensors were con- nected to a computer to see the results via LabVIEW software. Only four sensors are tested. Two different types of odorants were exposed to the sensors.
Fig.5. Typical E-nose sensor response to an odorant.
Fundamentally, there are three time cycles of responds in E- nose. The cycles are baseline, response time and recovery time. When the sensor is exposing to the reference gas, it was called baseline. The time when the odorant is flushed to the sensor is called response time. On the contrary, the recovery time is when the odorant is pump out from the system. Figure 6 until
12 shows the graphs of resistance (kΩ) against time (S) for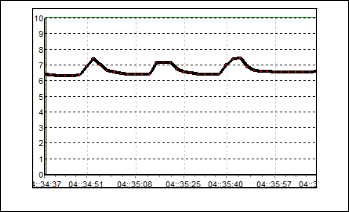
each sensor when exposed to selected odorant.
Fig. 6.Sensor, S1 characteristic.
Figure 6 shows the result of PEG sensor or S1. From the ex- periment, the baseline that we get is 6.4 kΩ. During the expo- sure of odorant, the resistance increase to 7.5 kΩ. The recovery time for this sensor is quite faster. For S2 which is PVPD sen- sor, the results as shown in Figure 7.
IJSER © 2011
International Journal of Scientific & Engineering Research Volume 2, Issue 11, November -2011 4
ISSN 2229-5518
Fig.7.Sensor, S2 characteristic.
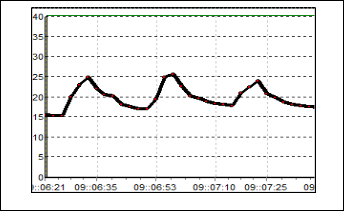
The baseline for this sensor is 17 kΩ. The resistance increas- es about 8 kΩ when the odorant is applied to the sensor. How- ever, the recovery time for this sensor is much slower than S1.
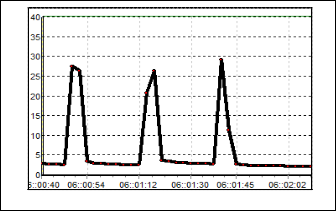
Fig.10. Sensor, S5 characteristic.
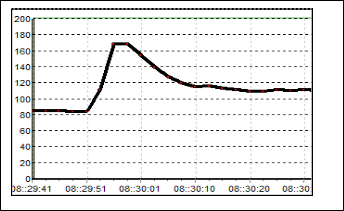
Fig.11. Sensor, S6 characteristic.
Fig. 8. Sensor, S3 characteristic.
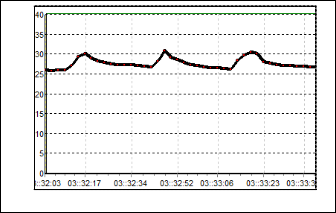
From the Figure 10, the result for S5 can be observed. Al- though the value of resistance is small, but it has the large re- sponds compare to the previous sensors. The baseline value is 4 kΩ and the value boost up to 27 kΩ when the odorant is flushed. Moreover, the recovery time for this sensor is much faster than the other sensors. Figure 11 shows the response of S6. The resis- tance raises only about 5 kΩ from its baseline. The baseline of this sensor is 26 kΩ, which mean the maximum value of resis- tance is 31 kΩ.
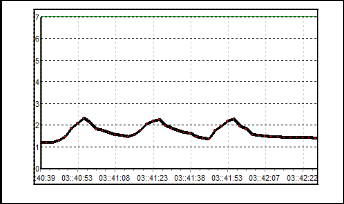
Fig. 9.Sensor, S4 characteristic.
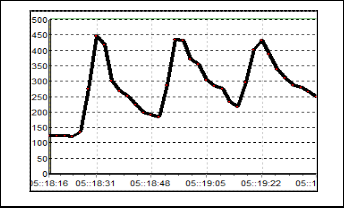
Figure 8 exhibit the results for S3. The change of resistance in this sensor is quite large where the baseline is 90 kΩ and the Rmax is 170 kΩ. After the odorant is flushed out from the cham- ber, the baseline of this sensor becomes 110 kΩ. This happen because the gas particle of odorant get stuck on the sensor sur- face. Responds for S4 can be seen in Figure 9. Based on the figure, the value of baseline is not uniform but indeed it has the same characteristic responds pattern. The conductivity decrease as the resistance increase up to 450 kΩ as the odorant is applied. Compared to the S1, S2 and S3, this sensor has the slowest recovery time.
Fig.12. Sensor, S7 characteristic.
For S7, there is only small change of conductivity. This can be seen from Figure 12. The baseline for this sensor is 1.5 kΩ. The rise of resistance is up to 2.3 kΩ. But this sensor also has a slower recovery time. The overall results of resistance over time are plotted using Excel as shown in Figure 13.
IJSER © 2011
International Journal of Scientific & Engineering Research Volume 2, Issue 11, November -2011 5
ISSN 2229-5518
Fig.13. Graph resistance over time (kΩ Vs S).
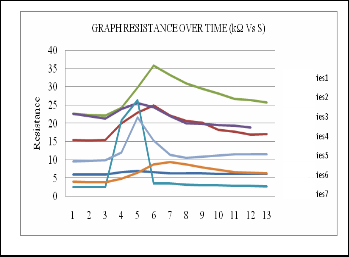
As we can see, S5 which made from 50% PEG and 50% PVPD gives the highest response of resistance. This means S5 is more sensitive compared to other sensors. However, the response of each sensor is different when dissimilar odorants is applied. Each sensor is sensitive to all volatile molecules but
S1 each in their specific way.
S2
S3
After using the multimeter, the sensors were tested with two
S4 types of odorants from brand Pucelle and Lovillea. Sample
S5 from Pucelle was assign as perfume A and Lovillea is perfume
S6 B. The responses after exposed to these sample were observed
S7 in computer via LabVIEW software. Constant current source circuits are used as interface circuitry for each sensor.
Only four types of sensors were tested which are S1 (PEG), S2 (PVPD), S5 (50% PEG – 50% PVPD) and S7 (85% PEG – 15% PVPD). Each sensor has been assigned for different waveform color.
Based on the results, we can see that each sensor produce
different response when exposed to the odorant. Each sensor
element gives rise to a unique change in resistance. The resis-
tance for each sensor does increase but each has different val- ue and different time to recovery.
The increase in resistance results from the disruption of conductive paths, naturally present in these composites. The conductivity in these systems arises from the carbon black while the selectivity results from the polymer. These compo- sites reversibly swell when exposed to a vapour or analyte, consequently increasing the electrical resistance of the compo- site.
Stability may be reached depending on the type of polymer. The average response time varies depending on the sensor's film thickness. The sensor time series resistances were norma- lized by subtracting the baseline resistance value R0 from each data point R in the time series and then dividing by R0, where R is the highest response of resistance and R0 is the baseline value.
R normalization = [(R − R0)/R0] × 100 (1)
The results from the calculation are shown in Figure 14.
S1
S7
S2
S5
Fig.15.Results when expose to odorant A.

Figure 15 is the results when perfume A is applied. S1 is represent by the green color of waveform. The blue color waveform indicates S2 which is PVPD sensor. On the other hands, the red color denote sensor S5 while S7 represent by the light blue waveform.
From the observation, S1 is more sensitive when exposed to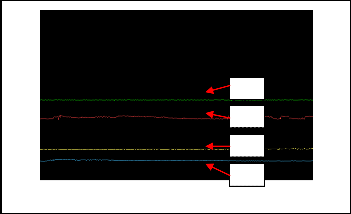
perfume A, followed by S7. On the other hand, the response for S2 and S5 almost have no change. There also some noise in the S5 signal. The causes, problems and solutions are discussed in next subsection.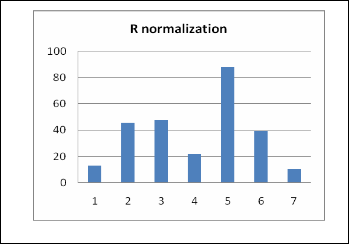
S1
S5
S2
Fig. 14. R normalization for each sensor.
S7
Fig.16. Results when expose to odorant B.
IJSER © 2011
International Journal of Scientific & Engineering Research Volume 2, Issue 11, November -2011 6
ISSN 2229-5518
Figure 16 is the results for the responses of sensors when perfume B is flushed. The waveform color represent the same sensors as Figure 13 except for S2 which change to yellow color. Compared to perfume A, S5 and S7 are more sensitive for perfume B.
From the results we can see the responds of each sensor are different for different odorants. Some of the sensor might be more sensitive for specific odorant but less sensitive for other odorant. As we discussed before, the selectivity of the sensor is depends on the polymer. The different odour detection ex- hibits from the sensors just like the biological nose.
The response obtained are not uniform. From the observation, the results are affected by noise. The noise probably cause by background odor. Some sensors are sensitive for different types of odorant.
In conducting the experiments some problems had occurred. One of the problems is difficult to get the desired output. Thus is due to the weakness of carbon black polymer sensor which is easily got poison on its surface. This might be happen when expose to high concentration vapour. Once it gets poison, the conductivity will be increase rapidly.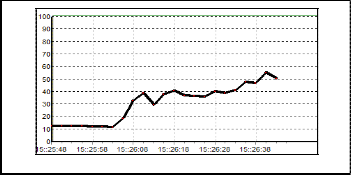
Figure 17 shows the response of poisoning sensor. To over- come the problem, a lot of sensors need to fabricate so it can cover the defective sensors.
Fig. 17. Poison sensor.
Another problem encountered is not easy to get resistance in range. The lack of composite solution will cause the high resistance value. On the contrary, the excess of composite so- lution will cause the resistance become lower than 1K. There- fore, the processes of putting the composite solution on the sensor electrode surface need to be repeated until the desired range is obtain.
The resistance of the sensor may vary from 1K up to 1M. The background odour and temperature variation water va- pour could affect the responds because the sensor possibly would react with it. Hence the sensor interface circuitry must work in a way to respond to quick changes while tuning out long time constant variation, just like the biological nose [10].
These sensors have been shown to exhibit trends in odour de- tection threshold each time it exposed to the gas. The odour detection responds generally parallel to human nose. There-
fore, the objective to fabricate the carbon black polymer com- posite gas sensor has been successfully achieved.
The interface circuitry also can work properly; where the conductivity of the sensor can be observe in voltage. Hence, the second objective also has been accomplished. The charac- teristics of the sensor results manage to been observed. Conse- quently, the third objective is complete. For the conclusion, the
project have reach its objectives and successfully done.
The materials to fabricate the sensor are limited so it is hard
to observe the value. There only two types of polymers availa- ble during the experiment. There also lack of stuffs to build the sensor electrodes. For future works, it is suggested that the sensor should be fabricated properly with enough material so that the response can be easily observed.
To achieve the best level of pattern recognition, it is recom- mended using the application of Artificial Neural Network (ANN). E-nose that uses ANN for data analysis has been es- tablished in numerous applications [11]. Using ANN in com- bination with a sensor array has been shown to enlarge the number of detectable odours.
As what we can see from the results, the change of voltage is small and almost cannot been seen. This is because the rise of resistance is small as the constant current supply is in micro value. Thus, it is suggested using amplifier to amplifier the signal.
Although E-nose have reach its popularity in the market at the moment, many research still been conduct to improve the quality. Nowadays people tend to grasp something smaller and portable. Current research is concentrated on making the devices smaller, less expensive, and more sensitive. Last but not least, it is advice to designing the sensor much smaller but with enough materials.
The authors wish to thank to Research Management Centre, Universiti Teknologi Malaysia and Ministry of Higher Educa- tion for supporting this work through research grant number,
78965.
[1] H. Lei, L.K. McGrathb and C.K. Hob, ―Modeling carbon black/polymer Composite Sensors‖, Sens. Actuator B: Chem, vol. 125, pp. 396-407, 2007.
[2] Li, Y., et al., ―Poly(4-vinylpyridine)/carbon black composite as a
humidity sensor‖, Sens. Actuators B: Chem, 123(1): pp. 554-559, 2007. [3] Elimat and Z.M., ―AC electrical conductivity of poly(methyl
methacrylate)/carbon black composite‖, Journal of Physics D: Applied
Physics, vol. 39, pp. 2824-2828, 2006.
[4] P.P. Sengupta, P. Mohapatra, J. Amamcharla and Y.K. Chang,
―Performance of polyvinylphenol-carbon black composite as ethanol
sensor for food safety applications‖, Conference of ASABE/CSBE North
Central Intersection, North Dakota, USA , October 12-13, 2007.
[5] J.A. Dickson1, N.S. Lewis2 and R.M. Goodman1, ―An integrated chemical sensor array using carbon black polymers and a standard CMOS process‖, Anal. Chem, 2000.
IJSER © 2011
International Journal of Scientific & Engineering Research Volume 2, Issue 11, November -2011 7
ISSN 2229-5518
[6] K.I. Arshak, E.G. Moore, S.A. Clifford, J.A. Harris, C. Cunniffe and G.M. Lyons, ―Response of Poly(viny1 acetate)/Carbon Black Composites to Ethanol Vapour and Temperature‖, Proc 24th International Conference On Microelectronics, vol 1, Serbia and Montenegro, 16-19 May, 2004.
[7] M.C. Lonergan, E.J. Severin, B.J. Doleman, S.A. Beaber, R.H. Grubbs,
and N.S. Lewis, ―Array-based vapor sensing using chemically sensitive, carbon black-polymer resistor‖, Chem. Meter. 8, pp. 2298-
2312, 1996.
[8] Dong, X.M., et al., ―Electrical resistance response of carbon black filled amorphous polymer composite sensors to organic vapors at low vapor concentrations‖,Carbon, 42(12-13): pp. 2551-2559, 2004.
[9] Y.S. Kim, S.-C. Ha, Y. Yang, Y.J. Kim, S.-M. Cho, H. Yang and Y.T.
Kim, ―Portable electronic nose system based on the carbon black–
polymer composite sensor array‖, Sens. Actuator B: Chem. 108, pp.
285-291, 2005.L.C. Wang, K.T. Tang, C.T. Kuo, C .L. Ho, S.R. Lm, Y. Sung, C.P. Chang, ―A portable electronic nose system with chemire- sistor sensors to detect and distinguish chemical warfare agents‖,2000.
[10] R.S. Hobson, A. Clausi, T. Oh, and A. Guiseppi-Elie, “Temperature correc- tion to chemoresistive sensors in an e-Nose-ANN system”, IEEE Sensors Journal, Vol. 3, No. 4, August 2003.
[11] http://www.carbonblack.jp/.Date access: 06/11/2010.
IJSER © 2011