International Journal of Scientific & Engineering Research, Volume 6, Issue 4, April-2015 1146
ISSN 2229-5518
Carbon Stocks of Pure Cedrus Deodara Forest in
Kumrat Valley, Dir Upper, KPK, Pakistan
Muhammad Amir, Asadullah khan, Adnan Ahmad, Alanmgir khan
Abstract: The study The Present study was carried out in pure Cedrus Deodara forest of Kumrat Valley Dir Kohistan. The study was aimed to calculate biomass (t ha-1) and carbon stock (t ha-1) in the above and below ground biomass. Overall, 32 sample plots were laid out. The size of each plot was 0.1 ha. In each sample plot stem density(t ha-1) tree diameter(cm),tree height (m),stem volume(m3ha-1),stem biomass(t ha-1),total tree biomass(t ha-1) and total carbon stock (t ha-1) was calculated. The result of the present study showed that average tree density was 238 trees ha-1. Average stem volume was measured as 1839.41 (m3ha-1).The mean stem biomass was 857.40 (t ha-1).The mean total tree biomass was estimated 1281.26 (t ha-1).The calculated carbon in above and below ground biomass of Cedrus Deodara forest was 640.63 (t ha-1).
Key words: Cedrus Deodara, Kumrat Valley, Climate Change, Biomass and Carbon Stock
—————————— ——————————
Carbon dioxide (CO2 ) is the most important greenhouses gas. Different human activities accelerating the rate of car- bon dioxide those causing global warming and climate change. Global climate change (CC) is the burning and hot issue among scientific community because of increasing carbon dioxide concentration in atmosphere day by day due to various manmade activities. According to intergovernmental panel on climate change (IPCCC) that earth average temperature increased 0.6 0C over last century and considered likely or probable happen to increased from 1.4 to 5.8 0F by the end of current century (LEAD,
2008).
Kyoto protocol recognized forest is one of the important carbon sinks. According to the Kyoto protocol, forests are de- fined as ecosystem that can attain at least 5 m height with 30% canopy cover and should cover at least 1 hectare area with width greater than 30 m. In a forest Five carbon should be reported from five pools which includes(1) carbon present in above-ground living biomass; (2) carbon in below-ground living biomass; (3) carbon in dead wood; (4) carbon present in fine litter and (5) soil organic carbon (Kyoto, 1997; Nizami, 2012: Adnan and Nizmai ,2014).
Pakistan is member to the Kyoto protocol. Being a member to the protocol each member country must figure out their stored carbon in the forest ecosystem. In Pakistan the measurement of stored carbon in forest are in initial steps. The present study was conducted in pure deodar forest of Kumrat valley Dir Kohistan Khyber Pukhtoonkhwa. The study was aimed to find out carbon stocks in pure deodar forest of Kumrat valley in above ground biomass and below ground biomass. The objective of the study was to measure the carbon stock in above and below ground biomass in pure deodar forest of the study area.
The Study was conducted in Kumrat valley which is located in District Dir upper, Provinces Khyber Pukhtoonkhwa, Pakistan. The latitude and longitude of Kumrat valley is 35º 32’11.44’’ N 72º 13’45.01’’ E. The elevations from sea level range from 2439-3048 m. The average precipitation in study area ranges from 700-1500 mm. Temperature ranges from 0.7-30ºC. Soil of study area is mostly loam and rich in humus with abundance of organic matter.
For the present study stratified random sampling was used. The Pure Cedrus deodara forest (PCDF) was divided into
four study sites. In each study site 8 samples plots were taken. The size of each sample plot was 0.1 ha. Over all 32 sample plots were taken in the PCDF. Stratification was based on forest cover and stem density.
IJSER © 2015 http://www.ijser.org
International Journal of Scientific & Engineering Research, Volume 6, Issue 4, April-2015 1147
ISSN 2229-5518
The area maps, topographic sheets, data about growing stocks were taken from respective forest department. The sam- ple plots were selected randomly within different strata of pure Cedrus deodara forest. Overall total 32 plots were taken from the forest. The size of each plot was taken 0.1ha. The shape of sample plot was square (Dimension 33×33 m2). Coordinates and eleva- tion (m) of each plot was determined by GPS.
For the estimation of stem volume (m3 ha-1), height of tree (m) and tree diameter (cm) at DBH was measured. The height of tree was calculated by Abneys level. The diameter (cm) of tree was measured by Caliper. The following formula was used to find out stem volume (m3 ha-1) (Adnan et al., 2014).
V (m3 ha-1) = AH×FF where
V= stem Volume(m3 ha-1),
H= Height of tree in meter
A= Cross-sectional area at BH point. And
FF= form factor
The stem biomass (t ha-1) was calculated from the relationship of stem volume (m3 ha-1), and basic wood density (kg m-3). . The value of Basic wood density (BWD) was sourced from available literature (Haripriya, 2000; Adnan et al., 2014). The follow- ing formula was used to estimate stem biomass (t ha-1).
Stem biomass (t ha-1) = Stem volume (m3 ha-1) × Basic wood density ( kg m-3)/ 1000
The total tree biomass (t ha-1) was obtained from the relationship of stem biomass (t ha-1) and biomass expansion factor. The Biomass expansion factor (BEF) was taken 1.51. That has been used by various authors (Haripriya, 2000; Adnan et al. 2014 and Adnan and Nizami, 2014) for total tree biomass calculation. Total tree biomass was calculated using below formula.
Total tree biomass (t ha-1) = Stem biomass (t ha-1) × Biomass expansion factor (BEF).
The total carbon stock was calculated by using conversion factor of 0.5. This conversion factor was multiplied with total bi- omass (t ha-1) and total carbon stocks (t ha-1) were estimated. This conversion factor has been used globally by. (Roy et al., 2001; Brown and Lugo, 1982; Malhi et al., 2004 and Nizami, 2012; Adnan et al., 2014). The following formula was used to calculate TCS (t ha-1).
Total carbon stock (t ha-1) = Total biomass (t ha-1) × Conversion factor (CF).
Statistical software’s like Past, Sigma plot version 10 and Ms Exile was used for statistical analysis.
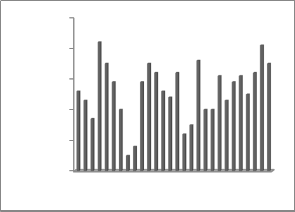
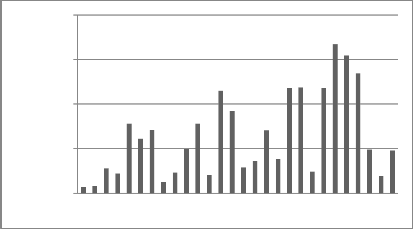
Stem density is the number of trees per hectare. . In present study the average stem density of pure Cedrus deodara forest was recorded 238 trees ha-1. The maximum density of pure Cedrus deodara forest was 370 trees ha-1. Details of stem density ha-1 are given in figure no 1.
IJSER © 2015 http://www.ijser.org
International Journal of Scientific & Engineering Research, Volume 6, Issue 4, April-2015 1148
ISSN 2229-5518
500
400
300
200
100
0
1 4 7 10 13 16 19 22 25 28
5000
4000
3000
2000
1000
0
1 3 5 7 9 11 13 15 17 19 21 23 25 27
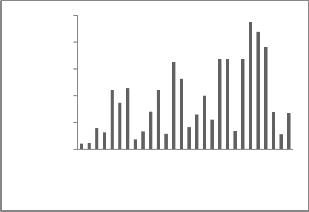
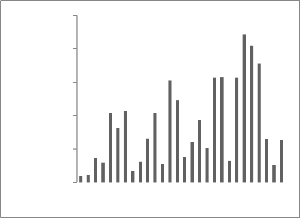
Total tree biomass was measured from stem biomass and BEF. In present study the mean stem volume was 1839.41 m3 ha-1. A detail of stem volume is given in figure no 2. Stem biomass was measured from the value of calculated stem volume and Basic wood density. The mean stem biomass was 857.40 t ha-1. Plot wise details of stem biomass t ha-1 are given in figure no 3
2500
2000
1500
1000
500
0
4000
3500
3000
2500
2000
1500
1000
500
0
.
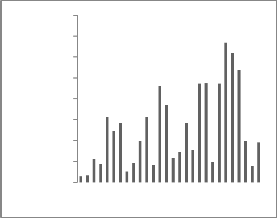
The average total tree biomass in pure Cedrus deodara forest was 1281.26 t ha-1.The maximum total tree biomass was
3344.03 (t ha-1) while minimum total tree biomass was 143.04 (t ha-1) respectively. Details of Plot wise total tree biomass (t ha-1) in
figure no.4
The total carbon is determined from total biomass multiply with conversion factor 0.5. This conversion factor have been globally used for the estimation of carbon stock from the biomass (Adnan et al., 2014; Nizami, 2012 ). Details of carbon stock (t ha-1) are given in figure no 5. The details showed that the mean carbon stock in the Pure Cedrus deodara forest is 640.63 t C ha-1. In study area the Pure Cedrus deodara forest comprise of old and large diameter trees. Most of the tree in study site consist of ma- ture and over mature. This result a high value of carbon stock.
IJSER © 2015 http://www.ijser.org
International Journal of Scientific & Engineering Research, Volume 6, Issue 4, April-2015 1149
ISSN 2229-5518
2000
1500
1000
500
0
Adnan Ahmad., S.N. Mirza and S.M. Nizami .2014. Assessment of Biomass and Carbon Stock In The Coniferous Forest Of Dir
Kohistan KPK. Pak. J. Agri Sci., 51(2) 345-350.
Ahmad, A., & Nizami. S.M . 2014. Carbon stocks of different land uses in the Kumrat Valley, Hindu Kush Region of Pakistan .
2014. J. of Forestry Research. ODI. 0.1007/s11676-014-0552-0
Anderson; J.M and J.S.I. Ingram. 1993. Tropical soil fertility: A hand book of methods, CAB; Wallingford U.K. 68-7pp.
Boisvenue, C. & Running, S. W. 2006: Impacts of climate change on natural forest productivity – evidence since the middle of the
20th century. Global Change Biology 12: 862–882.
Brown, S. and A.E. lugo. 1984. Biomass of tropical forests: A new estimate based on forest volumes. J. for. Sci; 22(3):1290-1293. Eugen Rusu.2013. The Current Situation of the Stock Of Carbon In Forest Ecosystems At Regional And Global. Present Envi- ronment And Sustainable Development, Vol. 7, No. 1, Page 100.
Houghton., 2005.above ground forest biomass and the global carbon balance in the global change biology.vol 11.pp 945-95
Intergovernmental Panel on Climate Change [Houghton, J.T., Y. Ding, D.J. Griggs, M. Noguer, P.J. van der Linden, X. Dai, K.
IPCC, 2001:Climate Change 2001: The Scientific Basis. Contribution of Working Group I to the Third Assessment Report of the IPCC, Climate Change 2001: The Scientific Basis. Contribution of Working Group I to the Third Assessment Report of the IPCC,Cambridge University Press, Cambridge, 2001
Kyoto, 1997.KyotoProtocol to UN Framework Convention on climate change.UN, New York, USA
Leadership for environment and development (LEAD). 2008. Pakistan’s option for climate mitigation and adaptation.
Malhi, Y, T. R. baker, O. L Phillips, S.Almeida, E.Alvarez, L. Arroyo, J. Chave,C.I Czimczikl, A. D. Fiore, N. higuchi, T. J. Killeen, S.G. Laurance, W.F.Laurance, S. L. Lewis, L. M. M. Montoya, A. Monteaguda, D.A. Neill, P. Nunez Vargas, O.S Patin, N. C. A Pitman, C.A. Quesada. J. N. M. Silva, Lezama, R. V. Martinez, J. Terborgh, B. Vinceti and J. Lloyd. 2004.The above-groundcoarse wood productivity of 104 Neotropical forest plots. Glob. Change Biol; 10: 563-591.
Milne R., Brown T.A., Carbon in the vegetation and soils of Great Britain, J.
Nizami, S.M.2012.The inventory of the carbon stocks in sub trophical forests of Pakistan for reporting under Kyoto protocol.
Journal of Forestry Research., 23(3):377-384
IJSER © 2015 http://www.ijser.org
International Journal of Scientific & Engineering Research, Volume 6, Issue 4, April-2015 1150
ISSN 2229-5518
Rayment, G. E. and F. R. Higginson. 1992. Australian Laboratory Hand book Siol and Water Chemical Methods-Australian Soil and land survey Handbook Inkata Prees, Melbourne & Sydney.
Richard G. Newell, Robert N. Stavins., 2000. “Climate Change and Forest Sinks: Factors Affecting the Costs of Carbon Sequestra- tion” Journal of Environmental Economics and Management., 40,211-235
Roy, J; B. Saugier and H> A. mooney. 2001. Terrestrial global productivity. Academic, San Diego.
Sharma, C. M., N. P. Baduni, S. K. Ghildyal and S. Suyal. 2010. Tree diversity and carbon stocks of some major forest types of
Garhwal Himalaya, India. Forest Ecology and management., 260:2170-2179
Sheikh, M.I.1993.Trees of Pakistan.page no.51
UNFCCC. 2001. Kyoto Protocol. http//www.unfccc.de/resource/protint.html.
Upadhyay,T.P., P.L.Sankhayan and B.Solberg.2005.A review of carbon sequestration dynamic in the Himalayan region as a function of land use change and forest/soil degradation with special reference to Nepal. Agriculture ecosystem and environ- ment, 105:449-465
IJSER © 2015 http://www.ijser.org
International Journal of Scientific & Engineering Research, Volume 6, Issue 4, April-2015 1151
ISSN 2229-5518
IJSER © 2015 http://www.ijser.org