International Journal of Scientific & Engineering Research, Volume 4, Issue 7, July-2013 2096
ISSN 2229-5518
IJSER © 2013 http://www.ijser.org
International Journal of Scientific & Engineering Research, Volume 4, Issue 7, July-2013 2097
ISSN 2229-5518
ABSTRACT
Sales promotion is an important component of any organization’s overall marketing strategies alongside advertising, public relations, and personal selling. The success of modern business largely depends on the functions of sales promotion . Sales promotion consists of a diverse collection of incentive tools, mostly short term, designed to stimulate quicker and /or greater purchase of particular products/services by consumers or the trade.
Sales promotion department becomes more important as there exist a buyers’ market in place of a seller’s market. This paper examines sales promotion and its impact and outcome on organizational effectiveness in footwear market. Paper focuses on how sales promotion in grass root level is used to generate higher sales, increased profitability and greater market share. The study focuses on sales promotional tools to generate its effectiveness.. The paper contributes to new knowledge by filling and reducing the gap that exist in the understanding of sales promotion by management and other stakeholders in the shoes manufacturing sector. It also serves as source
of references to other researchers in this field.
IJSER © 2013 http://www.ijser.org
International Journal of Scientific & Engineering Research, Volume 4, Issue 7, July-2013 2098
ISSN 2229-5518
INTRODUCTION
The Indian footwear industry is experiencing a major shift in its shape and structure. The established players in the industry are taking a hard look at their portfolio of products and are in the process of reshuffling them to meet the expectations of customers. The beneficiary is of course the consumer, who has an increased array of products to choose from.
The last four-five years have brought about a great change in the consumer preferences for footwear. The market leaders of yesteryears are being driven to maintain their leadership position in the forthcoming years. Those who have had a great going in the last few years are fighting hard to retain their new supremacy. The footwear industry is perhaps the most happening place in terms of new designs launched, upgraded products and innovative marketing techniques. Gone are the days of regulation when the production was limited to few brands. Today the Indian footwear market is highly competitive with numerous players who offer anything and everything a consumer demands and that too at affordable price. You can just walk into any showroom and take out the footwear of your choice, the market of footwear in India has come a long way. But this is only the beginning of the transformation.
Sales promotion is a specific item amongst your marketing instruments. Not to be confused with the positioning you choose within your marketing strategy. Sales promotion has always something temporary in it. You make special actions, special offers to push your sales over a certain period. If these actions loose their temporary character, they then become part of your marketing strategy. In this paper we present some examples of these actions and offers. We also consider the role of overhead publicity as a sales promotion tool.
IJSER © 2013 http://www.ijser.org
International Journal of Scientific & Engineering Research, Volume 4, Issue 7, July-2013 2099
ISSN 2229-5518
The relationship between sales promotion and organization effectiveness is controversial. The nature of the impact is inconclusive. While some authors believed that the impact of sales promotion on organization effectiveness is minimal and non-significant (Dekimpe, Hanssens and Silva-Risso 1999; Pauwels et al. 2002; Srinivasan et al. 2000), others believe that the impact is high and significant (Boddewyn and Leardi; 1989; Odunlami and Ogunsiji, 2011). Organization effectiveness in this study is defined by higher sales volume and profitability. Some of the recent studies include Pauwels et al. (2002) which examined the permanent impact of sales promotion on accumulative annual sales for the two product categories which include storable and perishable products. Their findings show that perishable and storable product categories lack permanent effects of sales promotion. Furthermore it is revealed that effects of sales promotion are short lived and persist only on average 2 weeks and at most eight weeks for both
This study examines sales promotion and its impact and outcome on organizational effectiveness in footwear industry. The study focuses on how sales promotion is used to generate higher sales, increased profitability and greater market share. The study focuses on the opinion of general public and customers about sales promotional campaigns which are being used by footwear brands. Sales promotion is an important component of any organization’s overall marketing strategies alongside advertising, public relations, and personal selling. The study contributes to new knowledge by filling and reducing the gap that exist in the understanding of sales promotion by management and other stakeholders in the manufacturing sector. It also serves as source of references to other researchers in this field. A descriptive survey research design was applied to describe sale promotion in the target area activities of the organization.
a. To study and analyse the impact of sales promotion programmes on customers.
b. To find out the outcomes of promotional campaigns and relevant impact in the mind of customer purchasing behavior and to identify need for changes in promotional strategies.
IJSER © 2013 http://www.ijser.org
International Journal of Scientific & Engineering Research, Volume 4, Issue 7, July-2013 2100
ISSN 2229-5518
There is no significant difference in the opinion of the respondents regarding impact of sales promotion.
There is no significant association in the respondents’s opinion regarding outcomes of promotional campaigns.
Research design:
A survey based, descriptive study was carried out at the district level. A few areas of nearby region have also been studied for the better understanding of the subject and stating the objectivity of the study. After thorough and meaningful formulation of the problem specified objectives were decided to provide the basis for field inquiry.
In order to reach to conclusion of the research objective a questionnaire was developed whose reliability and validity were evaluated. To provide the scientific basis of the study, a proper hypothetical framework was also developed which provided a definite direction and specific scope to the whole investigation.
Selection of respondents:
To carry out the present research 180 respondents were selected randomly on the basis of convenience and availability. While selecting the respondents utmost care has been taken to include all categories of the respondents from the areas taken into consideration.
Validity:
The prepared questionnaire was sent to five experts for their opinion. All the experts reported that the questionnaire is valid for getting the required information. Further item wise analysis has been done to attain the valid conclusions, for this factor analysis was carried out and thus final findings have been determined.
Reliability:
IJSER © 2013 http://www.ijser.org
International Journal of Scientific & Engineering Research, Volume 4, Issue 7, July-2013 2101
ISSN 2229-5518
Reliability of the questionnaire was calculated by using the Sphereman Split half correlation method on 20 respondents (10 Male, 10 Female) and coefficient of correlation was obtained
0.7932 which shows the questionnaire is reliable.
Variables:
Following independent and dependent variables were identified for the purpose of present study
Independent Variables
Following Independent variables were selected for the purpose of present study:
1. Age 2. Gender 3. Education 4. Occupation 5. Area/locality.6. Income.
Dependent Variables
Following variables were selected as Dependent variables for the purpose of present study:
1. Impact 2. Outcome
A questionnaire was developed and after checking of its reliability and validity it was administered amongst the randomly selected 180 respondents .For the present study both qualitative and quantitative data had been collected. Further to find out the results, variable wise analysis of items categorized for Impact and outcome were made.
Table 1: Distribution of respondents according to age.
Age in years | Respondents No. % | |
15-20 | 11 | 6.11 |
20-25 | 67 | 37.22 |
25-30 | 46 | 25.56 |
30-35 | 46 | 25.56 |
35-40 | 10 | 5.55 |
IJSER © 2013 http://www.ijser.org
International Journal of Scientific & Engineering Research, Volume 4, Issue 7, July-2013 2102
![]()
ISSN 2229-5518
Total 180 100.00
Mean 26.37
S.D. 5.53
Above table shows the distribution of respondents according to age. Highest number of respondents 67 (37.22%) were found in 20-25 years category and minimum number of respondents selected were 10 (5.55%) in 35-40 years category while second highest number of respondents were 46 (25.56%) in 25-30 years & in 30-35 years category , only 11 (6.11%) were
found in 15-20 years category.
70 67
60
50
40
30
20
11
10 6.11
0
37.22
46 46
25.56 25.56
10
5.55
No.
%
15-20 20-25
25-30 30-35
35-40
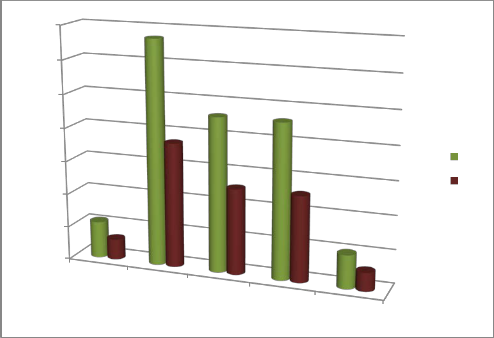
Chart 1:- Distribution of the respondents according to Age.
IJSER © 2013 http://www.ijser.org
International Journal of Scientific & Engineering Research, Volume 4, Issue 7, July-2013 2103
ISSN 2229-5518
Table 2: Distribution of respondents according to gender.
Gender | Respondents No. % | |
Male | 162 | 90.00 |
Female | 18 | 10.00 |
Total | 180 | 100.00 |
Above table shows the distribution of respondents according to gender. Highest no. of respondents 162 (90%) were Male and minimum no. of respondents selected were Female 18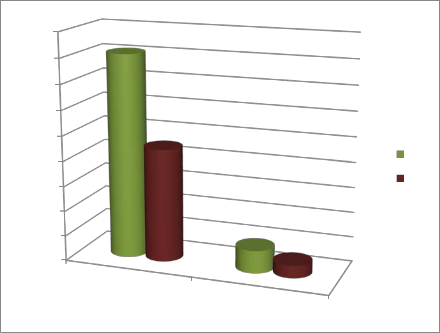
(10%).
180
160
140
120
100
80
60
40
20
0
162
90
18
10
No.
%
MALE
FEMALE
IJSER © 2013 http://www.ijser.org
International Journal of Scientific & Engineering Research, Volume 4, Issue 7, July-2013 2104
ISSN 2229-5518
Chart 2 :- Distribution of the respondents according to Gender.
All questionnaires were collected, detailed master chart were prepared and data was organized in the form of code sheets for computation and further analysis. This data gathered in the form of code sheets was edited checked and organized for the final statistical testing and for the analysis purpose. The data was finally presented in tabular forms to reach the conclusions.
The collected data were coded, tabulated and analyzed using various statistical techniques. The statistical tests were used to know the relationship between dependent and independent variables among the various groups of study selected respondents. Both descriptive and inferential statistical techniques were used. The significance level was used as 5 percent and 1 percent for rejecting the hypothesis. Tests used for the purpose are Percentage, Arithmetic Mean, SD, Chi- Square test etc. as and where required.
Table 3: Correlation between outcome and impact.
Parameter | Statistical value | ||||
Mean (26.37) | S.D. (5.53) | r | t | p | |
Outcome | 21.28 | 4.76 | -0.111 | 1.490 | > 0.05 |
Impact | 20.14 | 4.27 | -0.054 | 0.722 | > 0.05 |
IJSER © 2013 http://www.ijser.org
International Journal of Scientific & Engineering Research, Volume 4, Issue 7, July-2013 2105
ISSN 2229-5518
Above table reveals the correlation between outcome and impact of the respondents. Negative and insignificant correlation were observed between impact (r = -0.054, t=0.722, p>0.05) and outcome (r = -0.111, t=1.490, p>0.05) of the respondents.
Table 4: Correlation between outcome and impact with age of the respondents.
Parameter | Statistical value | ||||
Age | Mean (26.37) | S.D. (5.53) | r | t | p |
Outcome | 21.28 | 4.76 | -0.111 | 1.490 | > 0.05 |
Impact | 20.14 | 4.27 | -0.054 | 0.722 | > 0.05 |
Above table reveals the correlation between impact and outcome with age of the respondents. Negative and insignificant correlation were observed between impact with age (r = -
0.054, t=0.722, p>0.05) and outcome with age (r = -0.111, t=1.490, p>0.05) of the respondents.
Table 5 : Reason of selecting footwear.
Responses | Respondents No. % | |
Brand Value | 63 | 35.00 |
Promotional offers | 54 | 30.00 |
Service networks | 36 | 20.00 |
Don’t know | 27 | 15.00 |
IJSER © 2013 http://www.ijser.org
International Journal of Scientific & Engineering Research, Volume 4, Issue 7, July-2013 2106
![]()
ISSN 2229-5518
Total 180 100.00
X2=9.318, df=3, p<0.05
Above table shows the opinion of the respondents regarding the reason of selecting footwear. Majority of respondents 63 (35%) answered Brand Value was the reason, second highest 54 (30%) of the respondents given the reason Promotional offers while least 27 (15%) respondents responded as Don’t know. Service networks 36 (20%) was another noticeable response.
Statistically, Significant deference in the opinion of the respondents p <0.05 was observed among the respondents regarding the reason of buying Hero Honda Product hence hypothesis Ho2 rejected and difference observed.
BRAND VALUE
27
63 PROMOTIONAL OFFERS
36
SERVICE
NETWORKS
DON'T KNOW
54
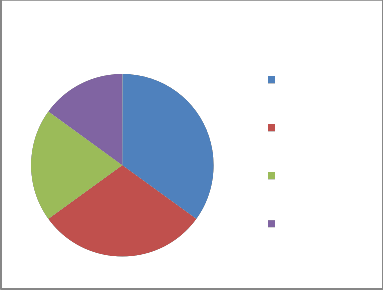
Chart 3: Reason of selecting footwear.
Table 6 : Opinion regarding Impact of sales promotion.
IJSER © 2013 http://www.ijser.org
International Journal of Scientific & Engineering Research, Volume 4, Issue 7, July-2013 2107
ISSN 2229-5518
Responses | Respondents No. % | |
Strongly agree | 36 | 20.00 |
Agree | 63 | 35.00 |
Neutral | 18 | 10.00 |
Disagree | 54 | 30.00 |
Strongly disagree | 9 | 5.00 |
Total | 180 | 100.00 |
X2=33.164, df=4, p< 0.05
Table reveals that maximum number 63 (35%) of the respondents are agree that there is positive impact of the sales promotion. This was also supported by 36 (20%) respondents as they were strongly agreed. Overall majority is in the support of this. While, only 54 (30%) respondents were disagree while 9 (5%) respondents were strongly disagree with the same.
Statistically, significant difference regarding the need of company sales executive reach and meet people personally was observed among the respondents (X2=33.164, df =4, p < 0.05) hence hypothesis Ho1 rejected and difference observed.
IJSER © 2013 http://www.ijser.org
International Journal of Scientific & Engineering Research, Volume 4, Issue 7, July-2013 2108
ISSN 2229-5518
9
36
54
18 63
STRONGLY AGREE AGREE
NEUTRAL DISAGREE
STRONGLY DISAGREE
Chart 4 : Opinion in No. regarding Impact of Sales promotion.
5 STRONGLY AGREE
20
AGREE
30
NEUTRAL
DISAGREE
35
10 STRONGLY DISAGREE
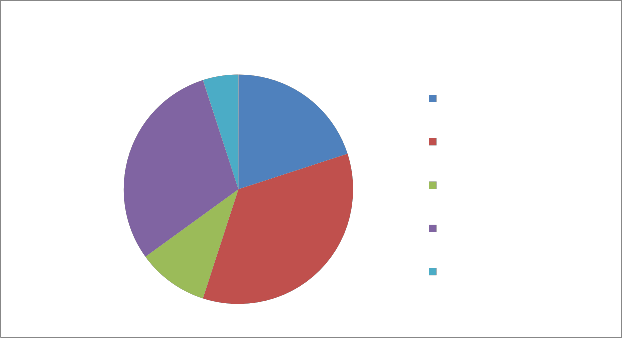
Chart 5 : Opinion in Percentage regarding impact of Sales promotion.
IJSER © 2013 http://www.ijser.org
International Journal of Scientific & Engineering Research, Volume 4, Issue 7, July-2013 2109
ISSN 2229-5518
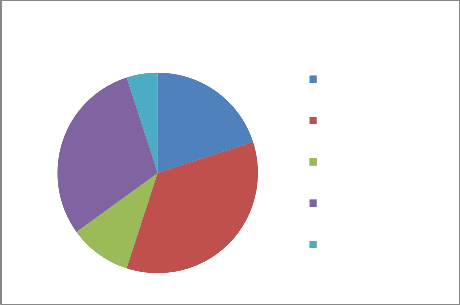
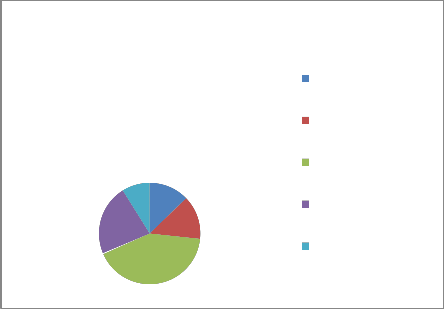
Table 7: Respondents opinion regarding outcomes of promotional campaigns.
Responses | Respondents No. % | |
Strongly agree | 23 | 12.78 |
Agree | 25 | 13.89 |
Neutral | 75 | 41.67 |
Disagree | 41 | 22.78 |
Strongly disagree | 16 | 8.89 |
Total | 180 | 100.00 |
X2=26.568, df=4, p<0.05
Responses of the respondents regarding promotional campaign were recorded and presented in the above table. Majority of respondents 75 (41.67%) were Neutral, second highest
41 (22.78%) of the respondents were Disagree while least 16 (8.89%) respondents responded as Strongly disagree. Agree 25 (13.89%) and strongly agree23 (12.78%) were other noticeable responses.
Statistically, significant difference in the opinion was observed among the respondents
(X2=26.568, df =4, p < 0.05) hence hypothesis Ho2 rejected and difference observed.
IJSER © 2013 http://www.ijser.org
International Journal of Scientific & Engineering Research, Volume 4, Issue 7, July-2013 2110
ISSN 2229-5518
STRONGLY AGREE
AGREE
NEUTRAL
16 23
41 25
75
DISAGREE
STRONGLY DISAGREE
Chart 6: Respondents opinion in No. regarding outcomes of promotional campaigns.
8.89
12.78
STRONGLY AGREE
AGREE
22.78
13.89
NEUTRAL
DISAGREE
41.67
STRONGLY DISAGREE
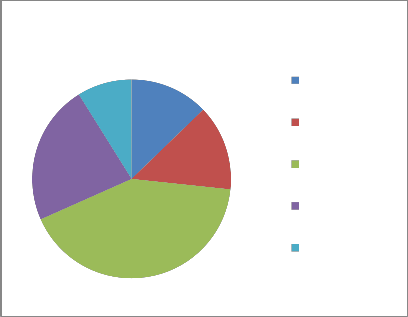
Chart 7: Respondents opinion in Percentage regarding outcomes of promotional campaigns.
IJSER © 2013 http://www.ijser.org
International Journal of Scientific & Engineering Research, Volume 4, Issue 7, July-2013 2111
ISSN 2229-5518
The findings of present study reveal that adoption of sales promotion strategies significantly influences the effectiveness of the sales. From the analysis of the data collected and interpretation of results, it is concluded that Sales promotion is normally used to boost sales thereby increasing the profit .According to the result, majority of the Respondents accepted the facts that promotion enhance consumer buying pattern.
The study is limited to the Promotional activities in footwear market of Agra. Therefore, the researcher has confronted with certain limitation in the study. The projected results may not be universal as only restricted sample field i.e. Agra was considered.
Statistical analyses are conducted on self-reported statements. Though respondents were assured of confidentiality and were requested to be frank in their response, chances of possible bias cannot be denied on account of the individuality of at least a limited number of respondents.
Arthur M. Merims, “Marketing’s Stepchild: Product Arthur Stern, “Measuring the Effectiveness of Package Goods Promotion Strategies,” paper presented to the Association of National Advertisers, Glen Cove, NY, February 1978.
Publicity,” Harvard Business Review, November – December 1972, pp. 111-12.
Bob Garfield, “Wondrous Chanel No. 5 Spot Deftly Nurtures the Product,” Advertising Age,
December 12, 1994, p. 3.
D.Chandra Bose, “Modern Marketing principle &practice”, page no. 104-112. 1st edition 2010, PHI learning Pvt. Ltd New Delhi.
Fairclough, N. Critical discourse analysis and the marketization of public discourse: The universities. Discourse & Society (1993) 4, 133-168.
Forrester, “Advertising,” p. 102.
Gray Armstrong, “Principle of marketing”,390, 12th edition, Pearson.
IJSER © 2013 http://www.ijser.org
International Journal of Scientific & Engineering Research, Volume 4, Issue 7, July-2013 2112
ISSN 2229-5518
Gary L. Lilien, Philip Kotler, and K. Sridhar Moorthy, Marketing Models (Englewood Cliffs, NJ: Prentice Hall, 1992), Chapter 6.
Hani I. Mesak, “An Aggregate Advertising Pulsing Model with Wearout Effects,” Marketing Science, Summer 1992, pp. 310-26; and Fred M. Feinberg, “Pulsing Policies for Aggregate Advertising Models,” Marketing Science, Summer 1992, pp. 221-34.
John C. Totten and Martin P. Block, Analyzing Sales Promotion, Text and Cases,2d ed. (Chicago: Dartnell, 1994), pp. 69-70.
John D. C. Little, “A Model of Adaptive Control of Promotional Spending,” Operations
Research, November 1966 pp. 1075-97.
Michael J.Etzel, “Marketing Concept & Cases”, 532-560,13th edition SIE publication “Marketing management”, Philip Kotler page.551-585,13th edition. Pearson.
Alfred A. Kuehn, “How Advertising Performance Depends on Other Marketing Factors,”
Journal of Advertising Research, March 1962, pp. 2-10.
Amber G. Rao and Peter B. Miller, “Advertising/Sales Response Function,” Journal of
Advertising Research, April 1975, pp. 7-15.
Indian journal of marketing,24. Dr.G.Sudarson Reddy July 2009.
Indian management Journal,56,topic:- Brand engagement in Feb 2010 by AIMA .
Kenneth R. Lord and Sanjay Putrevu, “Advertising and Publicity: An Information Processing
Perspective,” Journal of Economic Psychology, March 1993, pp. 57-84.
Robert George Brown, “Sales Response to Promotions and Advertising,” Journal of Advertising
Research, August 1974, pp. 33-39.
“Rough ride set to continue for Hero Honda” by parvathavardhinic, The Hindu Business line on
4-may-2011
“Hero Honda profit falls” in Business Today on 4-may -2011
IJSER © 2013 http://www.ijser.org
Internatio nal Journal of Scientific & Engineering Research, Volume 4, Issue 7, July-2013
ISSN 2229-5518
2113