International Journal of Scientific & Engineering Research, Volume 5, Issue 5, May-2014 63
ISSN 2229-5518
Conductor Size Selection Methods for Radial
Distribution Networks
Dr. Mahdi Mozaffari Legha1, Milad Askari Hashemabadi 2, Vajihe Sharifi Davarani 3, Ali Hoseinzadeh Ghasemabbad 4
Mohadeseh Sharifi Davarani 5, Ali Ghezelbash 6, Mohammad Mozaffari Legha7
Abstract. The availability of an adequate amount of electricity and its utilization is essential for the growth and development of the country. Development of distribution systems result in higher system losses and poor voltage regulation. Consequently, an efficient and effective distribution system has become more urgent and important. In this paper, we optimize an objective function to reduce the sum of capital cost and power loss cost and voltage deviation of radial distribution network of power simultaneously. This results in saving substantial amount of energy. To reduce our objective function, we find optimized type of conductor by taking use of Bacteria foraging algorithm (BFA) method and comparison with Imperialism Competitive Algorithm (ICA) Method. This computational method, iteratively improve a potential type of conductor with respect to a given measure of quality to reach to the optimized type of conductor. The back/forward sweep method is applied for load flow solution of proposed radial distribution system. The power loss reduction and voltage profile improvement has been successfully achieved which demonstrate the effectiveness of the proposed methods.
Keywords: Conductor Size, Imperialism Competitive Algorithm (ICA), Bacteria foraging algorithm (BFA), Radial Distribution
Networks, back/forward sweep, Voltage profile, Loss Reduction.
—————————— ——————————
1. INTRODUCTION
The close propinquity of distribution network to the consumers of electricity has made it a necessity to explore the area of practical planning of distribution system. Because of the growing effort to reduce system losses, many papers have been published in recent years referring to optimal distribution planning, but in all these attempts, its significant sub problems of optimal conductor size selection, optimal place of capacitors to obtain minimum possible loss, still need to be further studied. Some articles
————————————————
• Mahdi Mozaffari Legha, Assistant, Electrical & Electronic Institute, martyr Chamran Colleges, kerman, Technical and Vocational University, Iran (E-mail: Mahdi_mozaffari@ymail.com).
• Milad Askari Hashemabadi, Department of Electrical Engineering, Science and Research branch, Islamic Azad University, Kerman, Iran (E-mail: Milad.askari.65@gmail.com).
• Vajihe Sharifi Davarani, Department of mathematics, Rafsanjan Branch, Islamic Azad University, Rafsanjan, Iran (E-mail: Vajihe_sharifi@yahoo.com ).
• Ali Hoseinzadeh Ghasemabbad, Department psychology, Rafsanjan Branch, Islamic Azad University, Iran. (E-mail: Arefmobin74@yahoo.com).
• Mohadeseh Sharifi Davarani, Department Mathematics, Education Management, Rafsanjan, Iran. (E-mail: M.sharifi3832@yahoo.com).
• Ali Ghezelbash, Lecturer, Faculty of Engineering, University of
Jiroft, Jiroft, Iran. (E-mail: Teacher.ghezelbash@yahoo.com).
• Mohammad Mozaffari Legha, Department of Electrical & Electronic Engineering, Kerman branch, Islamic Azad University, Kerman, Iran (E-mail: Mozaffari50@gmail.com).
have been published dealing with optimal planning of distribution networks, in general have focused on reducing cost through optimizing the conductor profile, capacitor cost, and in some cases cost of losses. But in these all, increasing rate of load for future years is not considered. In addition, in most articles there is not any specialThe main objective of an electrical distribution system (EDS) is providing a reliable and cost-effective service to consumers with considering power quality within standard ranges. Thus, it is necessary to properly plan the EDS and thus evaluate several aspects such as, new equipment installation cost, equipment utilization rate, quality of service, reliability of the distribution system and loss minimization, considering an increase of system loads, and newly installed loads for the planning horizon [1]. There are several parameters to be taken into account to model the conductor size selection (CSS) problems such as: conductor’s economic life, discount rate, cable and installation costs and type of circuit (overhead or underground) [2,4]. Dynamic programming approach was utilized to solve the CSS problem in [3]. They presents models to represent feeder cost, energy loss and voltage regulation as a function of a conductor cross-section. In [4], the conductor size selection performed with consideration of financial and engineering criteria in the feeder. In [5] and [6] the CSS problem is solve using heuristic methods. Reference [5] uses a selection phase by means of economic criteria, followed by a technical selection using a sensitivity index that seeks to ensure a feasible operation of the EDS, whereas [6] presents a heuristic method using a novel sensitivity index for the reactive power injections. The heuristic methods are robust, easily applied; however, they
IJSER © 2014 http://www.ijser.org
International Journal of Scientific & Engineering Research, Volume 5, Issue 5, May-2014 64
ISSN 2229-5518
normally converge to a local optimum solution. In some
studies, a linear approximation in the calculation of power losses or voltage regulation is considered [7], while other approximates the load as a constant current model [3]. In [7], a mixed integer linear model for the problem of conductor selection size in radial distribution systems is presented. The imperialism competitive algorithm (ICA) method and comparison with PSO Method [2]. In this model, the behavior of the power type load is assumed to be constant. Several studies have used evaluative techniques to solve the CSS problem [8]–[10]. In [11] the optimal CSS placement is solved using a genetic algorithm.
In this paper, optimal type of conductor selection is proposed for planning radial distribution systems using Bacteria foraging algorithm (BFA) method and comparison with Imperialism Competitive Algorithm (ICA) Method. The objective is minimizing the overall cost of annual energy losses and depreciation on the cost of conductors and reliability in order to improve productivity with considering the maximum current carrying capacity and acceptable voltage levels. Moreover, we utilize the Backward-Forward sweep method which is simple, flexible, reliable, and didn't need Jacobian matrix and its inverse and have high convergence speed.
2. POWER FLOW ANALYSIS METHOD
The methods proposed for solving distribution power
flow analysis can be classified into two categories: Newton- Raphson (NR) method and Backward-Forward sweep method. The method proposed for solving distribution power flow analysis is Backward-Forward Sweep method which is an iterative means to solving the load flow equations of radial distribution systems which has two steps the Backward sweep, which updates currents using Kirchoff’s Current Law (KCL), and the Forward sweep, which updates voltage using voltage drop calculations [12].
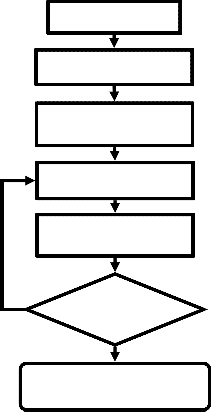
The Backward Sweep calculates the current injected into each branch as a function of the end node voltages. It performs a current summation while updating voltages. Bus voltages at the end nodes are initialized for the first iteration. Starting at the end buses, each branch is traversed toward the source bus updating the voltage and calculating the current injected into each bus. These calculated currents are stored and used in the subsequent Forward Sweep calculations. The calculated source voltage is used for mismatch calculation as the termination criteria by comparing it to the specified source voltage. The Forward Sweep calculates node voltages as a function of the currents injected into each bus. The Forward Sweep is a voltage drop calculation with the constraint that the source voltage used is the specified nominal voltage at the beginning of each forward sweep. The voltage is calculated at each bus, beginning at the source bus and traversing out to the end buses using the currents calculated in previous the Backward Sweep [12]. The Backward-Forward sweep Flowchart of the method depicted in Figure 1[1, 12].
Input Data
The model coefficients are computed once
Backward forward Sweep
load flow computation
Calculation of real and reactive power
Calculate the branch current of the bus and the
No Accuracy < ΔV
Yes
Calculate the branch current of the bus and the first bus
Figure 1: Flowchart of the Backward-Forward sweep method
3. OBJECTIVE FUNCTION
The objective is selection of conductor’s size from the
available size in each branch of the system which minimizes the sum of depreciation on capital investment and cost of energy losses and reliability while maintaining the voltages at different buses within the limits. In this case, the objective function with conductor j in branch i is written as
Min f(i,j)= w1*CE(i, j)+ w2*DCI (i, j) ( 1)
Subject to
Vmin≤|Vi|≤ Vmax i=1, 2,3,….,n (2)
|I l| ≤ Imax l= 1,2,3,....,n-1 (3)
In Equation (1) CE (i,j) is the Cost of Energy Losses
DCI (i,j) is Depreciation on Capital Investment of j conductor type of i-th branch, n is buss number, i is the branch number and w is the weighting factor[13]. In Equation (2) and (3), Vmin for any bus= 0.95 and Vmax for any bus= 1.05; Imax for any line is According to table1. The annual cost of loss in branch i with conductor type k is,
CE(i,c)=P L(i, j)* {KP+ KE *β*T} (4)
In Equation (4) Kp is annual demand cost due to Power
Loss ($/kW), KE is annual cost due to Energy Loss
($/kWh), β is Loss factor, ( PL (i,c) ) is real Power Loss of
branch i under peak load conditions with conductor type c
and T is the time period in hours (8760 hours). Depreciation on capital investment is given as
IJSER © 2014 http://www.ijser.org
International Journal of Scientific & Engineering Research, Volume 5, Issue 5, May-2014 65
ISSN 2229-5518
DCI(i,j)= α*A(j)*{Cj+Li} (5)
Where α is Interest and depreciation factor, Cj is cost of
type conductor ($/km), A(j) is cross-sectional area of j type
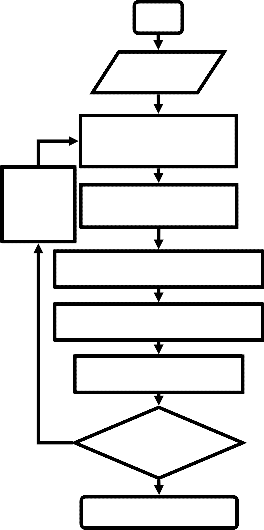
conductor and Li is length of branch i (km). The flow chart of proposed method is depicted in Figure 2.
Star
Input data
Optimization Parameters
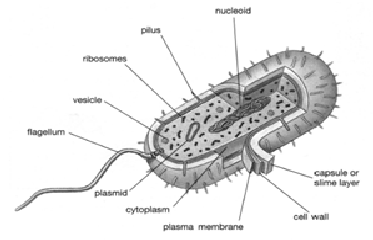
flagellum [21,22]. An E. coli bacterium alternates between running and tumbling. At down, the E. coli bacterium is is depicted in Figure 3. The flow chart of proposed method is depicted in Figure 4.
BFA
Operation
Conductor Selection
Figure 3: An E. coli Bacterium
Power Flow Calculation
Determination of Losses & Voltage
Fitness Evaluation
No Optimal
Solution Found?
Yes
Finish
Figure 2: Flowchart of the proposed BFA algorithm
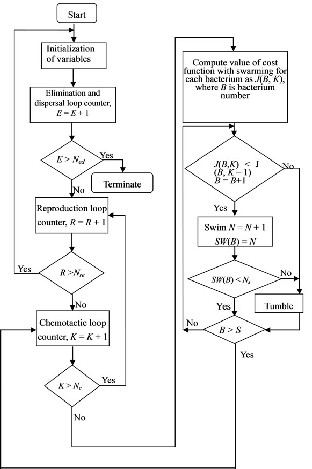
4. BACTERIAL FORAGING ALGORITHMS
Natural selection tends to eliminate animals with poor
foraging strategies and favor the propagation of genes of those animals that have successful foraging strategies[15]. The Escherichia coli (E. coli) bacteria that are present in our intestines, also undergo this foraging strategies. The social foraging behavior of E. coli bacteria has been used to solve optimization problems. The optimization in BFA comprises the following process: chemotaxis, swarming, reproduction, elimination and dispersal The chemotaxis is the activity that bacteria gathering to nutrient-rich area naturally. The characteristic of E. coli bacteria is: the diameter is 1µm, the length is 2µm, under appropriate conditions can reproduce (split) in 20 min. The move of the E. coli is done with
Figure 4: Flowchart of the proposed BFA algorithm
5. TESTS AND RESULTS
From the construction phase to the operational phase of
IJSER © 2014 http://www.ijser.org
International Journal of Scientific & Engineering Research, Volume 5, Issue 5, May-2014 66
ISSN 2229-5518
destruction are affected by a variety of each of these factors can cause the kind of damage such as wear and finally decided to enter the power network or utility side. Evaluation conductors of electrical distribution networks are a very important role in asset management systems. In this paper feeder conductors used in networks Kosar, Zafar substation, with 18.74 Km of the Kerman area Inclusive conductors such as Hayna (A=126 mm2), Doug (A=120 mm2) and Mink(A=70 mm2). The single line diagram for proposed radial distribution systems is shown in Figure 5. The properties of the new conductors used in the analysis of
this system are given in Table 1.The initial data for load flow solution based on the Backward-Forward sweep are selected as: VRbaseR= 20kV, and SRbaseR= 100kVA Vmin for any bus= 0.95 and Vmax for any bus= 1.05, loss factor is 0.2, which represents adequately the energy losses for the load level in terms of the maximum power losses are selected. The other parameters used in computation process are: KP =
1.04 ($/kW); KE = 0.012 ($/kWh) [2,4,6]. The conductor properties is in Table 1 also the conductor type is in Table 2.
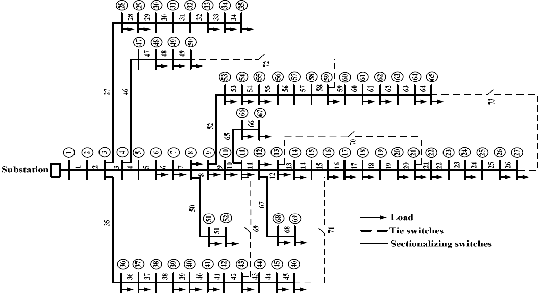
Figure 5: Single line diagram for a 69-bus radial distribution system
Table 1: Conductor properties
Type | R [Ω/km] | X [Ω/km] | Cmax [A] | A [mm2] | Cost [Toman/m] |
Hyena | 0.1576 | 0.2277 | 550 | 126 | 4075 |
Dog | 0.2712 | 0.2464 | 440 | 120 | 3500 |
Mink | 0.4545 | 0.2664 | 315 | 70 | 2125 |
Fox | 0.7822 | 0.2835 | 216 | 42.8 | 1765 |
Table 2: Conductor Type
No. | Conductor Type | No. | Conductor Type | No. | Conductor Type | No. | Conductor Type |
1 | Hyena | 18 | Hyena | 35 | Dog | 52 | Dog |
2 | Hyena | 19 | Hyena | 36 | Dog | 53 | Dog |
3 | Hyena | 20 | Hyena | 37 | Dog | 54 | Dog |
4 | Hyena | 21 | Mink | 38 | Mink | 55 | Dog |
5 | Hyena | 22 | Mink | 39 | Mink | 56 | Mink |
6 | Hyena | 23 | Mink | 40 | Mink | 57 | Mink |
7 | Hyena | 24 | Mink | 41 | Mink | 58 | Mink |
8 | Hyena | 25 | Dog | 42 | Mink | 59 | Mink |
9 | Hyena | 26 | Dog | 43 | Mink | 60 | Mink |
10 | Hyena | 27 | Dog | 44 | Mink | 61 | Mink |
IJSER © 2014 http://www.ijser.org
International Journal of Scientific & Engineering Research, Volume 5, Issue 5, May-2014 67
ISSN 2229-5518
11 | Hyena | 28 | Dog | 45 | Mink | 62 | Mink |
12 | Hyena | 29 | Dog | 46 | Mink | 63 | Mink |
13 | Hyena | 30 | Dog | 47 | Mink | 64 | Mink |
14 | Hyena | 31 | Dog | 48 | Mink | 65 | Mink |
15 | Hyena | 32 | Dog | 49 | Mink | 66 | Mink |
16 | Hyena | 33 | Dog | 50 | Mink | 67 | Mink |
17 | Hyena | 34 | Dog | 51 | Mink | 68 | Mink |
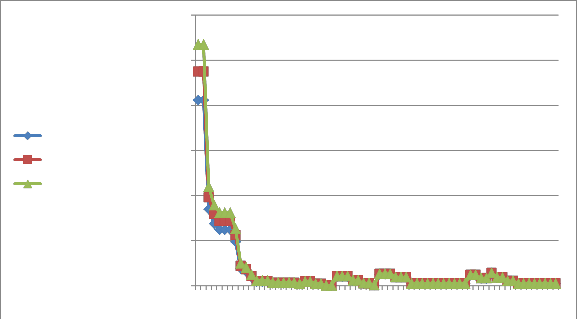
The results of conductor selection with BFA method is compared with ICA method and Conventional are shown in Table 3. The voltage profile in the system with BFA method is compared with ICA method and Conventional are shown in Figure 6. Also The power loss each branch in the system with BFA method is compared with ICA method and Conventional are shown in Figure 7. The real power loss reductions are 1.045 MW with BFA Method and real power loss reductions are 0.98 MW with ICA Method; which BFA method is approximately over the 42.5% in compare with the Conventional design. The total power loss of 69-bus system are shown in Figure 8 and Table 4.
Table 3: Conductor selection results
BFA Based ICA Based Conventional
1.005
1
0.995
0.99
0.985
0.98
0.975
0.97
0.965
0.96
0.955
1 4 7 10 13 16 19 22 25 28 31 34 37 40 43 46 49 52 55 58 61 64 67
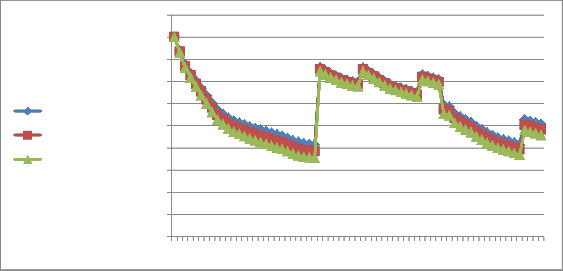
Figure 6: Voltage profiles of 69-bus system
IJSER © 2014 http://www.ijser.org
International Journal of Scientific & Engineering Research, Volume 5, Issue 5, May-2014 68
ISSN 2229-5518
12000000
10000000
8000000
BFA Based ICA Based Conventional
6000000
4000000
2000000
0
1 4 7 10 13 16 19 22 25 28 31 34 37 40 43 46 49 52 55 58 61 64 67
Figure 7: Peak power loss profiles in each branch
1000000
800000
600000
400000
200000
0
Conventional ICA Based BFA Based
Algorithms
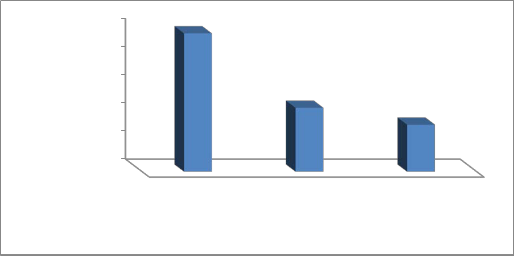
Figure 8: The total power loss of 69-bus system
Table 4 : Obtained Loss results of 69-bus system
Algorithm | Total Loss |
Conventional | 985555.65 |
ICA Based | 455225.65 |
BFA Based | 335265.65 |
6. CONCLUSION
Optimal selection of conductor type for planning radial
distribution systems using evolutionary approaches is presented with the objective to minimize the overall cost of annual energy losses and depreciation on the cost of conductors and reliability in order to improve productivity.
The power losses, voltage magnitude, and current flow magnitudes are calculated using the Backward-Forward sweep method.
The performance of the proposed evolutionary approaches (BFA) in comparison with a conventional and ICA method is investigated using a case studt of 69-bus radial distribution network. The power loss reduction and voltage profile improvement has been successfully achieved which demonstrate the effectiveness of the proposed approaches. The results offer potential of using BFA for improving plant productivity and economy.
REFERENCES
[1] M. Mozaffari Legha, (2011) Determination of exhaustion and junction of in distribution network and its loss maximum, due to geographical condition, MS.c Thesis. Islamic Azad University, Saveh Branch, Markazi Province, Iran.
IJSER © 2014 http://www.ijser.org
International Journal of Scientific & Engineering Research, Volume 5, Issue 5, May-2014 69
ISSN 2229-5518
[2] M. Sharafi, H. Samet, Abdollah Kavousifard, Mahdi Sharafi, Mohammad Reza Rahmati; ”Optimal Conductor Selection of Radial Distribution Networks Using PSO Method” CIRED Regional – Iran, Tehran, 13-14 Jan 2013; Paper No:12-E-500-
0317.
[3] M. Ponnavaikko and K. S. Prakasa, “An approach to optimal distribution system planning through conductor gradation,” IEEE Trans. Power App. Syst., vol. PAS-101, no. 6, pp. 1735–1742, Jun.
1982.
[4] Mahmood Joorabian, Ehsan Afzalan; “Optimal Selection of Conductors Using Colonial Selection Algorithm (CSA) for productivity Improvement Radial Distribution Systems,” 28th, Power System Conference - 2013 Tehran, Iran
[5] Z. Wang, H. L. Yu, X.Wang, and H. Song, “A practical approach to the conductor size selection in planning radial distribution systems,” IEEE Trans. Power Del., vol. 15, no. 1, pp.
350–354, Jan. 2000.
[6] M. Mozaffari Legha,; ”Optimal Conductor Selection of Radial Distribution Networks Using GA Method” CIRED Regional – Iran, Tehran, 13-14 Jan 2013; Paper No: 12-F-500-0320.
[7] M. J. Rider, M. Lavorato, R. Romero, “Optimal Conductor Size Selection and Reconductoring in Radial Distribution Systems Using a Mixed-Integer LP Approach”, Power Systems, IEEE Transactions on,(doi: 10.1109/TPWRS.2012.2201263),2012
[8] F. Mendoza, D. Requena, J. L. Bernal-Agustin, and J. A. Dominguez- Navarro, “Optimal conductor size selection in radial power distribution systems using evolutionary strategies,” in Proc. IEEE/PES Tranmission & Distribution 2006 Latin América, Venezuela, 15–18, 2006, pp. 01–05.
[9] R. Ranjan, A. Chaturvedi, P. S. Solanki, and D. Das, “Optimal conductor selection of radial distribution feeders using evolutionary programming,” in Proc. 2003 IEEE Region 10 Conf. Convergent Technologies for the Asia-Pacific (TENCON 2003), Bangalore, India, 15–17, 2003, vol. 1, pp. 456–459.
[10] R. S. Rao, “Optimal conductor selection for loss reduction in radial distribution systems using differential evolution,” Int. J. Eng. Sci. Technol., vol. 2, no. 7, pp. 2829–2838, Jul. 2010.
[11] M. Vahid, N. Manouchehr, S. D. Hossein, and A. Jamaleddin, “Combination of optimal conductor selection and capacitor placement in radial distribution systems for maximum loss reduction,” in Proc. 2009 IEEE Int. Conf. Industrial Technology, Gippsland, Australia, Feb. 10–13, 2009, pp. 01–05.
[12] N. Medina, M.M. Qi, L. Butler-Purry, K.L. A Three Phase
Load Flow Algorithm for Shipboard Power Systems (Sps), 2003.
[13] T. Gönen, Electric Power Distribution Systems Engineering. New York: McGraw-Hill, 1986.
[14] D.E. Goldberg, 'Genetic Algorithms in search, optimization and Machine learning.’’ Addison –Wesley, Reading M.A, 1989.
[15] E. Atashpaz-Gargari, C.Lucas, ’’Imperialist competitive algorithm: an algorithm for optimization inspired by imperialistic competition’’. IEEE CongrEvolComput 2007:4661–7.
[16] O. Amanifar, M.E. Hamedani Golshan, “Optimal Distributed Generation Placement and Sizing for Loss THD Reduction and Voltage Profile Improvement in Distribution Systems Using Particle Swarm Optimization and Sensitivity Analysis”, International Journal on Technical and Physical Problems of Engineering (IJTPE), Issue 7, Vol. 3, No. 2, pp. 47-53, March
2011.
[17] H.A. Shayanfar, H. Shayeghi, A. Jali, “Takagi Sugeno Fuzzy Parallel Distribution Compensation Based Three-Area LFC Design”, International Journal on Technical and Physical Problems of Engineering (IJTPE), Issue 8, Vol. 3, No. 3, pp. 55-64, September 2011
[18] G. J. Anders, M. Vainberg, D. J. Horrocks, S. M. Foty, J.Motlis, and J. Jarnicki, Parameters affecting economic selection of cable sizes,” IEEE Trans. Power Del., vol. 8, no. 4, pp. 1661–
1667, Oct. 1993.
[19] S. Mandal and A. Pahwa, “Optimal selection of conductors for distribution feeders,” IEEE Trans. Power Syst., vol. 17, no. 1, pp.
192–197, 2002.
[21] M. Tripathy and S. Mishra," Bacteria Foraging-Based Solution to Optimize Both Real Power Loss and Voltage Stability Limit", IEEE transaction on power systems, vol. 22, No. 1, FEBRUARY 2007
[22] Mishra, S., and Bhende, C. N, ''Bacterial Foraging Technique- Based Optimized Active Power Filter for Load Compensation'', IEEE transaction on power delivery, vol. 22, No. 1, JANUARY
2007
IJSER © 2014 http://www.ijser.org