1
International Journal of Scientific & Engineering Research, Volume 3, Issue 11, November-2012
ISSN 2229-5518
COMPARATIVE STUDY OF VARIOUS TECHNIQUES FOR ELIMINATION OF NOISE IN EMG SIGNAL
Jitendar Yadav, Arjun Singh, Mohit Kumar
Abstract— Electromyography (EMG) is the study of electrical activity of muscle and it form valuable information in the diagnosis of neuromuscular disorders. EMG signal may be degraded by a noise; it is in the baseline of EMG signal. It is called baseline fl uctuation of EMG signal. Baseline fluctuation distorts qualitative and quantitative analysis. The present work focus on various techniques and their comparative study for elimination of this kind of noise present in EMG signal. These techniques on real and simulated EMG signal gives their advantages and disadvantages in term of both visual inspection and merit figures. In present work, we use three methods to remove the noise present in the baseline of EMG signal named as Digital filter designing, statistical approach, moving average method. Segmentation of EMG signal is used in all these approaches and MATLAB is used as a software tool. We analyzed recording of EMG signal from the muscles in a healthy subjects at low force level, using concentric needle electrode.
Index Terms— Electromyography, EMG signal, Baseline fluctuation, bioelectric potential, segmentation
.
1 INTRODUCTION
—————————— ————————
waveforms and the degree of similarity in consecutive firings contain valuable information about the nature and state of a muscle. It helps to distinguish normal from
Electromyography (EMG) is the study of the electrical
activity of muscles, and forms a valuable aid in the diagnosis of neuromuscular disorders [10]. There are more than hundred neuromuscular disorders that affect the brain and spinal cord, nerves, or muscles. EMG examination studies the electrical activity of the muscle and forms a valuable neurophysiological test for the assessment of neuromuscular disorders.
In humans, clinical EMG provides useful information in the electro diagnostic examination of patients suffering from neuromuscular disorders. EMG is also particularly helpful in deciding the symptom of muscle weakness in the assessment of neuromuscular disorders. After lot of research and investigations, a large number of processes of the human body are still not fully understood
There are various new processing techniques for extracting quantitative information from the EMG signal in clinical electromyography. Although the EMG signal may be degraded by various problems. The major considerations are:
1. The signal to noise ratio of the detected
Signal.
2. The bandwidth of the signal
3. The muscle sample size, and
4. The susceptibility to crosstalk.
5. Baseline fluctuation
The motor unit action potential (MUAP) expresses the
electrical activity of the muscle fibers of a motor unit (MU)
recorded from a needle electrode. The shape of MUAP
pathological conditions and to measure the degree of abnormality [10]. MUAP analysis is thus a routine procedure in clinical electromyography (EMG). In the usual clinical procedure, different MUAP discharges (similar waveforms that supposedly correspond to different firings of the same MU) are extracted from the continuous electromyography record. Conventional electromyography presents a manual or automatic selection of several discharges from a MU, which are then aligned and averaged [11, 12], to form the MUAP waveform (typically a
50ms analysis window in which the MUAP main peak occupies the central position). After that, qualitative (visual- based) and quantitative (parameter-based) analysis are carried out. The quality of the EMG signal may be degraded by baseline oscillations, disturbing the processes of MUAP extraction, classification and analysis. An adequate cancellation of the BLF would enhance signal quality and accordingly make the processes described above easier and more reliable.
In ideal conditions (without any fluctuation, noise, and artifacts), the baseline (BL) would match the electrical zero of the equipment. But these noise free signals usually do not exist in real environment and a low frequency baseline fluctuation (BLF) can be observed.
This BLF present in the recorded signals (Fig. 1) is due
to artifacts of different nature such as movement of the
recording needle relative to the muscle, variation of skin
potential induced by the needle, and/or electrical drifts in
the acquisition equipment [4]. However, the main source of
BLF is the activity of distant MUs, which do not generate recognizable and well-defined MUAPs, and appear as a
2
International Journal of Scientific & Engineering Research, Volume 3, Issue 11, November-2012
ISSN 2229-5518
mild baseline wander.
EMG signals can be used for variety of applications like
clinical, biomedical and human machine interaction etc. The
EMG signal without the noise and BLF are required in all
above applications. But noise free signal does not exist in
real environment, or the quality of EMG signal may be
degraded by baseline fluctuation and low frequency noise, disturbing the process of MUAP extraction, classification
and analysis. So an adequate cancellation of BLF is required, which would enhance the signal quality and accordingly make the process easier and reliable and then it can be further used in various tasks.
The objective of the present work is to remove the BLF present in the EMG signal. In this thesis, three techniques are devised for removal of baseline fluctuation, which are discussed in next chapters.
EMG signals can be used for variety of applications like clinical, biomedical and human machine interaction etc. The EMG signal without the noise and BLF are required in all above applications. But noise free signal does not exist in real environment, or the quality of EMG signal may be degraded by baseline fluctuation and low frequency noise, disturbing the process of MUAP extraction, classification and analysis. So an adequate cancellation of BLF is required, which would enhance the signal quality and accordingly make the process easier and reliable and then it can be further used in various tasks.
The objective of the present work is to remove the BLF present in the EMG signal. In this thesis, three techniques are devised for removal of baseline fluctuation, which are discussed in next chapters.
2 MATERIAL USED
We analyzed recording of EMG signal from the muscles in a healthy subjects at low force level, using concentric needle electrode. The signal was analogue band pass filtered at 3
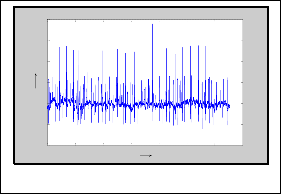
Hz to 10 KHz and sampled at 20 KHz. The EMG signal was then low pass filtered at 8 KHz and down sampled by a factor of two at 10 KHz. Recording equipment comprised an electromyography and disposable concentric needle electrodes. The electromyography amplifies the input signals according to a manually selected gain. An EMG signal with baseline fluctuation and low frequency noise is shown in Figure 4.1
400
300
200
100
0
-100
-200
0 0.5 1 1.5 2 2.5 3 3.5
1. METHODOLOGY
An adequate cancellation of baseline fluctuation would increase the quality of EMG signal and make the process of EMG analysis more efficient and easier. In the present work three methods are devised for removal of baseline fluctuation present in the EMG signal. The techniques or the methodology used for removal of baseline fluctuation are listed below.
1. Statistical technique
2. Digital filter design
3. Moving average method
Statistical technique used for removal of BLF is based on the threshold, which is calculated on the basis of mean absolute value of whole EMG signal, another method for removal of BLF is the designing of digital filter of specified cut-off frequency, so that low frequency oscillations present in the EMG signal would be filtered out. The last method is the moving average method, which can be used for BLF removal. There are various types of moving average methods such as: simple moving average, weighted moving average and Savitzky method, but in the present work simple Moving average method is used for removal of BLF.
. EMG signals can be used for variety of applications like clinical, biomedical application and human machine interaction etc. Therefore, the EMG signals without the noise and BLF are required. But noise free signal does not exist in real environment, or the quality of EMG signal may be degraded by baseline fluctuation and low frequency noise, disturbing the process of MUAP extraction, classification and analysis. Therefore, an adequate cancellation of BLF would enhance the signal quality and accordingly make the process easier and reliable and then it can be used in various tasks. In this thesis, three techniques are used for removal of baseline fluctuation, which is listed below.
1. Statistical technique based on threshold
2. Digital Filter designing for removal of BLF
3. Moving average method for removal of BLF
3.1 Statistical technique based on threshold
A very simplest technique for removal of baseline fluctuation is the statistical technique. The statistical approach can easily remove the low frequency oscillations presents in the baseline of EMG signal and thus it may enhance the quality of EMG signal. This technique is generally based on the threshold values, which can be calculated easily with the help of a simple algorithm. This
method is developed in three sequential steps, which are
Samples
Figure 1: Raw EMG signal.
4
x 10
listed below.
Calculation of threshold
Segmentation of EMG signal
3
International Journal of Scientific & Engineering Research, Volume 3, Issue 11, November-2012
ISSN 2229-5518
Removal of baseline signal
The sequential steps to be followed in the development of
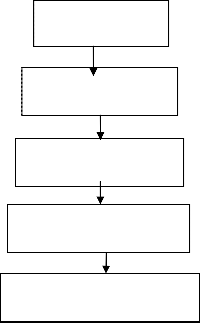
this technique for removal of baseline fluctuation present in the EMG signal are explained here and the flow chart of all these steps is shown in Figure 2.
RAW EMG SIGNAL
THRESHOLD CALCULATION
SEGMENTATION OF EMG SIGNAL
REMOVAL OF BLF
EMG SIGNAL WITHOUT BLF
Figure 2: Flow chart showing the sequence of steps.
Calculation of threshold
To characterize the BLF, MUAP free segments or the baseline segment (BLS) must be distinguished from MUAP segments of the EMG signal. The threshold plays an important role to do this job or it can be concluded that the threshold calculation is the most significant part in the removal of BLF of EMG signal in the statistical technique. It is used in the estimation of level of EMG activity, segmentation and classification of whole EMG signal. The value of threshold is calculated on the base of mean absolute value of each samples present in the EMG signal X (t).
A simple algorithm used for the calculation of threshold T
is given below:
If maximum X (t)>30* mean (abs X (t)) Then
Threshold = 5 * mean (abs X (t)) Else
Threshold =maximum X (t)/5
The value of threshold will be different for different EMG signal. Threshold can also be changed based on requirement by changing the above-explained algorithm.
Segmentation of AS and BLS
The process to cut the EMG signal into segment of possible MUAPs segment (active segment) and low activity areas or baseline segment (MUAPs free segment) is known as segmentation. Segmentation of EMG signal can be performed with the help of discrete wavelet transform (DWT) . The DWT decompose the EMG signal into active segment and baseline segment by using a defined algorithm, which is given in the Matlab toolbox. In the present work another approach is used, which is discussed here. In the present work segmentation is performed into two stages. In first stage AS are obtained and in second stage BLS are obtained. In the first step segmentation algorithm calculates the threshold, peaks over the calculated threshold are considered as candidate MUAPs. Now a window of constant width of 120 points is applied centered at the identified peak. If a greater peak is found in the window, the window is centered at the greater peak otherwise the 120 points are saved as a candidate MUAP waveform. In second stage to obtain the BLS of EMG signal, second threshold, named T1 is also calculated. In this step a windows of constant width of 30 points is taken and calculates T1, then selects the next window of 30 samples and calculate the value of T1 again. Thus the whole length of the EMG signal is divided into the window of 30 samples and threshold is calculated each time. The value of threshold is change for every next window. The threshold T1 is also calculated on the basis of mean absolute value of whole samples present in a window of 30 samples. Now the BLS is performed by the comparison of this threshold T1 with first threshold T, which has been calculated in last section. If threshold T1 is greater than the threshold T then the samples are again considered as the candidate of MUAPs waveform or we can say that these are the active, otherwise the segment is baseline segment. The value of second threshold T1 is calculated as:
T1=mean [abs(X (w))]
Where w is the size of window, the size of window can be changed based on the requirement of accuracy.
Removal of BLF
From the last section the segmentation of whole EMG signal has been achieved or the AS and BLS distinguished from the EMG signal. Now the removal of BLF present in the BLS of the EMG signal can be performed. In this step the AS of the EMG signal will remain same, only the correction is required in the BLS of the signal. The oscillations or disturbance present in the baseline segment of EMG signal are removed by subtracting the value of threshold T1 from the absolute value of the each samples present in the BLS of the first window of the size of 30 samples and then taken the next window and subtract the value of respective threshold T1 from the absolute value of each samples of this window. This sequential procedure is
4
International Journal of Scientific & Engineering Research, Volume 3, Issue 11, November-2012
ISSN 2229-5518
applied to the whole windows of BLS of the EMG signal.
After applying all the above procedure, a new BLS is
obtained, which is free from the BLF. Now the whole EMG signal with AS and BLS (with out BLF) is achieved. Then the EMG signal without BLF can be further used for required applications. In this way an adequate cancellation of BLF can be obtained, that can enhance the signal quality and accordingly make the process of extraction and analysis of EMG signal easier and reliable.
EMG signal without BLF
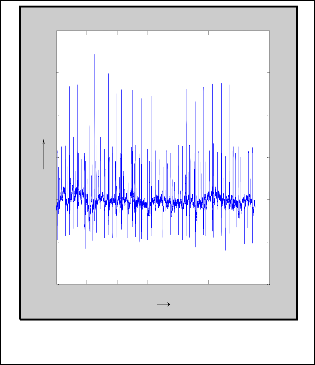
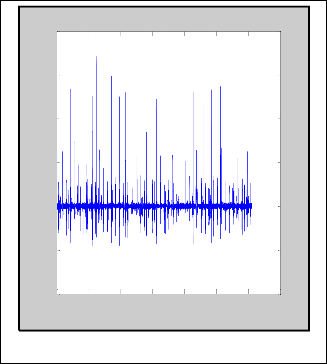
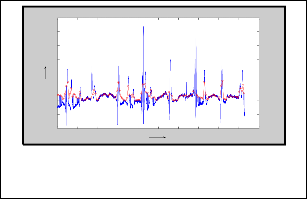
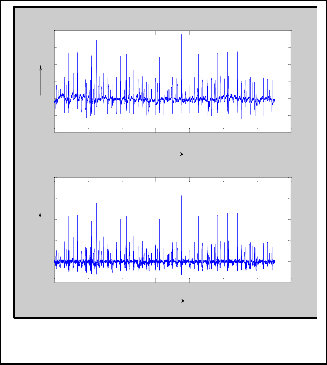
The EMG signal without BLF has been obtained by using the above explained sequential steps. Since the noise and oscillations free signals usually do not exist in real environment, but the low frequency baseline oscillations can be reduced, which has been discussed in the above section. From the above sequential steps it can be concluded that the AS of EMG signal will remain same throughout the whole process, all the techniques are applied only into the BLS. Then new BLS of the EMG signal without BLF and same AS are obtained. Now the EMG signal without BLF can be used for various tasks. The EMG signal with and without baseline fluctuation is shown in Figure 3(a) and Figure 3 (b), the flat baseline of the EMG signal can be easily observed from the Figure 3 (b).
400
300
200
100
0
-100
-200
0 0.5 1 1.5 2 2.5 3 3.5
4
x 10
Figure 3 (b): EMG signal without BLF.
400
300
200
100
0
-100
-200
0 0.5 1 1.5 2 2.5 3 3.5
3.2 Digital filter designing for removal of BLF Another approach for removal of baseline fluctuation present in the EMG signal is digital filter designing. This method of removal of BLF used various mathematical, statistical and digital signal-processing techniques. In this technique, an EMG signal passed through high pass IIR (Butterworth) filter for the removal of the oscillations or the fluctuations present in the baseline of EMG signal. The method devised for filtering out the BLF present in the EMG signal is comprised of five sequential steps. The detailed discussions of all the steps are given below.
Calculation of threshold
Segmentation of EMG signal
Interpolation of baseline points
Analysis of power density spectrum
Filter designing & filtering of raw EMG signal
Calculation of threshold
The very first step for removal of BLF is to characterize the
BLF, MUAP free segments or the baseline segment (BLS)
Samples
Figure 3 (a): EMG signal with BLF.
4
x 10
must be distinguished from the MUAP segments. The calculation of threshold is the most significant part in this work. It is used to find out the activity level of the EMG signal, classification and segmentation of whole EMG signal. The threshold T is calculated based on mean absolute value of the samples present in the whole EMG signal x (t), like the last section, which has been discussed.
5
International Journal of Scientific & Engineering Research, Volume 3, Issue 11, November-2012
ISSN 2229-5518
The value of threshold can also be varied, depending on the
requirement by changing the steps used in the algorithm.
The threshold is calculated as follows: If maximum x (t)>30* mean (abs x (t)) Then
Threshold = 5 * mean (abs x (t)) Else
Threshold =maximum x (t)/5
Segmentation of EMG signal
As discussed in the last approach, segmentation is the process to cut the EMG signal into the AS and BLS. The process of segmentation is same, which has been discussed in the last section. In the segmentation process first of all the threshold T is considered, which has been calculated in the last step depending on the maximum and mean value of whole EMG signal. In the present work segmentation is performed into two stages. In first stage AS are obtained and in second stage BLS are obtained. In the first stage segmentation algorithm calculates the threshold, peaks over the calculated threshold are considered as candidate MUAPs. Now a window of constant width of 120 points is
same fashion the whole BLS of the EMG signal are centered
with the peaks of respective threshold T1. After obtaining
these peaks the interpolation techniques are applied to all peaks of baseline segments. Interpolations are based on polynomial. In one dimensional interpolation each point has one independent variable and one dependent variable. On the other hand in two dimensional interpolations each point has two independent variables and one dependent variable. A more accurate interpolation can be obtained if instead of considering all the points in the data set (by using the polynomial that pass through all the points); only a few data points in the neighborhood where the interpolation is needed are considered. The cubic spline interpolation is used in the present work to obtain the smooth baseline segment.
300
250
200
150
100
50
applied centered at the identified peak. If a greater peak is found in the window, the window is centered at the greater peak otherwise the 120 points are saved as a candidate
0
-50
-100
0 500 1000 1500 2000 2500 3000 3500 4000 4500 5000
Samples
MUAP waveform. In second stage to perform the BLS of EMG signal, second threshold, named T1 is also calculated. In this step a windows of constant width of 30 points is taken and calculates T1, then selects the next window of 30 samples and calculate the value of T1 again. Thus the whole length of the EMG signal is divided into the window of 30 samples and threshold is calculated each time. The value of threshold is change for every next window. The threshold T1 is also calculated on the basis of mean absolute value of whole samples present in a window of 30 samples. Now the BLS is performed by the comparison of this threshold T1 with first threshold T, which has been calculated in last section. If threshold T1 is greater than the threshold T then the samples are again considered as the candidate of MUAPs waveform or we can say that these are the active, otherwise the segment is baseline segment. The value of second threshold T1 is calculated as:
T1=mean [abs(X (w))]
Where w is the size of window, the size of window can be changed on the basis of the requirement of accuracy.
Interpolation of baseline points
Interpolation is the process of estimation of values between the data points. In the present work interpolation is used to characterize the BLF spectral. From the last section the BLS and AS has been distinguished. The AS of the EMG signal will remain same in the whole process. Now a peak of the amplitude of threshold T1 is marked at the centre of the window of 30 samples in the BLS of the EMG signal. In the
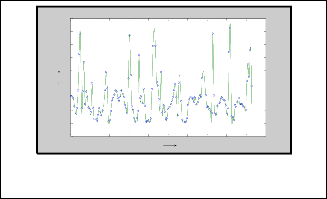
Figure 4 (a): Interpolation points.
80
70
60
50
40
30
20
10
0
-10
0 500 1000 1500 2000 2500 3000 3500 4000 4500 5000
Samples
Figure 4 (b): Interpolated BLS.
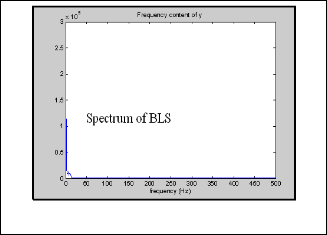
Analysis of power density spectrum
From the last section, the interpolated BLS of the EMG signal has been obtained. In this section, the power density spectrums of the interpolated baseline segments will be obtained to find out the frequency range of the baseline, so that the filter would be designed for the specified cut off frequency. There are various methods to estimate the frequency spectrum of baseline segment. AR spectral estimation can also be used on the interpolated signal to obtain a smooth and high resolution power
6
International Journal of Scientific & Engineering Research, Volume 3, Issue 11, November-2012
ISSN 2229-5518
spectral density. On the other hand discrete Fourier
transforms and Fast Fourier transform are also the
efficient and simplest methods of power density spectral analysis.
In the present work Fast Fourier transform is used to obtain the Power density spectrum of interpolated baseline segment. A simple algorithm of PSD analysis is given in Matlab, which is used in the present work. The PDS of the baseline segment obtained from the Fast Fourier transform is given below. From the above PSD analysis, the cut off frequency of the BLS is 15 Hz. Figure
for baseline fluctuation filtering. An EMG signal with and
without baseline fluctuation is shown in Figure 6.
400
300
200
100
0
-100
-200
0 0.5 1 1.5 2 2.5 3 3.5
5 shows the PDS of interpolated BLS of the EMG signal.
Samples
4
x 10
400
300
200
100
0
-100
-200
0 0.5 1 1.5 2 2.5 3 3.5
Samples
4
x 10
Figure 6: Original EMG signal and filtered BLF
Figure 5: PSD of BLS
Filter designing & filtering of EMG signal Finally, a high pass Butterworth filter of 3 db cut off frequency and the above obtained stop band of 15 Hz is designed. IIR Butterworth filter is used to do this work due to the mostly linear phase characteristic and maximally flat magnitude response. Most commonly used method named; bilinear transformation can be followed for designing the IIR Butterworth filter. To eliminate the BLF, the EMG signal is filtered out by the above designed high pass filter. The designed filter of the above specification cut the signal up to the frequency range of 15 Hz and passes the signal of the frequency above the 15 Hz. In this way low frequency BLF are filtered out from the EMG signal and the active segment of high frequency pass through the filter thus it will remain same throughout the whole filtering process. Almost linear phase characteristic of the Butterworth filter guarantees the preservation of MUAP shape as far as possible. As mentioned before, the BLF filtering method using FFT spectral estimation followed by high pass Butterworth filter is found to be the best approach
3.3 Moving average method for smooth of
BLS
In the present work, Moving average method is also discussed for removal of BLF present in the EMG signal. Moving average method is one of the simplest methods to do this work, because the algorithm used in this method is easier and smaller than other methods. In this method, one of the moving average techniques can be used such as, simple Moving average and Weighted moving average and Savitzky method. In the present work, simple moving average is used to filtering out the baseline oscillations. A direct function for smoothing a data of specified length is given in MATLAB, which can smooth the data easily. Moving average method devised for removal of baseline fluctuation present in the EMG signal is discussed below in four sequential steps:
Select the data: The data that we want to smooth is loaded
then specify the name of smoothed data set.
Select the smoothing methods: One of the smoothing methods such as moving average method, locally weighted method and Savitzky method can be used to perform the smoothing.
Select the span: The span (window) or the number of data points of the full length of data is selected, to compute each smoothed value. The processes of smoothing the original data set always produce a new data set containing new smoothed response value. For Moving average and
7
International Journal of Scientific & Engineering Research, Volume 3, Issue 11, November-2012
ISSN 2229-5518
Savitzky method, the span must be odd. For all weighted
method, if the span is less than one, it is interpreted as the
percentage of the total number of data points. By default the value of the span in Moving average method is five. Select the degree: select the degree of polynomial used in only Savitzky method. The degree must be smaller than span.
In the present work the simple moving average method is used for smoothing the EMG signal with the span of 150 points from the full length of EMG signal. As the span will small, the accuracy of smoothed data will be increased. If the span is greater than data length, then it is reduced by the length of data. There is no need to select the degree of polynomial in the present work, due to the use of Moving
Quantitative explanation is required to compare the
baseline removal methods. Baseline raises or lowers the
mean level of a potential or of a portion of a potential, so the degree of waveform variation in the discharge in a MUAP train is increased by BLF.
Two quantities (F and N) are devised to measure the degree of BLF [14]. They are calculated as follows.
1) All the single potential are manually selected and classified, by eye, on the basis of wave
Shape into several classes corresponding to different
MUAP trains.
2) For each MUAP train, the corresponding discharges are
time aligned so that Correlation between them is maximized.
average method. The EMG signal with BLF and smoothed
Let
Yk {yk (1), yk (2).............yk (nk )} be the
response of this signal (EMG signal without BLF) is given in
Figure 7.
discharge number k of the set of m discharges of a certain
MUAP train, where
yk (t)
is the t sample of Yk .
Discharge in
Yk are normalized dividing their samples
400
300
200
100
0
-100
-200
0 0.5 1 1.5 2 2.5 3 3.5
values by the maximum absolute value in the whole set. The two proposed quantities are defined below.
F S.Dk (meant (Y1)..................mean(Ym ))
(5.1)
First the temporal mean of every discharge is calculated;
then standard deviation of all these means is computed.
N meant (s.d k ( y1 (t).................ym (t)))
400
300
200
100
0
Samples
4
x 10
(5.2)
The standard deviation across different discharges is calculated for every sample time; the resulting set of values is then averaged.
Because of the above-mentioned normalization, F and N
values will be in the range 0-1.
F measures the variability of the mean of the different discharges pertaining to the same MU along the EMG
-100
0 0.5 1 1.5 2 2.5 3 3.5
signal. Ideally, if BLF were not present, and if all
Samples
4
x 10
discharges from the same MU were equal, F would be zero. When there is BLF, some discharges appear higher
Figure 7: RAW EMG signal and filtered EMG signal using
Moving average method
4. CONCLUSION
After going through all these techniques of the present work, it can be concluded that each technique has its own advantages and disadvantages. The performance of all above techniques can be classified based on complexity, quantity of BLF removal and preservation originality of the EMG signal, which is explained in the next chapter.
5. QUANTATIVE ANALYSIS
than others and the value of F increases accordingly.
On the other hand, N measures the variability of amplitude values of amplitude values of a MUAP waveform throughout a MUAP train. N will be zero if no BLF is present and the discharges do not differ from each other. However, if the BL fluctuates, the amplitude of MUAP samples will vary from one discharge to another and N will increase according to this variation.
Thus the degree of BLF cancellation provided by a given method on a certain EMG signal can be measured indirectly by looking at the decrement in the signal’s F and N values. BLF removal methods can be compared by direct computation of F and N parameters in the processed signal. For lower the F and N values, the lower
8
International Journal of Scientific & Engineering Research, Volume 3, Issue 11, November-2012
ISSN 2229-5518
the remaining BLF, and better the performance of method. The values of F and N are calculated here for all these three techniques.
Table 1 shows the values of F and N corresponding to three BLF removal methods.
Table 1 (a) Values of F and N of Raw EMG
signal
Table
1(b): Values
of F and N without BLF, using
MU3 0.017 0.1648

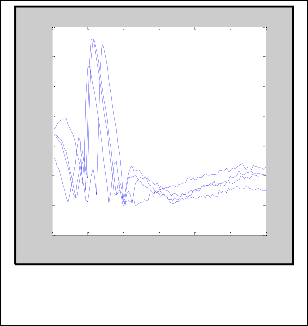
From the above tables, it can be easily shown that the reduction in the values of F and N is large in case of statistical approach as shown in Table (1 c). So, based on the value of F and N, it can be concluded that the statistical technique used for removal quantity of BLF provide the better performance in comparison of Moving average and digital filter design.
On the other hand, in case of Moving average the values of F and N are reduced significantly in comparison of digital filter design approach.
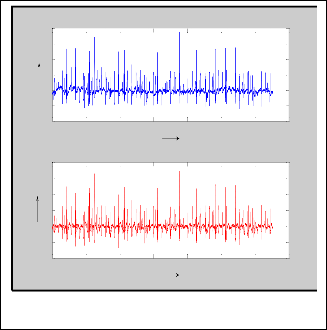
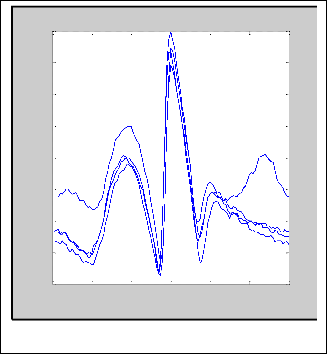
The value of F and N will be zero if no BLF is present and discharge do not differ will each other. However, if the BL fluctuates, the amplitude of MUAP samples will vary from one discharge to another and F, N will increase according to this variation. Both effects can be appreciated in Figure 8 for each technique, which shows a set of discharges of the
same MU before and after removal of BLF.
Digital filter
300
250
200
150
100
50
0
Table 1(c): Value of F and N without BLF, using statistical technique.
-50
-100
0 20 40 60 80 100 120
Figure 8 (a): Discharges of same MU of EMG signal with BLF.
Table 1(d): Value of F and N without BLF, using moving average technique.
MUs | Value of F for filtered EMG signal | Value of N for filtered EMG signal |
MU1 | 0.0196 | 0.1637 |
MU2 | 0.013 | 0.1539 |
9
International Journal of Scientific & Engineering Research, Volume 3, Issue 11, November-2012
ISSN 2229-5518
300
250
250
200
200
150
150
100
100 50
50 0
0 -50
-50
-100
0 20 40 60 80 100 120
-100
0 20 40 60 80 100 120
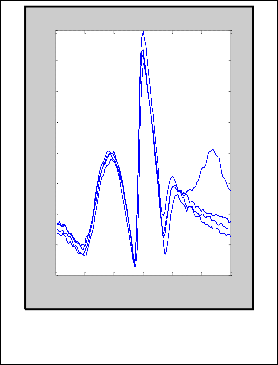
Fig 8 (d): Discharges of same MU of Filtered signal using
Moving average technique
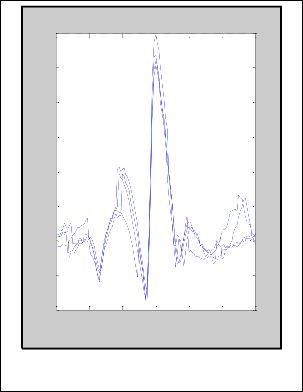
Fig 8 (b): Discharges of same MU of Filtered signal using digital filter.
300
250
200
150
100
50
0
-50
-100
0 20 40 60 80 100 120
The performance of all these three method can also be
classified based on three parameters names: BL removal quantity, complexity of the technique and change in the originality of signal. In the sense of complexity, the Moving average method is efficient as compare to other two methods, because the algorithm required in this approach is easier and smaller than other methods. In the sense of changes in the originality of signal, digital filter designing approach is efficient and reliable than others methods, which can be easily seen in the Figure 8 (b). At last based on the quantity of the removal of BLF, the statistical approach is descent one as compare to other methods.
6. CONCLUSION
The work presented in this thesis is the development of the techniques for removal of BLF presents in the EMG signal. Three techniques have been devised for removal of BLF named as statistical technique, digital filter designing and Moving average method. These makes use several signal processing, statistical and mathematical techniques in a
Fig 8 (c): Discharges of same MU of Filtered signal using
Statistical techniques.
sequential fashion. To measure the activity level,
segmentation and classification of EMG signal into the AS and BLS, threshold has been calculated based on mean absolute value of whole EMG signal. In digital filter, designing technique of BLF removal the high pass IIR Butterworth filter has been designed. In the third approach, a simple moving average method is devised.
10
International Journal of Scientific & Engineering Research, Volume 3, Issue 11, November-2012
ISSN 2229-5518
From the last chapter the degree of BLF cancellation
provided by a given method on a certain EMG signal can be
measured indirectly by looking at the decrement in the signal’s F and N values. BLF removal methods can be compared by direct computation of F and N parameters in the processed signal. It can be easily shown that the reduction in the values of F and N are large in case of statistical technique of BLF removal. Thus based on the values of F and N, the statistical technique provides better performance in comparison of other two techniques. On the other hand, in case of moving average the values of F and N are reduced significantly in comparison of digital filter design technique. The performance of all these three method can also be classified based on three parameters names: BL removal quantity, complexity of the technique and change in the originality of signal. In the sense of complexity, the Moving average method is efficient as compare to other two methods, because the algorithm required in this approach is easier and smaller than other methods. In the sense of changes in the originality of signal, digital filter designing approach is efficient and reliable than others methods, which can be easily seen in the Figure
5.1 b. At last based on the quantity of the removal of BLF,
the statistical approach is descent one as compare to other methods.
The selection of one of the method from the above three
methods for BLF removal can be based on the requirement of the work. Although, all these methods are promising for enhance EMG signal quality, So that the process of MUAP extraction and analysis would be easier and reliable.
REFERENCES
1. A.O. Andrade, S. Nasuto, P. Kyberd and C. Sweeney- Reed, “Generative topographic mapping applied to visualization of motor unit action potential”, Biosystems (2005.)
2. Bezier, P., “Definition Numerique des Courbes et
Surfaces II”. Automatisme, 12:17-21, (1967).
3. De Luca, C.J., “Physiology and mathematics of myoelectric signals”, IEEE Trans. BME 34, 98-105 (1987).
4. C. Campos, A. Malanda, L. Gila, V. Segura, I.
Lasanta, J. Artieda, Quantification of jiggle in real
electromyography signals, Muscle Nerve, (2000), pp
1022–1034.
5. C.R. Meyer, H.N. Keiser, Electrocardiogram baseline noise estimation and removal using cubic spline and State-space computation techniques, in computers and biomedical research, Academic Press New York, (1997), pp 459-470.
6. C.I. Christodoulos. C.S. Pattichis. “A New Technique
for the Classification and Decomposition of EMG
Signals”. Proceeding in IEEE international conference
Neural Network 1995, pp-2303-2308.
7. C.S. Pattichis, M.S Pattichis, “Analysis of motor unit
action potential”. IEEE Trans Biomed Eng. 1994, pp
1320- 1329.
8. Craven, P. and Grace Wahba, “Smoothing Noisy Data with Spline Functions”: Estimating the Correct Degree of Smoothing by the Method of Generalized Cross-Validation", (1979), pp 377-403.
9. C.S. Burrus, J.H. McClellan, A.V. Oppenheim, T.W.
Parks, R.W. Schafer & H.W. Schussler. Computer- Based Exercises for Signal Processing Using MATLAB. Prentice-Hall, (1994).
10. D.C. Preston, B.E. Shapiro, Electromyography and Neuromuscular Disorders, Butterworth-Heinemann, Boston, (1998).
11. E. Stalberg, S. Andreassen, B. Falk, H. Lang, A.
Rosenfalk, W. Trojaborg, “Quantitative analysis of individual motor units potentials: a proposition for standardized terminology and criteria for measurement”, J. Clin. Neurophysiol. (1986), pp 313–
348.
12. E. Stalberg, M. Sonno, “Assessment of variability in the shape of MUAP”, the “jiggle”, at consecutive discharges, Muscle Nerve (1994), pp-1135-1144.
13. Emmanuel C. Ifeachor & Barrie W. Jervis “Digital signal processing a Practical Approach” second edition (Publisher: Pearson Education Asia).