
International Journal of Scientific & Engineering Research, Volume 3, Issue 11, November-2012 1
ISSN 2229-5518
a- A Prof, Building and Construction Department, University of Technology, Iraq
b-Research Fellow, College of Engineering, UNITEN, Malaysia,
** E-Mail: dr.salahfarhan@yahoo.com, HP: (+9647901497563), (+60147315069)
c- Local Environmental Council Chairman, Al-Anbar Province, Iraq
**, E-Mail: sa_shadeed@yahoo.com, HP: (+964792354118)
Hundreds of thousands of tons of cement kiln dust (CKD) as well as other emissions are generated annually from existing cement plants in Iraq. Most plants dispose of CKD near or around the plants site as uncovered mounds and piles with significant economic and environmental impacts. The amount of generated CKD is found to be variable among different cement plants. It can be estimated that the generated CKD on the average is about (8-33) % of the production output depending on the conditions of each plant.
An experimental laboratory work on one of the beneficial uses of CKD was carried out in this study. CKD was mixed with sewage sludge as dry alkaline stabilizing agent. Sludge treated with CKD was found to meet the class A requirements (fecal coliform density less than 1000 MPN/g solid) as set by USEPA. In this study, the fecal coliform density of
thickened sludge treated with 20 % CKD was reduced from 2.43×10⁸ MPN/g to 410
MPN/g, while; for dewatered sludge treated with 30 % CKD, it was reduced from 8.75×10⁷
MPN/g to 220 MPN/g. CKD was successfully applied to destroy pathogens, reduce vector attraction and bring the sludge to a manageable form.
Although sanitation in Iraq cities is not yet as required level, but a huge amounts of sludge expected to be rejected and disposed to the environment in the near future. Conjunction
with lack of available sludge treatment technology, several problems could be created due
IJSER © 2012 http://www.ijser.org
International Journal of Scientific & Engineering Research, Volume 3, Issue 11, November-2012 2
ISSN 2229-5518
to high water content and pathogens of disposed sludge. Many studies and research works where performed by Iraqi engineers and researchers to solve this problem. Apart of them concentrates to use the disposed CKD from cement manufacturing plants.
The physical characteristics of fresh CKD are a fine, dry alkaline dust that readily absorbs water. CKD particle sizes generally vary by kiln process type and range from 0-5 micrometers (µm) (approximately clay size) to greater than 50 µm (silt size). The chemical composition of the primary bulk constituents in CKD (those found in quantities greater than 0.05 percent by weight) are silicates, calcium oxide, carbonates, potassium oxide, sulfates, chlorides, various metal oxides, and sodium oxide. Also that variability in raw feed, fuels, process types and product specifications may influence CKD chemical characteristics.
There are many existing plants of cement production working in Iraq which are generating thousands tons yearly of by-product (CKD) which by current practices of managing and disposing have caused, and may continue to cause contamination of air, nearby surface water and ground water, also pose a danger to human health and environment and it may do so in the future.
One of the most important options for making use of CKD is mixing it with sludge resulting from sewage treatment plants as stabilizing/solidifying agent. Where absorptive capacity and alkaline properties of CKD can reduce the moisture content and provide an alkaline environment for waste materials (sludge) (Naik et al., 2003; USEPA, 1993). This approach to wastes utilization allows not only saving natural resources, but also avoiding the negative environmental impact of waste disposal and land filling (Paulauskas et al.,
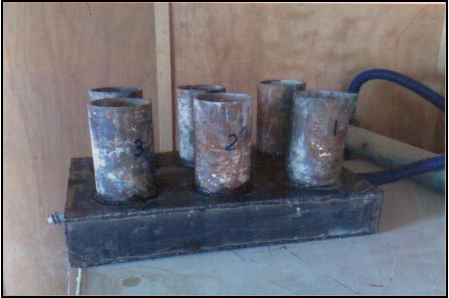
2006). A laboratory study was conducted to determine if CKD could be used as dry- alkaline stabilization agent to stabilize the sewage sludge in accordance with EPA criteria for PSRP. This study was applied on a sewage sludge produced at Al-Rustamiyah sewage treatment plant. Usually, effluent and disposal sludge from this plant are used for land application. At Al-Rustamiyah sewage treatment plant, the sludge passes to the drying bed without significant stabilization of organic matter. Due to the function absence of plant's
digesters which are out of service from many years ago, the sludge on the drying beds
IJSER © 2012 http://www.ijser.org
International Journal of Scientific & Engineering Research, Volume 3, Issue 11, November-2012 3
ISSN 2229-5518
becomes septic again which creates serious troubles (Al-Najjar, 2001), as well as having high densities of fecal coliform bacteria as shown later.
Dry alkaline stabilization of sewage sludge by using CKD is a treatment intended to destroy pathogens, reduce vector attraction and odors, and bring the sludge to a manageable form for land application. Fecal coliforms bacteria tests are used as an indicator or measure of the effectiveness of stabilization process in reducing microbial densities in sludge (Christine et al., 2007).
The survey of the sixteen cement plants which are grouped into three regional companies of cement was prepared as data collection worksheet and distributed to all plants. Approximately, more than 85 percent of the cement plants have been responsive to the survey. Some of the responses may not provide accurate or complete data for many reasons. To minimize the non-response and the lack of data, information submitted by plants in response to the survey was supplemented and evaluated against data obtained from other sources. These other sources include sampling and measurement activities, data collection from documents and reports; site visits observations and utilizing the published international experience in this field.
The production capacity of Iraq cement industry which is distributed over three regional state companies is shown in table (1) which consisted of (79 %) produced by dry process kilns and the remaining (21%) produced by wet process kilns.
Company | Wet Process Capacity (1000 Ton/Year) | Dry Process Capacity (1000 Ton/Year) | Overall Capacity (1000 Ton/Year) | |||
Available | Designed | Available | Designed | Available | Designed | |
Northern | 402 | 875 | 1321 | 3950 | 1723 (10.5%) | 4825 (29%) |
IJSER © 2012 http://www.ijser.org
International Journal of Scientific & Engineering Research, Volume 3, Issue 11, November-2012 4
ISSN 2229-5518
Iraqi | 0 | 0 | 2226 | 5290 | 2226 (13%) | 5290 (32%) |
Southern | 1434 | 2600 | 1040 | 3940 | 2474 (15%) | 6540 (39%) |
Total | 1836 (11%) | 3475 (21%) | 4587 (27.5%) | 13180 (79%) | 6423 (38.5%) | 16655 (100%) |
An understanding of the issues surrounding CKD requires knowledge of both the raw
materials and the fuels (process input) used in cement kiln systems, because these inputs in conjunction with the manufacturing process determine the characteristics and quantities of CKD generated. Fuel inputs can significantly influence CKD chemical characteristics especially sulfur level. Table (2) shows the characteristics of heavy fuel oil used as a source of heat required in cement manufacturing process at all cement plants. The designed and actual heat consumption is shown in Table (3) for all cement plants of the three cement companies. While table (4) is showing the designed and interdependent conversion factor (the quantity of raw materials required to produce unit of product) for all cement plants.
Chemical properties | Physical Properties | ||
Components | Average wt % | Property | Value |
Ash | 0.02-0.04 | Sp.Gr | 0.94 |
Hydrogen | 11 | Calorific value | 9670 kcal/kg oil |
Carbon | 85 | Pour point | 10 0C |
Sulphur | 3.5 | Flash point | 65 0C |
moisture | < 1 |
IJSER © 2012 http://www.ijser.org
International Journal of Scientific & Engineering Research, Volume 3, Issue 11, November-2012 5
ISSN 2229-5518
Cement Plants of | Fuel Consumption ( k cal / kg Clinker ) | ||
Cement Plants of | Designed | Actual | % of deviation |
Northern Co. | |||
Old Badoosh | 1700 | 2000 | 17.6 |
Badoosh/2 | 900 | 1100 | 22 |
Badoosh/3 | 950 | 1250 | 31.5 |
Sinjar | 1000 | 1200 | 20 |
Old Hammam Al Aleel | 1750 | 2000 | 14.3 |
New Hammam Al Aleel | 1750 | 2000 | 14.3 |
Iraqi Co. | |||
Al Qaim | 840 | 1100 | 31 |
Kubaisa | 820 | 1100 | 34 |
White Falluja | 1500 | 1750 | 17 |
Kirkuk | 840 | 1100 | 31 |
Southern Co. | |||
Old Kufa | 1550 | 1800 | 16.1 |
New Kufa | 1550 | 1755 | 13.2 |
Al-Muthana | 950 | 1500 | 57.8 |
Al- Janoob/Samawa | 1750 | 2100 | 20 |
Kerbala | 950 | 1500 | 57.8 |
Sadda | 1750 | 2000 | 14.3 |
Total Average | 1284 | 1578 | 22.8 |
IJSER © 2012 http://www.ijser.org
International Journal of Scientific & Engineering Research, Volume 3, Issue 11, November-2012 6
ISSN 2229-5518
Cement Plant | Conversion Factor | ||
Cement Plant | Designed | Interdependent Now | % Of Deviation |
Northern Co. | |||
Old Badoosh | 1.62 | 1.76 | 8.6 |
Badoosh/2 | 1.70 | 1.85 | 8.8 |
Badoosh/3 | 1.76 | 1.90 | 8.0 |
Sinjar | 1.72 | 1.92 | 11.6 |
Old Hammam Al Aleel | 1.62 | 1.76 | 8.6 |
New Hammam Al Aleel | 1.62 | 1.76 | 8.6 |
Sector Average | 1.67 | 1.82 | 9.0 |
Iraqi Co. | |||
Al Qaim | 1.76 | 2.0 | 13.6 |
Kubaisa | 1.74 | 1.95 | 12 |
White Falluja | 1.75 | 1.92 | 9.7 |
Kirkuk | 1.76 | 2.0 | 13.6 |
Sector Average | 1.75 | 1.97 | 12.2 |
Southern Co. | |||
Old Kufa | 1.72 | 1.90 | 10.5 |
New Kufa | 1.72 | 1.90 | 10.5 |
Al-Muthana | 1.77 | 2.30 | 29.9 |
Al- Janoob/Samawa | 1.80 | 2.20 | 22.2 |
Kerbala | 1.80 | 2.40 | 33 |
Sadda | 1.79 | 1.92 | 7.3 |
Sector Average | 1.76 | 2.10 | 19.0 |
National Average | 1.73 | 1.96 | 13.4 |
IJSER © 2012 http://www.ijser.org
International Journal of Scientific & Engineering Research, Volume 3, Issue 11, November-2012 7
ISSN 2229-5518
In Iraq, specific data on CKD waste were sparse. A sampling and analysis program was conducted to determine the specific characteristics of CKD at different sources and to integrate the results with available data from plants documents and reports. In addition, dust emission measurements were carried out at different plants to determine the concentration of dust emitted from stacks.
Method and instruments used to quantify and qualify the CKD were as follows:
- Dust emission from stacks was measured according to ASTM D 2928-71; standard method for sampling stacks for particulate matter. The tests were carried out by using FLS miljo mini-sampTM equipment.
Particle size distribution specified by using soil hydrometer, 152 H-62 ASTM, 0 – 60 g/l.
Chemical analysis of cement and CKD were done according to ASTM C-114. Also, this method determines the oxides of silica, aluminum, iron, calcium, magnesium, sulfur.
Alkali materials (sodium and potassium oxides) measured according to ASTM C-114 using flame photometer model JENWAY – PFP7.
pH measured by using pH-meter according to ASTM D-4972.
Water holding capacity measured according to ASTM D-2216.
The mean of chemical analysis of CKD which generated is shown in table (5), and the particle size distribution and other physical properties are shown at table (6) for different
cement plants of the three cement companies.
IJSER © 2012 http://www.ijser.org
Northern cement plant's samples
Iraqi cement plant's samples
Southern cement plant's samples
omponents
(wt%)
ample No. 1 adoosh)
ample No.2
Sinjar)
ample No.3 amm-am
l Aleel)
Sample No. 1 l Qaim)
ample No. 2
Kirkuk)
ample No. 3
Falluja)
Sample No. 1 (Kufa)
ample No. 2
Muthana)
ample No. 3 erbala)
![]()
International Journal of Scientific & Engineering Research, Volume 3, Issue 11, November-2012 9
ISSN 2229-5518
Wet process | ||||||
Particle size (µ) | Ave Sample No. 1 (Old Badoosh) | Ave Sample No. 2 (Hammam Al-Aleel) | Ave Sample No. 3 (Kufa) | |||
Particle size (µ) | percent C | umulative percent | percent | umulative p percent | ercent | umulative percent |
< 10 | 48 | 48 | 50 | 50 | 54 | 54 |
10-20 | 35 | 83 | 31 | 81 | 33 | 87 |
20-30 | 8 | 91 | 9 | 90 | 8 | 95 |
30-40 | 5 | 96 | 7 | 97 | 4 | 99 |
> 40 | 4 | 100 | 3 | 100 | 1 | 100 |
Dry process | ||||||
Particle size (µ) | Ave Sample No. 1 (Sinjar) | Ave Sample No. 2 (Kubaisa) | Ave Sample No. 3 (Al-Muthana) | |||
Particle size (µ) | percent | umulative percent | percent | umulative percent | percent p | mulative ercent |
< 10 | 70 | 70 | 75 | 75 | 71 | 71 |
10-20 | 19 | 89 | 15 | 90 | 13 | 84 |
20-30 | 7 | 96 | 4 | 94 | 9 | 93 |
30-40 | 2 | 98 | 3 | 97 | 4 | 97 |
> 40 | 2 | 100 | 3 | 100 | 3 | 100 |
Bulk Density (gm / ℓ) | 800 – 850 | |||||
Water holding capacity (at atmospheric pressure) | ( 80 – 85 ) % | |||||
pH | 10.5 - 13 |
IJSER © 2012 http://www.ijser.org
International Journal of Scientific & Engineering Research, Volume 3, Issue 11, November-2012 10
ISSN 2229-5518
Parameter | Thickened sludge | Dewatered sludge |
pH | 6.7 | 6.8 |
TS % | 7.0 % | 16.0 % |
VS % | 74.0 % | 63.0 % |
FC (MPN/g solid) | 2.43 × 10⁸ | 8.75 × 10⁷ |
Chemical composition (wt %) | Physical characteristics | ||||
CaO | 50.7 | SO3 | 7.3 | pH | 12.8 |
Al2O3 | 5.2 | Na2O | 1.1 | Bulk density | 840 gm/l |
SiO2 | 17.1 | K2O | 1.6 | Particle size | < 10 µ 84 % |
IJSER © 2012 http://www.ijser.org
International Journal of Scientific & Engineering Research, Volume 3, Issue 11, November-2012 11
ISSN 2229-5518
Fe2O3 | 0.4 | L.O.I. | 19.8 | 10-40µ 13 % > 40 µ 3 % | |
MgO | 1.8 | 10-40µ 13 % > 40 µ 3 % |
cake material.
IJSER © 2012 http://www.ijser.org
International Journal of Scientific & Engineering Research, Volume 3, Issue 11, November-2012 12
ISSN 2229-5518
90 with a glass electrode) was used for the analysis. Table (9) shows the pH values of treated sludge with different CKD addition at different time intervals for both thickened and dewatered sludge.
pH para- meter | Thickened Sludge Treated With | Dewatered Sludge Treated With | ||||||||||
pH para- meter | 5 % CKD | 10 % CKD | 15 % CKD | 20 % CKD | 30 % CKD | 40 % CKD | 5 % CKD | 10 % CKD | 20 % CKD | 25 % CKD | 30 % CKD | 40 % CKD |
After 2 hr | 11.2 | 11.8 | 12.2 | 12.4 | 12.5 | 12.5 | 10.8 | 11.5 | 11.9 | 12.2 | 12.5 | 12.5 |
After 12 hr | 11.7 | 11.9 | 12.1 | 11.8 | 12.2 | |||||||
After 24 hr | 11.3 | 11.6 | 11.8 | 11.4 | 11.7 |
IJSER © 2012 http://www.ijser.org
International Journal of Scientific & Engineering Research, Volume 3, Issue 11, November-2012 13
ISSN 2229-5518
After 72hr | 11.3 | 11.5 | ||||||||||
After 120hr | 11.1 | 11.2 | ||||||||||
After 168hr | 11.0 | 11.1 |
the sludge sample at (103-105) oC.
Total solids percent are calculated by the following equation (APHA, 1995):
%TS ![]()
A B 100
C B
.......................................... (a)
Where:
A = weight of dish plus dried sample, g. B = weight of dish, g.
C = weight of dish plus wet sample, g.
Moisture content is a measure of water in sludge. Percent of moisture content is equal to (1-
% TS). After the total solids were determined, the dried residue was placed in a 550 oC furnace for sixty minutes to drive off the volatile solids. Volatile solid is a measure of the organic matter content of the sludge (Vesilind, 1979). Volatile solid content is usually
quoted as a percentage of the total solide residue as follow (APHA, 1995):![]()
%VS WVS
WTS
100
………………………….. (b)
IJSER © 2012 http://www.ijser.org
International Journal of Scientific & Engineering Research, Volume 3, Issue 11, November-2012 14
ISSN 2229-5518
Where:
WVS = weight of volatile solid and
WTS = weight of dry solid.
Table (10) shows the moisture content, total and volatile solids percent for both thickened and dewatered sludge treated with 20 % and 30 % CKD, respectively at different time intervals.
± 2 hours at 35 ± 0.5 oC.
Time intervals | Thickened sludge treated with 20 % CKD | Dewatered sludge treated with 30 % CKD | ||||
TS % | VS % | MC % | TS % | VS % | MC % | |
After 24 hr | 37.8 | 25.3 | 62.2 | 48.4 | 19.1 | 51.6 |
After 48 hr | 49.5 | 24.2 | 50.5 | 63.2 | 16.9 | 36.8 |
After 72 hr | 58.4 | 23.7 | 41.6 | 74.6 | 15.8 | 25.4 |
After | 69.6 | 22.8 | 30.4 | 84.3 | 14.4 | 15.7 |
IJSER © 2012 http://www.ijser.org
International Journal of Scientific & Engineering Research, Volume 3, Issue 11, November-2012 15
ISSN 2229-5518
96 hr | ||||||
After 120 hr | 78.8 | 22.1 | 21.2 | 89.1 | 13.3 | 10.9 |
After 144 hr | 89.2 | 21.4 | 10.8 | 92.6 | 12.1 | 7.4 |
After 168 hr | 94.3 | 19.3 | 5.7 | 96.1 | 11.2 | 3.9 |
After incubation, the presence of turbidity and gas constitutes a positive presumptive test for coliforms. The absence of turbidity and gas requires a second incubation for 24 ± 2 hours at 35 ± 0.5 oC. Failure to produce turbidity and gas (i.e. shades of yellow color) within 48 hours ± 3 hours indicates fecal coliforms are not present. Combination number of positive tubes of the highest dilution and the next two higher dilutions are used to determine the MPN index/100 ml value from a table. This index value is used to compute the MPN /g dry solid according to the following equation (USEPA, 1999; USEPA, 2005):
MPN/g solid = (10×MPN index/100 ml)/(largest volume×% dry solid) ------- (c)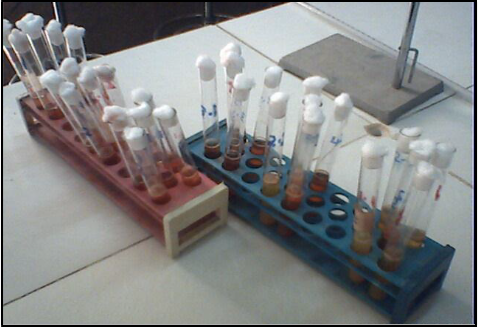
IJSER © 2012 http://www.ijser.org
International Journal of Scientific & Engineering Research, Volume 3, Issue 11, November-2012 16
ISSN 2229-5518
The results of fecal coliform densities with time for mixes proportion which satisfy the required pH are presented in table (11).
Time intervals | ecal Coliform Density (MPN/G Solid) Of Thickened Sludge Treated With 20 % CKD | Fecal Coliform Density (MPN/G Solid) Of Dewatered Sludge Treated With 30 % CKD |
After 4 hrs | 1.20×10 7 | 2.40×10 6 |
After 12 hrs | 6.22×10 5 | 4.0×10 5 |
After 24 hrs | 3.16×10 4 | 1.11×10 4 |
After 72 hrs | 1.76×10 3 | 1.47×10 3 |
After 120 hrs | 1.01×10 3 | 8.5×10 2 |
After 168 hrs | 4.1×10 2 | 2.2×10 2 |
pathogen reduction: Class A, where, the density of fecal coliform in the sewage sludge
IJSER © 2012 http://www.ijser.org
International Journal of Scientific & Engineering Research, Volume 3, Issue 11, November-2012 17
ISSN 2229-5518
should be less than 1000 most probable number (MPN) per gram of total solids and class B, where the density of fecal coliform in the sewage sludge should be less than 2 million (MPN) per gram of total solids. Both classes are safe, but additional requirements are necessary with class B materials (USEPA, 2000).
4.2- The pH of the sludge/alkaline materials mixture must be above 12 for 2 hours and subsequently maintained above 11.5 for 22 hours to meet pathogen and vector attraction reduction requirements by alkaline addition. The importance of measuring the pH during alkaline stabilization is based on the relationship of this parameter to pathogen destruction (USEPA, 1999).
IJSER © 2012 http://www.ijser.org
International Journal of Scientific & Engineering Research, Volume 3, Issue 11, November-2012 18
ISSN 2229-5518
sludge. It was necessary to dry the stabilized sludge to moisture content preferably less than
10 % to prevent pathogen re-growth in conjunction with alkaline environment (WEF,
treated sludge to accelerate drying and contribute to the oxidation of volatile solids.
14
pH
Treated thickened sludge
Treated dewatered sludge
12
10
8
6
0 24 48 72 96 120 144 168
Time (hours)
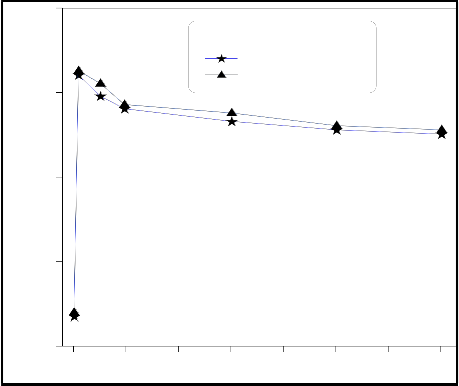
maintain it for two hours or maintain a pH of at least 11 for 22 hours (USEPA, 1999).
IJSER © 2012 http://www.ijser.org
International Journal of Scientific & Engineering Research, Volume 3, Issue 11, November-2012 19
ISSN 2229-5518
Thickened sludge treated with 20 % CKD and dewatered sludge treated with 30 % CKD as shown in table (10) could met the vector attraction requirements with regard to pH level.
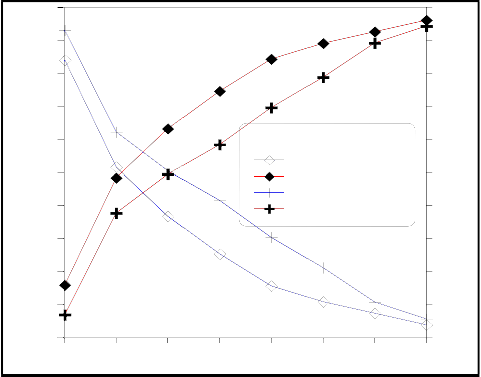
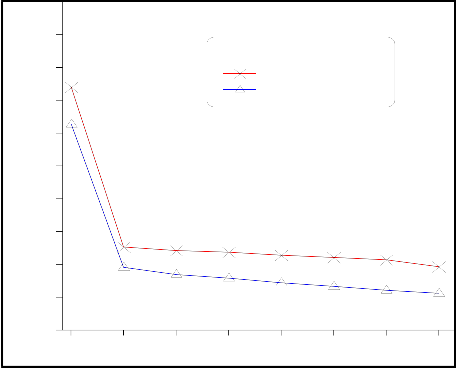
Reduction of vector attraction is achieved if the mass of volatile solids in the treated sludge is reduced by at least 38 % (USEPA, 1999). Volatile solids content of sludge is an indication of sludge stability; hence, reduction of volatile solids is used for assessing the effectiveness of a process in stabilizing sludge. Figure (5) shows the change in volatile solid content as percent to the total solid with time for thickened sludge and dewatered sludge treated with 20% and 30% CKD respectively. As shown the rapid decrease in volatile solids percent is due to the CKD addition which is an inorganic solid material. Then, a slow decay in volatile solids percent is observed as a result of oxidation of organic
matter by vent air used for sludge drying.
100
100
90 90
80 80
70 70
60 TS % AND MC % 60
MC % of dewatered sludge
50 TS % of dewatered sludge 50
MC % of thickened sludge
40 TS % of thickened sludge 40
30 30
20 20
10 10
0 0
0 24 48 72 96 120 144 168
Time (hours)
IJSER © 2012 http://www.ijser.org
International Journal of Scientific & Engineering Research, Volume 3, Issue 11, November-2012 20
ISSN 2229-5518
90
Percent of Volatile solid
80
Treated thickened sludge
Treated dewatered sludge
70
60
50
40
30
20
10
0
0 24 48 72 96 120 144 168
TIME (hours)
partially qualify as class A sludge, or less than 2×10⁶ MPN /g of solids if the sludge is to
qualify as class B sludge. These standard limits were compared with the experimental results to determine the CKD dose (addition) needed to meet these criteria.
Fecal coliforms are a group of bacteria that are defined by their ability to use lactose for growth when incubated at elevated temperatures. With respect to biosolids, fecal coliforms are also used as indicators or measure of process effectiveness in reducing microbial densities (WEF, 2006).
Before CKD addition, the fecal coliform densities as illustrated in table (3.10) were
2.43×10⁸ MPN/g of solids for thickened sludge and 8.75×10⁷ MPN/g of solids for dewatered sludge. After CKD addition, the mixes proportion which satisfy the required pH
IJSER © 2012 http://www.ijser.org
International Journal of Scientific & Engineering Research, Volume 3, Issue 11, November-2012 21
ISSN 2229-5518
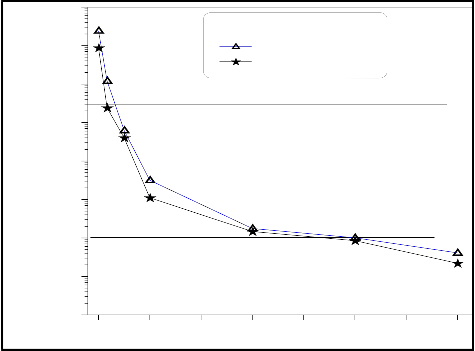
were further monitored for fecal coliform densities with time and the results are presented in table (3.14). MPN of fecal coliform per gram of solid have been calculated by the combination of positive tubes for a series of dilutions. About 99 % decrease in fecal coliform count was observed as shown in figure (4.10) after 12 hours upon mixing the samples of sludge with CKD.
Thickened and dewatered sludge treated with 20 % and 30 % CKD, respectively met the requirements for class B after 12 hours. Where, the MPN of fecal coliform was 6.22×10⁵ and 4.0 ×10⁵ per gram of solid for thickened sludge treated with 20 % CKD and dewatered sludge treated with 30 % CKD, respectively. At 120 hours, thickened and dewatered sludge amended with 20 % and 30 % CKD, respectively, met class A requirements with fecal coliform densities about 1000 MPN/g of solid and 850 MPN /g of solid for thickened and
dewatered sludge, respectively.
1000000000
100000000
MPN/g solid
Treated thickened sludge
Treated dewatered sludge
10000000
1000000
Upper limit of class B sludge
100000
10000
1000
Upper limit of class A sludge
100
10
0 24 48 72 96 120 144 168
TIME (hours)
IJSER © 2012 http://www.ijser.org
International Journal of Scientific & Engineering Research, Volume 3, Issue 11, November-2012 22
ISSN 2229-5518
Examination of thickened sludge treated with 15 % CKD and dewatered sludge treated with 25 % CKD after 24 hours of treatment showed that the fecal coliform densities of treated sludge achieve class B requirements. Where the fecal coliform density was 5.4×10⁵
MPN/g solid for thickened sludge and 3.72×10⁵ MPN/g solid for dewatered sludge, the
dose needed to meet the pH criteria is higher than the dose needed to reduce the density of fecal coliform, which guarantees that the pH-time criteria set by the US EPA are adequate to meet the fecal coliforms requirement.
Examination of final sludge produced at Al-Rustamiyah treatment plant as illustrated in table (12) which was treated by sun on drying bed shows that the average value of fecal coliform density is 1.49×10⁶ MPN per gram of solid which met the class B sludge according to the US EPA requirements.
pH | % TS | % VS | FC (MPN/g solid) |
6.8 | 94 | 21 | 1.49×10⁶ |
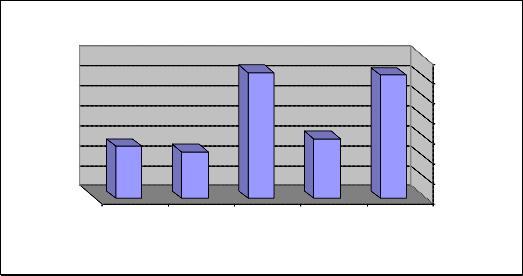
Comparison between fecal coliform densities in treated sludge with CKD and sludge produced at Al-Rustamiyah plant with pathogen reduction requirement of class A and B is shown in figure (7). This figure indicates that treating sludge with CKD could achieve class A requirements while sludge produced at Al-Rustamiyah plant achieve class B
requirements.
IJSER © 2012 http://www.ijser.org
International Journal of Scientific & Engineering Research, Volume 3, Issue 11, November-2012 23
ISSN 2229-5518
comparison of fecal coliform densities
Treated thick sludge
Treated dewatered
sludg
Class B
Class A
7
6
5
4
3
2
1
0
Alrustamyah
final sludg
1- Al-Najjar, Abdulfattah Ahmed Ameen, (2001), " Evaluation of Sludge Treatment in Al- Rustamiyah Sewage Treatment Plant-3rd Extension", MSc. Thesis, University of Technology.
2- APHA, (1995), Standard Methods for the Examination of Water and Wastewater 18th
edition, American Public health Association.
3- APHA, (1995), Standard Methods for the Examination of Water and Wastewater 18th
edition, American Public health Association.
4- Burnham, C. Jeffry, Hatfield, Nancy, Bennett, F. Gary and Logan, J. Terry, 2000, " Use of Kiln Dust With Quicklime for Effective Municipal Sludge Pasterization and Stabilization With the N-Viro Soil Process ", www.patentstorm.us/patents/5997599.
5- Christine, L. Bean; Jacqueline, J. Hansen; Aarone, B. Margoline and Giovanni Widmer, (2007), " Class B Alkaline Stabilization to Achieve Pathogen Inactivation", Int. J. Environ. Res. Public Health, Vol. 4, No. 1, www.mdpi.org/ijerph/papers/ijerph2007010009.pdf.
6- European Commission, 2001, " Reference Document on Best Available Techniques in the
Cement and Lime Manufacturing Industries ", IPPC Document, www.jrc.es/pub/english.cgi/d733211/03.
IJSER © 2012 http://www.ijser.org
International Journal of Scientific & Engineering Research, Volume 3, Issue 11, November-2012 24
ISSN 2229-5518
7- Investment Department, 2007, " Investment Opportunities to Implement New Cement
Plants in Iraq", Ministry of Industry and Minerals, Republic of Iraq.
8- Naik, R. Tarun, Canpolat, F. and Chun, Y., 2003, "Uses of CKD other than for flue gas desulfurization", http://www.uwm.edu/dept/CBU/abstracts/03-529.pdf.
9- Paulauskas, Valdas; Sabiene, Nomeda and Zaleckas, Ernestas, 2006, "Wastewater Sewage Sludge Leaching and Alkaline Stabilization", EKOLOGIJA, No. 4, Lithuania University of Agriculture.
10- Tchobanoglous, George and Schroeder, Edward D., 1985, " Water Quality-Characteristics, Modeling and Modification", Addison-Wesley Publishing Company, Inc.
11- UKEA, 2001, "Guidance for the Cement and Lime Sector", IPPC, Version 1,
www.sepa.org.uk/pdf/ppc/uktech/ippc_s3_01.pdf.
12- UNEP, 1997, "Global Environment Outlook-1: Global State of the Environment- Chapter
3: Policy Responses and Directions", http://www.grida.no/geo1/ch/ch3_28.
13- UNEP, 2006, "Iraq Institutional Capacity Assessment Report", http://postconflict.unep.ch/publications/ICA_iraq.pdf.
14- UNEP, UNEP in Iraq, 2007, " Post-Conflict Assessment, Clean-up and
Reconstruction", http://postconflict.unep.ch/publications/Iraq.pdf.
15- USEPA, 1999, " Environmental regulations and technology: Control of pathogens and Vector attraction in sewage sludge; EPA/625/R- 92/013, Office of Research and Development, http://www.epa.gov/ORD/NRMRL.
16- USEPA, 2000, " Biosolids Technology Fact Sheet – Alkaline Stabilization of Biosolids", www.epa.gov/region8/biosolids/biosolidsdown/BiosolidsTechSheetAlk.pdf.
17- USEPA, 2005, " Method 1680: Fecal Coliforms in Sewage Sludge by Multiple Tube Fermentation Using Lauryl Typtose Broth (LTB) and EC Medium", EPA-821/R-04-026, Office of Water, USEPA.
18- USEPA, 2006, " Mineral Products Industry-Portland Cement Manufacturing", http://www.epa.gov/ttn/chief/ap42/ch11/final/c11s06.pdf.
19- Vesilind, P. Aarne, 1979, " Treatment and Disposal of Wastewater Sludge ", ANN ARBOR SCIENCE Publishers INC.
20- WEF, 2006, " Reactivation and Regrowth of Fecal Coliform in Anaerobically Digested
Biosolids", Water Environment Federation, http://www.wef.org/science technology resources/biosolids/reactivationFecalColiform.htm.
IJSER © 2012 http://www.ijser.org