International Journal of Scientific & Engineering Research Volume 4, Issue3, March-2013 1
ISSN 2229-5518
Owoyokun, T. O.1,*, Soile, O. O. B. 1 and Gayawan, E. 2
1 Department of Chemistry and Biochemistry, Caleb University, Imota. Lagos. Nigeria.
2 Department of Mathematical Sciences, Redeemer’s University, Redemption City, Mowe. Nigeria.
* Corresponding Author: towoyokun1@yahoo.com, 234-8033873415
The effects of initial concentration (Co), contact time (t) and temperature (T) on the adsorption capacity (qe) of biosorbent, flamboyant tree pod on sorbate, methylene blue (MB) dye solutions have been studied using chemometrics. The experimental data were obtained during biosorption experiment in which different concentrations (10, 20, 30 and
40 mg / L) of MB dye solutions were adsorbed on the biosorbent at varying temperature (303, 313 and 323 oK) and the residual MB dye solutions were collected after varying contact time (15, 30, 45 and 60 minutes). Line graphical representations, univariate analysis of variance (ANOVA) and stepwise regression analysis were used to analyse the experimental data. qe was found to increase as Co, t and T increases. Maximum qe
was obtained at 323oK and minimum at 303oK at each t for every Co. Maximum qe was
obtained at 60 minutes and minimum at 15 minutes at each T for every Co. qe was greatest at 40 mg /L and least at 10 mg /L at every t and T. The difference in qe was significant when examined among different Co or t or T (p < 0.05). Predictive model built for qe taking Co, t and T as covariates using stepwise regression showed that their inclusion significantly and positively contribute to qe (R2 = 0.989) with the strength of
IJSER © 2013 http://www.ijser.org
International Journal of Scientific & Engineering Research Volume 4, Issue3, March-2013 2
ISSN 2229-5518
their inclusion on qe being Co > t > T. qe is therefore proved to be significantly influenced by Co, t and T.
Keywords: adsorption capacity, biosorbent, sorbate, flamboyant tree pod, methylene blue
Wastewaters from dyeing industries are released into nearby land or rivers without any treatment. The disposal of organic and coloured effluents into natural water bodies is not only aesthetically displeasing, but also impedes light penetration, thus upsetting biological processes within a stream. Many dyes are being noted to be toxic to aquatic organisms causing direct destruction of aquatic communities. Some dyes cause allergic dermatitis, skin irrigation, cancer and mutation in man. All these compounds are troublesome contaminants which pose not only to toxicity and health hazards but also hamper the environmental treatment processes. Recent estimates indicate that, approximately, 12% of synthetic textile dyes used each year is lost during manufacture and processing operation and 20% of these dyes enter the environment through effluents that result from the treatment of residual industrial waters (Weber and Stickney, 1993). The problem of considerable contamination of the aqueous environment with organic pollutants still requires the development of quick and simple methods for the removal, separation and determination of these compounds. Several biological, physical and chemical methods have been used for the treatment of industrial textile wastewater including microbial biodegradation, membrane filtration, oxidation and ozonation (Forgacs, et al., 2004).
IJSER © 2013 http://www.ijser.org
International Journal of Scientific & Engineering Research Volume 4, Issue3, March-2013 3
ISSN 2229-5518
However, many of these technologies are cost prohibitive, especially when applied for treating large waste streams. Adsorption has been noted to be effective method for the removal of odor, oil, colours and trace amount of organic pollutants in the industrial wastewater treatment (Babel and Opiso, 2007) because of its proven efficiency and economic advantage (Robinson, et al., 2002a, Garg, et al., 2003, Abdel- Ghani, et al., 2007). Researchers have carried out several adsorption studies of organic contaminants and dyes onto activated carbon (Tseng et al. 2003, Jung et al. 2001, Rajagopal & Kapoor 2001, Aksu & Yener, 2001, McKay, et al., 1987, Low, et al., 1995). However, the use of activated carbon (which has been the preferred adsorbent employed to treat wastewaters containing different classes of dyes and organics) has been a serious constraint considering the economic drawback of commercial activated carbon. Owing to this economic constraint, effective alternatives have been found with agricultural wastes. Adsorbents such as orange and banana peels (Annadurai, et al.,
2002), neem leafs (Bhattacharyya, et al., 2003), agricultural residues (Robinson, et al.,
2002b) and peanut hull (Gong, et al., 2005), pearl millet husk, date pits, saw dust buffing dust of leather industry, coir pith, crude oil residue tropical grass, olive stone and almond shells, pine bark, wool waste, coconut shell etc. (Selvarani, 2000; Sekaran et al., 1995) have been used for the removal of organics and dyes.
Use of flamboyant tree pods as adsorbent in dye removal from effluents has been rarely reported and this forms the basis of the present research. Therefore, this study seeks to find out the effects of conditions such as initial concentration, contact time and temperature on the adsorption capacity of flamboyant tree pods on MB dye (a
cationic dye).
IJSER © 2013 http://www.ijser.org
International Journal of Scientific & Engineering Research Volume 4, Issue3, March-2013 4
ISSN 2229-5518
Samples of flamboyant tree pod were collected from the flamboyant tree in University of Ibadan, Nigeria and subjected to drying. Dried flamboyant tree pod was grinded and sieved. The grains were further used as biosorbent in the biosorption experiment.
Methylene blue (MB) was obtained from the laboratory and used to prepare simulated waste water. An accurate weighed quantity of the MB dye was dissolved in distilled water and made up to mark in appropriate standard volumetric flask to prepare different initial concentrations of the dye (10, 20, 30 and 40 mg/L). In each biosorption experiment, 50 ml of different initial concentrations (10 – 40 mg/L) of MB dye solution at natural pH was added to 100 mg of the biosorbent in 250 ml flat bottom bottle at
different temperatures (30, 40 50oC) and the mixture was stirred on an electric shaker at
200 rpm for several minutes with the reading being taking at 15 minutes interval.
`In all the experiments, the supernatants were taken from the flask and filtered at every 15 minutes interval until equilibrium was reached; the remaining MB concentration after biosorption process was noted as final concentration. The initial and final concentrations at different time and temperatures were determined by using calibration curve of absorbance versus concentration at 668 nm with UV Visible spectrometer.
The adsorption capacity, qe was calculated by:
qe = V(Co – Ce) / W
where qe is biosorption capacity, V is the volume of the solution and W is the amount of the biosorbent, Co and Ce are initial and final sorbate concentrations respectively.
The experimental data were subjected to chemometrics using the line graphical
IJSER © 2013 http://www.ijser.org
International Journal of Scientific & Engineering Research Volume 4, Issue3, March-2013 5
ISSN 2229-5518
representation; univariate analysis of variance (ANOVA) and stepwise regression analysis at 0.05 significance level.
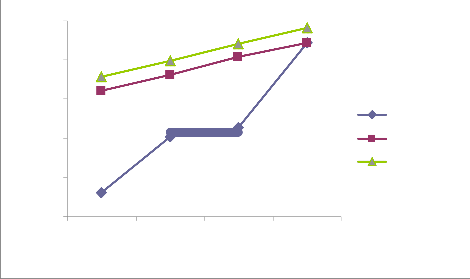
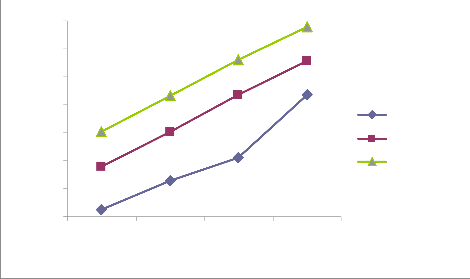
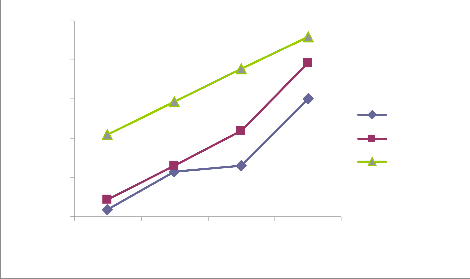
Figure i, ii, iii and iv in the appendix reveal similar trends of qe over contact time for each of the initial concentrations (10, 20, 30 and 40 mg/L) at different temperatures (303, 313 and 323 oK). qe increases over contact time at every temperature until equilibrium was reached at 60 minutes (qe is least at 15 minutes and greatest at 60 minutes) . Garg et al. (2003) reported similar trend in the biosorption of dyes using pine saw dust. In another perspective, the figures also reveal that at a given contact time (either 15, 30, 45 or 60 minutes), qe is highest at 323 oK and least at 303 oK. This implies that increase in temperature enhance the adsorption capacity (qe). Ncibi, M. C. et al. (2007) had reported that increase in temperature enhances biosorption. Considering the range of values of qe for different initial concentrations, it clearly evident that qe increases with increase in the initial concentration (greatest at 40 mg/L and least at 10 mg/L). Previous research has shown that increase in initial concentration enhances biosorption i.e. higher qe (Aksu, 2001)
From the univariate analysis of variance (ANOVA), taking each of the variables (Co, t, and T) as a fixed factor and the other two as covariates; the difference in qe (Δqe) is significant when examined across different Co, t, and T (P< 0.05). This implies that there is significant increase in qe over range of contact time, temperature and initial concentration.
Building a predictive model for qe taking initial concentration (Co), contact time (t), and temperature (T) as covariates using stepwise regression, it was found out that Co
was first to be included in the model followed by time and lastly temperature to indicate
IJSER © 2013 http://www.ijser.org
International Journal of Scientific & Engineering Research Volume 4, Issue3, March-2013 6
ISSN 2229-5518
how correlated the variables are in determining qe. It should be noted however that Co, contact time, and temperature are significant predictors of qe (as none of the covariates was left out). The final model is:
qe = - 2.525 + 0.490Co + 0.00358t + 0.00732T (R2 = 0.989)
The positive coefficients of Co, t and T in the model indicates that their inclusion significantly and positively contribute to qe. This implies that Co, t and T have prominent effect on qe.
` In this work, adsorption capacity, qe of flamboyant pod was determined using the initial concentration, contact time and temperature. It was found that qe is significantly influenced by the three covariates. Also, qe increases significant as the initial concentration, time and temperature increases. Lastly, using initial concentrations, contact time and temperature to predict the qe, the resulting model proved to be a reliable.
Authors wish to express gratitude to Department of Chemical Sciences, Redeemer’s University, Redemption City, Mowe. Nigeria for the permission granted him to use the equipment and reagents needed throughout the course of this research.
Abdel-Ghani, N.T.; Hefny, M.; El-Chaghaby, G.A.F., (2006). Removal of lead from aqueous solution using low cost abundantly available adsorbents. Int. J. Environ. Sci. Tech., 4
(1), 67-73.
IJSER © 2013 http://www.ijser.org
International Journal of Scientific & Engineering Research Volume 4, Issue3, March-2013 7
ISSN 2229-5518
Aksu, Z., 2001. Biosorption of reactive dyes by dried activated sludge: equilibrium and kinetic modeling. Biochem. Eng. J. 7, 79 - 84.
Aksu, Z. and Yener, J. (2001). A Comparative Adsorption Study of and Phenols using
Pinewood-based Activated Carbons, Carbon, 41: 487-495
Annadurai,G.; Juang, R.; Lee, D., (2002). Use of cellulosebased wastes for adsorption of dyes from aqueous solutions. J. Hazard. Mater. B92, 263-274.
Babel, S.; Opiso, M.E., (2007). Removal of Cr from synthetic wastewater by sorption into volcanic ash soil. Int. J. Environ. Sci. Tech., 4 (1), 99-107.
Bhattacharyya, K.G.; Sarma, A., (2003). Adsorption characteristics of the dye, brilliant green, on neem leaf powder. Dyes Pigments, 57, 211-222.
Forgacs, E.; Cserhatia, T.; Oros, G., (2004). Removal of synthetic dyes from wastewaters:
a review. Environ. Int., 30, 953-971.
Garg, V.K.; Gupta, R.; Yadav, A.B.; Kumar, R., (2003). Dye removal from aqueous solution by adsorption on treated sawdust. Bioresour. Tech., 89, 121-124.
Gong, R.M.; Ding, Y.; Li, M.; Yang, C.; Liu, H.J.; Sun, Y.Z., (2005). Utilization of powdered peanut hull as biosorbent for removal of anionic dyes from aqueous solution. Dyes Pigments, 64, 187-192.
Jung, M. W., Ahn,K. H., Lee, Y., Kim, K. P., Rhee, J. S., Park, J. T. and Paeng, K. J. 2001. Adsorption Characteristics of Phenol and Chlorophenols on Granular Activated Carbon (GAC), Microchem. J., 70: 123-131.
Low, K.S.; Lee, C.K.; Tan, K.K., (1995). Biosorption of basic dye by water hyacinth roots.
Bioresour. Tech., 52, 79-83. Mono-chlorinated Phenol onto Various Sorbents, Waste
Manag., 21: 695-702.
IJSER © 2013 http://www.ijser.org
International Journal of Scientific & Engineering Research Volume 4, Issue3, March-2013 8
ISSN 2229-5518
McKay, G.; Ramprasad, G.; Mowli, P., (1987). Desorption and regeneration of dye colours from low-cost materials. Water Res., 21, 375-377.
Ncibi, M. C. et al (2007) Adsorptive removal of textile reactive dye using Posidonia oceanica (L.) fibrous biomass. Int. J. Environ. Sci. Tech., 4 (4): 433-440.
Rajagopal, C. and Kapoor, J. C. 2001. Development of Adsorptive Removal Process for Treatment of Explosives Contaminated Wastewater using Activated Carbon, J. Hazardous Material, B87: 73-98.
Robinson, T.; Chandran, B.; Nigam, P., (2002a). Removal of dyes from a synthetic textile dye effluent by biosorption on apple pomace and wheat straw. Water Res., 36, 2824-
2830.
Robinson, T.; Chandran, B.; Nigam, P., (2002b). Effect of pretreatments of three waste residues, wheat straw, corncobs and barley husks on dye adsorption. Bioresour. Tech.,
85, 119-124.
Sekaran G, Shanmugasundaram K A, Mariappan M, Raghavan KV (1995). Adsorption of dyes by buffing dust of leather industry, Indian. J. Chem. Technol. (2): 311.
Selvarani K (2000). Studies on Low cost Adsorbents for the removal of Organic and
Inorganics from Water. Ph D., Thesis, Regional Engineering College, Tiruchirapalli, Tseng, R. L., Wu, F. C. and Juang, R. S. 2003. Liquid-phase Adsorption of Dyes
and Phenols using Pinewood-based Activated Carbons, Carbon, 41: 487-495.
Weber EJ, Stickney VC (1993). Water pollution by synthetic textiles dyes, Water Res. 27:
63.
IJSER © 2013 http://www.ijser.org
International Journal of Scientific & Engineering Research Volume 4, Issue3, March-2013 9
ISSN 2229-5518
4. 90
4. 85
4. 80
4. 75
4. 70
303 deg ree K
313 deg ree K
323 deg ree K
4. 65
15 30 45 60
Tim e (min)
9. 85
9. 80
9. 75
9. 70
9. 65
9. 60
303 deg ree K
313 deg ree K
323 deg ree K
9. 55
9. 50
15 30 45 60
Tim e (min)
IJSER © 2013 http://www.ijser.org
International Journal of Scientific & Engineering Research Volume 4, Issue3, March-2013 10
ISSN 2229-5518
14. 75
14. 70
14. 65
14. 60
14. 55
303 deg ree K
313 deg ree K
323 deg ree K
14. 50
15 30 45 60
19. 70
19. 60
19. 50
19. 40
19. 30
19. 20
303 deg ree K
313 deg ree K
323 deg ree K
19. 10
15 30 45 60
Time (min)

IJSER © 2013 http://www.ijser.org