International Journal of Scientific & Engineering Research, Volume 4, Issue 8, August-2013 2136
ISSN 2229-5518
Business Intelligence: Artificial Bear Optimization Ap- proach
Mary Jeyanthi Prem, M.Karnan
Abstract— Business Intelligence (BI) is about getting the right information, to the right decision makers, at the right time. A business intelligence environment offers decision makers information and knowledge derived from data processing, through the application of mathematical models and algorithms. BI systems tend to promote a scientific and rational approach to managing enterprises and complex organizations. Soft computing is a collection of new techniques in artificial intelligence, which exploit the tolerance for imprecision, uncertainty and partial truth to achieve tractability, robustness and low solution cost. The purpose of this article is to provide a NEW ALGORITHM with the impression from the smelling sense of BEAR, for the optimal and dynamic decision making system in the current business world.
Index Terms— Business Intelligence, Decision Making, Optimization, Artificial Bear Optimization.
—————————— ——————————
1 INTRODUCTION
Usiness Intelligence, or BI, is an umbrella term that refers to a variety of software applications used to analyze an organization’s raw data for intelligent decision making for business success. BI as a discipline is made up of several relat- ed activities, including data mining, online analytical pro-
cessing, querying and reporting.
Techniques include multidimensional analyses, mathematical projection, modeling, ad-hoc queries and 'canned' reporting.
BI leads to:
fact-based decision making
“single version of the truth”
The main purpose of BI systems is to provide Decision makers with tools and methodologies that allow them to make effec- tive and timely decisions[2]. With the help of mathematical models and algorithms, it is actually possible to analyze a large number of alternative actions, achieve more accurate conclusions and reach effective and timely decisions.
1.1 Effective decisions:
The application of rigorous analytical methods allows decision makers to rely on information and knowledge which are more dependable
Indeed, turning to formal analytical method forces decision makers to explicitly describe both the criteria for evaluating alternative choices and the mechanisms regulating the prob- lem under investigation
1.1 Timely decisions:
Enterprises operate in economic environments characterized by growing levels of competition and high dynamism.
With the help of mathematical models and algorithms, it is actually possible to analyze a large number of alternative ac-
tions, achieve more accurate conclusions and reach effective and timely decisions.
We may conclude that the major advantage deriving from the adoption of the business intelligence system is found in the increased effectiveness of the decision-making process.
2 DECISION MAKING
In complex organizations, public and private, decisions are made on a continual basis. Such decisions may be more or less critical, have long or short term effects and involve people roles at various hierarchical levels. The ability of these Deci- sion makers to make decisions, both as individuals and as a community, is one of the primary factors that influence the performance and competitive strength of a given organization.
Most decision makers reach their decisions primarily using easy and instinctive methodologies, which take into account specific elements such as Experience, Knowledge of the appli- cation domain and available information. This approach leads to a stagnant decision-making for the unstable conditions de- termined by frequent and rapid changes in the economic envi- ronment. Instead that decision-making processes within to- day’s organizations are often too complex and dynamic to be effectively dealt with through an instinctive approach, and require precisely based on Analytical methodologies and Mathematical models.
3 OPTIMIZATION PROBLEM
Optimization is finding an alternative with the most cost effec- tive or highest achievable performance under the given con- straints, by maximizing desired factors and minimizing unde- sired ones. In comparison, maximization means trying to at- tain the highest or maximum result or outcome without re- gard to cost or expense.
An optimization problem is a problem in which we have a col-
IJSER © 2013 http://www.ijser.org
International Journal of Scientific & Engineering Research, Volume 4, Issue 8, August-2013 2137
ISSN 2229-5518
lection of decisions to make, a set of rules governing how these decisions interact, and a means of quantitatively com- paring possible solutions. Our goal in such a problem is to find the optimal set of decisions that collectively satisfy all of the rules.
4 ARTIFICIAL BEAR OPTIMIZATION (ABO)
short legs. They have very big noses with thousands of smell receptors. Their acute sense of smell helps them track their cubs, find food, mates as well as keep a tab on competing
thanks to their keen sense of smell. Bears can smell better than any other animal on the planet, because the olfactory bulb re- gion in the brain is 5 times larger than in a human brain. This is quite surprising as the size of the brain is just one-third the size of humans.
The surface area of a bear's nose has 100 times more smell re- ceptors than a human nose. There are hundreds of tiny mus- cles in their nose that help them control smell. Thus, if you visit the woods for camping, it will be very difficult to keep a bear away from food. The sense of smell of a bear is 2,100 times better than humans.
Bears have an incredible sense of smell because the area of their brain that manages the sense of smell, called the olfactory bulb, is at least 5 times larger than the same area in human brains even though a bear's brain is one third the size.
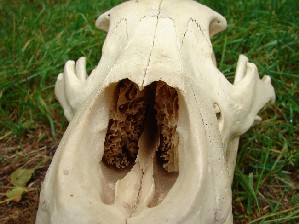
Fig. 1 Nasal Cavity of Grizzly Bear
Bears constantly gather, process, and exchange information using the sense of smell. Grizzly bears are believed to have a sense of smell 100,000 times stronger than a human. This bear skull shows the huge nasal cavity of a grizzly bear. Inside the nasal cavity is a vast network of tissue that looks like honey comb. These tissues create an immense amount of surface area for the processing of scent information.
START Gather
Process
Exchange Information
STOP
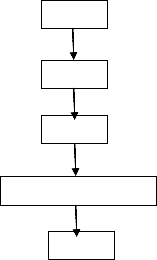
Fig.2 ABO Gist
Smell Receptors will gather and transmit the smell infor- mation.
Olfactory bulb region in brain is act and process the smell in- formation.
In the surface area of bear’s nose have tiny muscles to help them to control the smell.
Nasal cavity is the vast network to exchange the smell infor- mation.
4.1 Problem Identification
In a financial sector, They are going to introduce a new prod- uct in the market. From the huge set of customer, we need to identify the best optimal customer. The customer must be val- ued and trust worthy, since to avoid the risk in the market. We can achieve this optimal by inherit the Bear smelling sense.
4.2 Pseudo Algorithm
5 Initialize the population; xi = 1,2,…,n
6 Evaluate the Fitness function using the constraints or ob- jective function (yj )
f(x i) = ∑f(yj) where j = 1,2,3
7 Cycle = 1
7.1 Compare the x1 & x2 ; if f(x1 ) > f(x2 ) , then f(x1 ) is memo-
rized which is the best solution. [Local Maxima]
7.2 Likewise f(x1 ) is compared with the rest of the population .
7.3 Memorize the best solution ; and Best set of population is formed Zi . [Global Maxima]
7.4 Abandoned the best solution from the set xi.
IJSER © 2013 http://www.ijser.org
International Journal of Scientific & Engineering Research, Volume 4, Issue 8, August-2013 2138
ISSN 2229-5518
8 Cycle = cycle +1
9 Until the requirements are met
4.3 Implementation
Initialize the population: Xi = 1,2,3….,200
Fitness calculation:
Number of Constraints = 3
The value of 1st constraint – Age (y1 ) = 1
if 20<= y1 <=40
= 0 otherwise
The value of 2nd constraint – Income (y2 ) = 1
if 15000<= y2 <=40000
otherwise
Now the population is x=2,3,4,……………..,100
Compare f(x2 ) & f(x3 ) and the respective values are 2 & 0. To maximize f(x2 )=2
Compare f(x2 ) & f(x4 ) and the respective values are 2 & 1. To maximize f(x2 )=2
Likewise, Compare the local maxima values upto 200. Memorize the final set population is :
Zi = f(x1 ) , f(x5 ) & f(x2 ).
Deduct the f(x2 ) from the population set xi.
Finally , we’ll get the new population set Zi. The new population set will be in descending order of the fitness value from best op- timal to worst. Then pick up top n customer to identify the val- ued customer.
4.4 Performance & Analysis
= 0
Receiver operating characteristic (ROC) curve charts allow the user to visually evaluate the accuracy of a classifier and to
The value of 3rd constraint – Vintage in years (y3 ) = 1 if 3<= y3
<=5
= 0 otherwise
If the customer has all the 3 constraints, then the fitness is high.
f(x1 ) = 3 f(x2 ) = 2 f(x3 ) =0 f(x4 ) =1 f(x5 ) =3
.
.
.
.
f(200) = 2
Compare f(x1 ) & f(x2 ) and the respective values are 3 & 2. To maximize f(x1 )=3
Compare f(x1 ) & f(x3 ) and the respective values are 3 & 0. To maximize f(x1 )=3
Compare f(x1 ) & f(x4 ) and the respective values are 3& 1. To maximize f(x1 )=3
Compare f(x1 ) & f(x5 ) and the respective values are 3& 3. To maximize f(x1 )=3 & f(x2 )=3
Likewise, Compare the local maxima values upto 100. Memorize the final set population is :
Zi = f(x1 ) & f(x5 ).
Deduct the f(x1 ) & f(x5 ) from the population set xi.
compare different classification models. They visually express the information content of a sequence of confusion matrices and allow the ideal trade-off between the number of correctly classified positive observations and the number of incorrectly classified negative observations to be assessed.
An ROC chart is a two-dimensional plot with the proportion of false positives fp on the horizontal axis and the proportion of true positives tp on the vertical axis. The point (0,1) repre- sents the ideal classifier, which makes no prediction error since its proportion of false positives is null (fp = 0) and
its proportion of true positives is maximum (tp = 1). The point (0,0) corresponds to a classifier that predicts the class {−1} for all the observations, while the point (1,1) corresponds to a classifier predicting the class {1} for all the observations. Most classifiers allow a few parameters in the optimal hypothesis f
∗ ∈ F to be adjusted so as to increase the number of true
positives tp, although at the expense of a corresponding in-
crease in the number of false positives fp. To obtain the trajec-
tory of the ROC curve for a specific classifier, it is therefore
p, tp) which have been em-
ues of the parameters in f ∗
IJSER © 2013 http://www.ijser.org
International Journal of Scientific & Engineering Research, Volume 4, Issue 8, August-2013 2139
ISSN 2229-5518
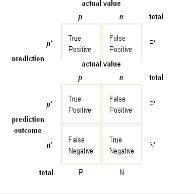
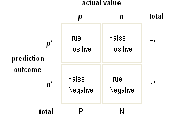
Fig. 3 ROC chart :Actual Value Vs Predictive value
True Positive = The number of predicted positive cases that are actually positive.
True Negative = The number of predicted negative cases that are actually negative.
False Positive = The number of predicted positive cases that are actually negative.
False Negative = The number of predicted negative cases that are actually positive.
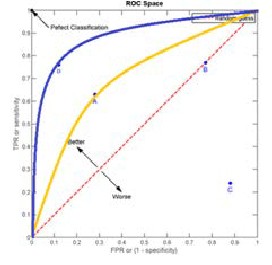
Fig.4 ROC curve chart for two classifiers; A,B,C are Manual decision Mak- ing; D is the results through ABO algorithm
4.5 Advantages of ABO
• To realize the business optimization objectives faster with less risk and at a lower cost through an effective in- formation strategy.
• Improve decision-making, productivity and efficiency through an environment where relevant, actionable, ac- curate and timely information is provided to monitor and improve performance.
• To establish a proactive versus reactive strategy to en- hance performance and improve operational efficiency.
• To establish agility and flexibility.
5. CONCLUSION
In the Business intelligence world, we have many problems which we have had no way to solve analytically, or problems which could be solved theoretically but actually impossible due to its necessity of huge resources and/or enormous time required for computation. For these problems, methods inspired by nature will work very efficiently and effectively. Although the solutions obtained by these methods do not always equal to the mathematically strict solutions, a near optimal solution is sometimes enough in most practical purposes.
Dispersion of information sources and decentraliza- tion of a decision making process result in insufficiency of present information management models. Metaheuristics al- gorithm is used for both Static and Dynamic Combinatorial optimization problems. Convergence is guaranteed, although the speed is unknown. Artificial Bear Optimization algorithm is inspired by the intelligent sense of smell behavior of the Bear. This algorithm is constructed by “probabilistic construc- tive” with local search algorithms yield significantly improved solution. It proposes a new way of thinking the solution of the non-linear complex problems.
REFERENCES
[1] P. Artzner, F. Delbaen, J.-M. Eber, and D. Heath. Coherent measures of risk. Mathematical Finance, 9(3):203{228, 1999.
[2] A. Atamturk. Strong formulations of robust mixed 0-1 pro- gramming. Mathematical Programming, 2005.
[3] A. Ben-Tal, S. Boyd, and A. Nemirovski. Extending the scope of robust optimization: comprehensive robust counterparts of uncertain problems. Technical report, Georgia Institute of Technology, 2005.
[4] A. Ben-Tal and A. Nemirovski. Robust solutions of linear pro- gramming problems contaminated with uncertain data. Mathemat- ical Programming, 88:411-424, 2000.
[5] Bui, T. (2000). Decision support systems for sustainable devel- opment. In G. E. Kersten, Z. Mikolajuk, & A. Gar-on Yeh (Eds.), Decision support systems for sustainable development. A resource book of methods and applications. Kluwer Academic Publishers.
[6] Charnes A., Cooper W., Rhodes E. (1978). Measuring the effi-
ciency of decision making units. European Journal of Operational
Research, 2, 429–444.
[7]Clemen R. (1997). Making Hard Decisions: An Introduction to De- cision Analysis. Duxbury Press.
[8] Gray, P., & Watson, H. (1998). Decision support in the data ware- house. Prentice Hall.
[9] Gray, P. (2003). Business intelligence: A new name or the fu- ture of DSS. In T. Bui, H. Sroka, S. Stanek,.
[10] H. P. Luhn (October 1958). "A Business Intelligence System"
(PDF). IBM Journal. Retrieved 2008-07-10.
Hogg R., Craig A., McKean J. (2004). Introduction to Mathematical
Statistics. Prentice Hall.
[11] Davis, L., ed. 1987. Handbook of Genetic Algorithms. Van Nos- trand Reinhold
[12] Dresner, H. J., Buytendijk, F., Linden, A., Friedman, T.,
Strange, K. H., Knox, M., & Camn, M. (2002). The business intelli- gence center: An essential business strategy. Gartner Research.
IJSER © 2013 http://www.ijser.org
International Journal of Scientific & Engineering Research, Volume 4, Issue 8, August-2013 2140
ISSN 2229-5518
[13] J. Birge and F. Louveaux. Introduction to stochastic program- ming. Springer Verlag, 1997.
[14]
http://idahoptv.org/dialogue4kids/season7/bears/facts.cfm
[15] http://www.grizzlybay.org/LearnMore/GrizzlyBearNose / GrizzlyBearNose.htm
[16] Kersten, G. E. (2000). Decision making and decision support. In G. E. Kersten, Z. Mikolajuk, & A. Gar-on Yeh (Eds.), Decision support systems for sustainable development. A resource book of meth- ods and applications. Kluwer Academic Publishers.
[17] Moss, L. T. & Alert, S. (2003). Business intelligence roadmap –
The complete project lifecycle for decision support applications. Addi- son-Wesley.
[18] Wijnhoven, F. (2001). Models of information markets: Analy-
sis of markets, identification of services, and design models. In- forming Science: The International Journal of an Emerging Discipline,
4(4). Santa Rosa: The Informing Science Institute. Retrieved Octo-
ber 1, 2005.
[19] Kantardzic, M. (2002). Data mining: Concepts, models, methods and algorithms. New York: J. Wiley.
[20] Macro Dorigo, The Ant System: Optimization by a colony of cooperating agents.
[21] Blumberg, R. & S. Atre "The Problem with Unstructured Da- ta", DM Review November 2003b
[22] "Gartner Reveals Five Business Intelligence Predictions for
2009 and Beyond", http://www.gartner.com/it/page.jsp?id=856714
[23 igent Optimisation Tech- niq
[24 ney bee swarm for numer- ica
TR Faculty, Computer Engi- ne
IJSER © 2013 http://www.ijser.org