International Journal of Scientific & Engineering Research Volume 2, Issue 7, July-2011 1
ISSN 2229-5518
Automating the Diagram Generation Process
Tabinda Sarwar, Uzma Arif, Wajiha Habib, Samana Zehra
Abstract— Diagrams are the key to modeling and designing software. These diagrams enable us to understand, visualize and communicate the concepts, user requirements and functionality that the software would support. Drawing diagrams or models manually and then modifying them later is time taking hence various software tools have been developed for automating this process. This paper discusses the existing tools and presents an algorithm for a software “Auto-Diagram Generator” (ADG) for generating diagrams which is better and more flexible than the existing ones. ADG allows users to generate Block diagrams, Flowcharts and ER diagrams by form-filling and by text selection. The algorithm is extended to generate ER diagrams building blocks (entities and attributes) by reading a database. Any diagramgeneration software is incomplete without providing a manual support for editing the generated diagrams.
Index Terms— Automation, Block Diagram, Diagram Generation, Drag and Drop, ER Diagram, Flow Chart, Form Filling, Text
Selection.
—————————— • ——————————
IAGRAMS play a significant role in software analy- sis and design. Diagrams are not only a good way of communicating and clarifying customer require- ments but they also help in designing and visualizing the target software to be developed. Examples of commonly used diagrams are flow charts, block diagrams, organiza- tional chart for displaying the organizational structure, network diagram of an organization, ER diagrams, dia- grams that represents trend and relationships like bar
chart, pie chart, graphs.
Among the above mentioned diagrams block diagrams
are very commonly used in software design, electronic
design, hardware design etc.
“Block diagram is a diagram of a system, in which the
principal parts or functions are represented by blocks
connected by lines, that shows the relationships of the
blocks” [1]. It captures high level details of a system and is
not concerned with low level (implementation) details.
Another commonly use diagram, that is used to depict
the steps in a process is the flow chart. A flow chart is a graphical or symbolic representation of a process. Each step in the process is represented by a different symbol and contains a short description of the process step. The
flow chart symbols are linked together with arrows show- ing the process flow direction [2].
Flowcharts are used in analyzing, designing, docu- menting or managing a process or program in various fields [3].
In today’s business world, databases are of utmost im- portance, because they hold and represent data of an or- ganization and Entity Relationship Modeling (ER model- ing) is by far the most common way to express the analyt- ical result of an early stage in the construction of a new database [4]. In software engineering ER diagrams are used to model data conceptually.
Because of the importance and frequent use, these are the three diagrams targeted by ADG and they can be gen- erated in different ways (mentioned above), keeping in
view the ease of use.
Currently, there are many software available that gener- ate different types of diagrams ranging from business to technical. Taking into account the tools that generate flow charts, block diagram and ER diagram, most of these tools use the drag drop approach. Very few of them use the concept of reading a text file (based on a special syn- tax that represents the diagram specifications) and none of them use the form filling approach used by the auto diagram generator.
Moreover, there are usability issues with most of the existing tools and they are not very user friendly. Some softwares are so complex that people with little or no knowledge avoids them and instead prefer using simple softwares like Paint.
ADG is simple and user friendly as compared to the other tools and allows diagram generation by form filling, as form filling is one of the easiest way for a novice user to specify the diagram requirements.
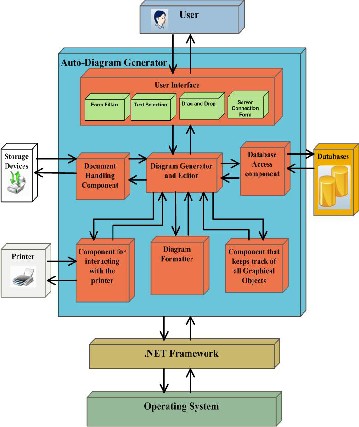
As mentioned earlier user can interact with ADG in dif- ferent ways, for all of these ways the basic internal archi- tecture of ADG remains the same (Figure 1). The “Dia- gram Generator and Editor” is the core component of this architecture. Another important component is the Data- base Access component that plays a vital role in generat- ing diagram from database directly. The Document Han- dling Component performs document handling functions e.g. save, open, new, exit etc. the component for interact- ing with the printer, as indicated by its name, is responsi- ble for printing of ADG’s documents.
IJSER © 2011 http://www.ijser.org
International Journal of Scientific & Engineering Research Volume 2, Issue 7, July-2011 2
ISSN 2229-5518
cation and then released)
Draw shape from first point to the new specified point
End If
On releasing the left button of the mouse
Add shape to the Link List
Mode = none
If (mouse left button is down and the Mode != Draw)
If (Cursor is on a graphical object) Find selected graphical object
If (current point is a part of the shape) Mode = select
Current object is selected
Tracker of selected graphical object is drawn
Update DrawingImage
End If
End If
End If
Else
DrawingImage is Refresh
End Else
If (mouse is moving and mouse’s left button is depressed) If (mode == select)
If (Cursor is inside graphical object)
Move selected object to new location Update selected object in link list Redraw tracker of selected object Update DrawingImage
Mode = none
Figure 1. System Architecture of ADG
This component is responsible for generating diagram based on user inputs, and eventually when diagram is edited the same component is active. DGE uses three different algo- rithms two of them are presented below. The approaches for generating diagrams from form-filling, text selection and from database are based on this component.
ponding to various key and mouse events.
The general algorithm for DGE is presented below that
generates diagram by drag drop methodology and also
supports diagram editing. The diagram is represented as
bitmap image.
On Initialization (before drawing begins)
DrawingImage (bitmap image) is initialized as empty image
Mode = none
ListsNode = Empty
On selecting a button for graphical object that has to be drawn
Mode = draw
If (mouse left button is depressed/down and without move- ment is released)
Draw default sized shape
End If
If (mouse left button is depressed/down and moved to a lo-
End If
ElseIf (Cursor is on the rectangles of tracker image) Resize object to new location
Update selected object in link list
Update DrawingImage
Draw tracker of selected object
Mode = none
End Else If
End If
Else
Refresh DrawingImage
End Else
End If
Select shape ( from a drop down list).
Enter Text for the shape.
Hit “Add New Element” Button (if more shapes are to be added to the diagram)
Otherwise hit the “Click” Button.
Integers “X” and “Y” are initialized with (0,0) position.
On hitting the “Click” Button
o New node is created in the link list
If list is empty, a list head is created with
next and previous elements initialized with null.
Else a list tail is created with next element in-
IJSER © 2011 http://www.ijser.org
International Journal of Scientific & Engineering Research Volume 2, Issue 7, July-2011 3
ISSN 2229-5518
itialized with null.
o Shapes and their respective text are added to the
Link List.
o Their positions (x and y coordinates) are specified by proper increments and decrements in “X” and “Y”.
DrawingImage is updated. Repaint DrawingImage.
For connecting the graphical objects following steps are followed:
Select one graphical object “g1” Select second graphical object “g2’
Press button to create the connecting line.
A line is drawn from “g1” tracker image rectangle” cen- ter_Right” to “g2” tracker image rectangle “cen- ter_Left”.
A new node is created for line in the link list and point “center_Right” and “center_Left” are stored in the node. If list is empty, a list head is created with next and pre- vious elements initialized with null.
Else a list tail is created with next element initialized with null.
Update DrawingImage. Repaint DrawingImage.
These algorithms can be extended to generate basic enti-
ties and attributes of ER diagram from reading a database
directly.
The below mentioned algorithm also resides on the DGE
component.
Enter server name. Enter database name.
Create connection with the database
o If connection.open() is successful then connection is created.
o Else report connection failure and return.
o Total number of tables “count” is extracted from
the database.
o A loop for “i” continues from i=0 to i<count
Start
Initialize x=0, y=0 and z=0
A loop that continue from i=0 to i<count (total num- ber of tables)
Start
o If(x = DrawingImage.X or x > DrawingImage.X)
o Set x=0
o Set y=200
o EndIF
o New node”Ent” for TABLE[i] is created in the
link list
If list is empty, a list head is created with next and previous elements initialized with null
Else a list tail is created with next element initialized with null.
Ent.text=TABLE[i] Ent.location = (x, y) Ent.shape = Rectangle
Ent.size = (width=50, height=50)
z = y + 100
o New node ”Att” for Primary[i] is created in the link list.
If list is empty, a list head is created with next and previous elements initialized with null.
Else a list tail is created with next element initialized with null.
Att.text = Primary[i] Att.text = Primary[i] Att.location = (x, z) Att.shape = Ellipse
Att.size = (width=50, height=50)
o New node “line” for connecting entity and attribute is created in list
If list is empty, a list head is created with next and previous elements initialized with null.
Else a list tail is created with next element initialized with null.
line.start = point (Ent.X + (Ent.Width / 2), Ent.Y + Ent.Height)
line.end = point (Att.X + (Att.Width / 2), Att.Y)
o Store each table in array “TABLE” as TABLE[i]
o Extract the total number of attributes “att_count”
from TABLE[i].
o A loop for “j” that continues till “att_count” Start
� Store attributes of each table in two
dimensional array “ATTRIBUTE”
as ATTRIBUTE[i][j].
� If ATTRIBUTE[i][j]==primary key
of TABLE[i]
� Set “Primary” array entry as Prima-
ry[i]=ATTRIBUTE[i][j]
End
Update DrawingImage
Repaint DrawingImage
The database tables and its attributes can be easily retrieved
by using OLEDB libraries.
ADG provides different ways to generate diagrams, which makes it usable for a wide range of users. Because of its flexible and efficient algorithm ADG can be ex- tended to accommodate many different diagrams.
End
End
IJSER © 2011 http://www.ijser.org
International Journal of Scientific & Engineering Research Volume 2, Issue 7, July-2011 4
ISSN 2229-5518
[1] SEVOCAB, “Software and Systems Engineering Vocabu- lary,”BlockDiagram, http://pascal.computer.org/serv_display/search.action,jsessio nid=D67885F1679F640CAC6C54EE187A6480. April 2011.
[2] Nicholas Hebb, Flow Chart http://www.breezetree.com/articles/what-is-a-flow- chart.htm. April 2011.
[3] SEVOCAB, “ Software and Systems Engineering Vocabulary,” http://pascal.computer.org/sev_display/search.action;jsession id=989BD03B195021410505EFB99050FCFF. April 2011.
[4] Peter Chen, “Entity Relationship Modeling,”
http://www.devarticles.com/c/a/Development-
Cycles/Entity-Relationship-Modeling/. April 2011.
IJSER © 2011 http://www.ijser.org