International Journal of Scientific & Engineering Research, Volume 4, Issue 12, December-2013 523
ISSN 2229-5518
Assessing Vertical Accuracy of SRTM Ver 4.1 and ASTER GDEM Ver 2 Using Differential GPS Measurements – Case Study in Ondo State Nigeria
Odutola Christian Amans, Prof. Wu Beiping, Yao Yevenyo Ziggah
Abstract— Digital Elevation Model (DEM) vertical accuracy is usually achieved by its comparison with elevation of well-defined Global Positioning Sys- tem (GPS) ground control points. This accuracy varies spatially because of the various sources, from which they were derived, thus warrants the need for specific testing of their level of compliances for geomatic applications. This paper therefore investigates the quality of vertical accuracy of two DEMs covering Ondo state Nigeria. The DEMs which are currently dataset of choice from; Advanced Spaceborne Thermal Emission and Reflection Radiometer (ASTER) and Shuttle Radar Topographic Mission (SRTM), were assessed based on two independent GPS ground control points from two regions of the state. From the statistical analysis carried out, it was observed that in the mountainous region A, the Root Mean Squared Error (RMSE) was quite small for SRTM DEM; ±7.75 compared to ASTER DEM; ±12.72, while in the less mountainous region B, it was ±14.48 for SRTM and ±13.25 for ASTER. A 3D model of both DEMs compared with the referenced GPS data, revealed that ASTER DEM projects terrain features better than SRTM DEM. The results from both assessments revealed their level of suitability for geomatics application for the concerned region of the State.
Index Terms— Digital Elevation Model (DEM), Referenced GPS, Vertical Accuracy, SRTM, ASTER
1 INTRODUCTION
—————————— ——————————
IJSER
igital Elevation Models (DEM) are important data source
for geomatic applications such as geoid modeling, digital generation of topographic cartography parameter, hydrologi- cal studies, geomorphology, orthorectification of aerial image- ry and many more. They can be developed from ground sur- vey, airborne photogrammetric imagery, airborne laser scan- ning (LIDAR), radar altimetry and interferometric synthetic aperture radar (InSAR). Base on the different methods from which they are sourced, there is a higher tendency of variabil- ity in their data quality [8]. However, the use of high quality DEM for geodetic surveys can not be over emphasized. This is because high quality DEM can reduce the difficulty of remote- ly sensed image classification while increasing the classifica- tion accuracy [9]. It is worth mentioning that DEM serves as a main source of surface height information [26] for geospatial professionals. Therefore high precision and fine resolution global covered DEM can therefore be considered as good data for land cover mapping project.
For over a decade, considerable progress in DEM has been made with the release of SRTM (Shuttle Radar Topographic Mission), and ASTER (Advanced Spaceborne Thermal Emis- sion and Reflection Radiometer). The DEM data from these two space missions considerably improve the knowledge of the Earth’s surface in regions with poor geospatial infrastruc- ture like Ondo State Nigeria.
The ASTER Global Digital Elevation Model (GDEM) covers
land surfaces between 83°N and 83°S. The data which are in geographic decimal coordinates (latitude and longitude) are posted on a 1 arc-second (approximately 30-m at the equator)
grid, distributed as 1° x 1° tiles and referenced to the World
Geodetic System (WGS84)/1996 Earth Gravitational Model (EGM96) geoid. It has an overall accuracy of around 17m at the 95% confidence level, evaluated by the ASTER GDEM val- idation team [1]. Its preferable choice for this research is be- cause of the additional scenes that has been added to reduce artifacts, higher horizontal resolution using a smaller correla- tion kernel (5 x 5 versus 9 x 9 used for GDEM 1.0), and an im- proved water mask. Also, a 5-m overall bias observed in GDEM 1.0 was removed in this version 2.
The SRTM version 4.1 from the USGS/NASA SRTM data co-

vers up to 60 °N to 56 °S of the earth land surfaces. It is pro- vided to promote the use of geospatial science and applica- tions for sustainable development and resource conservation in the developing world. The data was made available at 1-arc second resolution (approximately 30m at the equator) for the United States, but for the rest of the world the 1-arc second product is degraded to 3-arc seconds (approximately 90m at the equator) DEM. The DEM has a vertical error reported to be less than 16m and it is available in 5 degree x 5 degree tiles, in Geographic decimal degrees (Latitude and Longitude) projec- tion, with WGS84 horizontal datum and EGM96 vertical da- tum. This SRTM version 4.1 was chosen for this research over the previous version because it has been updated, and then released after using sophisticated interpolation and hole- filling algorithms which make use of ancillary data sources where they are available[23].
Moreover several publications on the accuracy of SRTM 90m
resolution elevation data, affirm that its absolute vertical accu-
IJSER © 2013 http://www.ijser.org
International Journal of Scientific & Engineering Research, Volume 4, Issue 12, December-2013 524
ISSN 2229-5518
racy is in the order of ± 16m [11],[13],[14].These accuracies
value have been extensively tested in different regions under different terrain characteristics by many researchers [7],[2],[6]. Some research work has been conducted in the area, but Ondo State Nigeria is yet to fully utilize the potential of these global DEMs in their survey and mapping activities. Scientific find- ings conclude that the values obtained vary from the specified range, and therefore advocating for regional evaluation of these vertical accuracy is of essence. This will further aid in revealing which of these DEMs is best suitable for substitute of the old existing 1:50000 topographic maps of the concerned region, since DEM has hitherto be known as a qualitative model of topographic surface in digital form, hence the need for this research in the study area.
2.0 Study Area
The study area lies between Latitudes 40 15’ E and 60 45’ E and Longitudes 60 45’ N and 80 30’ N. It is a state in the South- Western part of Nigeria, with a total area of: 14788.723 sq kil- ometers which covers low-level, midlevel and high-altitude terrain with elevation ranging from 288m to 414m in region A and 9m to 118m in region B as shown in figure1 below. In the
state, there are several mountains and hills which present ex-
the GPS ground control point’s distribution of the two regions.
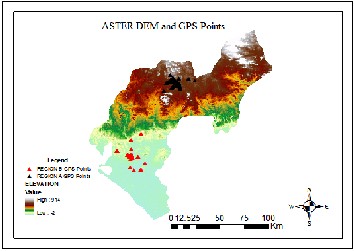
Figure 2: Map showing ASTER DEM and GPS Points
posed rock surfaces at the north central and up towards the north east, while the southern part is closed to the Atlantic Ocean. The mean elevation for region A and B are 61m and
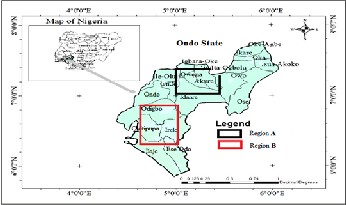
367m above mean sea level.
Figure 1. Map of Ondo State showing the two regions
3.0 Datasets
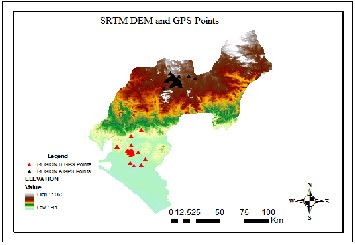
The ASTER DEM in Figure 2 corresponds to Ondo state area. It was downloaded from https://earthdata.nasa.gov/user- mgmt/, while the SRTM DEM in figure 3 which also corre- sponds to the same area was downloaded from http://srtm.csi.cgiar.org. A total number of six scene of ASTER and two scenes of SRTM DEM were used in this re- search. A total number of 119 and 118 differential GPS points for region A and B, were obtained from the Survey Depart- ment, Ministry of Lands, Housing and Environment, Akure, Ondo State, Nigeria. These dataset points were used to judge the accuracy of the DEM for both regions. Figure 4 and 5 show
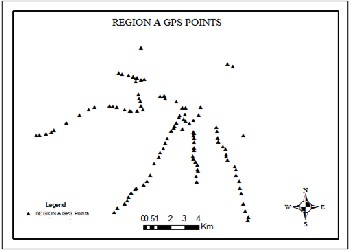
Figure 3: Map showing SRTM DEM and GPS Points
Figure 4: Map showing region A GPS Points
IJSER © 2013 http://www.ijser.org
International Journal of Scientific & Engineering Research, Volume 4, Issue 12, December-2013 525
ISSN 2229-5518

uals, and the RMSE serves to aggregate them into a single measure of predictive power;
2
RMSEV =
n
i vi
……………..………. (1)
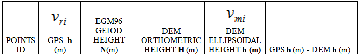
evi = vri − vmi
Where;
………………………….. (2)
vri = The reference GPS elevation at the ith point
vmi =
The DEM elevation at the ith point
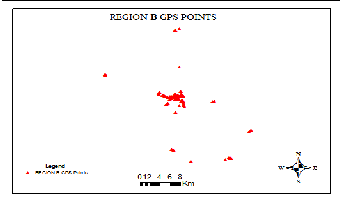
Figure 5: Map showing region B GPS Points
4.0 Materials
The processing and visualization of the data was carried out with six software which includes; Matlab for coordinate con- version and transformation, and then profile analysis display, ArcGIS 10 for mosaicing and processing of the DEM, and then checking the GPS points distribution, Surfer for 3D modeling, SPSS/Microsoft excel for the statistical analysis and NIMA EGM96 calculator ver1.0 was used to obtain GPS geoidal
height since both DEM height are referenced to
n = The number of points [22]
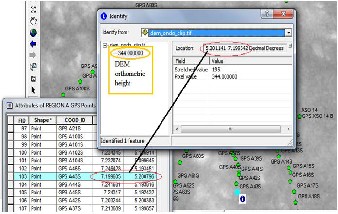
Extracting the DEM height requires overlaying the GPS points on them, and then the height value from the two data at their position of coincidence gives the DEMs orthometric height for computing the accuracy statistic. The identification tool in ArcGIS was used for the DEM height extraction as shown be- low in figure 6. The extracted heights from the two DEM are orthometric height
WGS84/EGM96 geoid.
IJSER
5.0 Processing Methodology
The DEM scenes of ASTER and SRTM were independently mosaicked, and then Ondo state shapefile was overlaid on the mosaic DEM, followed by a clip operation which was carried out to extract the relevant portion of the DEM that falls within the boundary of Ondo state. Further processing was done to clearly reveal the spatial pattern of the topography. All these were done using ArcGIS 10.The transformation of all the data sets into a common system was inevitable to guarantee the desired result; the GPS data in their projected Earth Centered Earth Fixed (ECEF) form were transformed into Latitude and Longitude WGS84 system using Bowring inverse equation cited in Gerdan and Deakin, 1999. A computer programming algorithm was written in matlab to facilitate the transfor- mation before using the NIMA EGM96 calculator to compute each point geoidal height since both DEM heights are refer- enced to WGS84/EGM96 geoid.
6.0 Determining the Absolute Vertical Accuracy of the DEMs
In mapping application, vertical accuracy is computed by ver- tical Root-Mean-Squared Error (RMSE) (also called the root mean square deviation, RMSD). This mathematical relation has been widely adopted since in the late 1970s, when the American Society for Photogrammetry and Remote Sensing’s (ASPRS) Specifications and Standards Committee, cited in Greenwalt and Schultz (1962) and Greenwalt and Schultz (1968) in establishing RMSE as the pivotal map accuracy pa- rameter [22]. It measures the difference between the values of the DEM elevations and the values of referenced GPS eleva- tions. These individual point differences are also called resid-
Figure 6: DEM height extraction
The following relationship was used to calculate the DEM el- lipsoidal height before comparing with the GPS heights to get their difference:
h = H + N …………………….. (3) Where,
h = WGS84 Ellipsoid heig
H = Orthometric or Mean Sea Level height
N = EGM96 Geoid undulation or Geoid separation
In this research context, the position of equation 2 and 3 pa- rameters in computing the RMSE for each of the DEM can be well understood in table 1 below.
Table1: Positions of Equation 2 and 3 Parameters in the Vertical
Accuracy Computation
The DEM geoidal height information was computed using the
NIMA EGM96 calculator after imputing the GPS latitude, lon-
IJSER © 2013 http://www.ijser.org
International Journal of Scientific & Engineering Research, Volume 4, Issue 12, December-2013 526
ISSN 2229-5518
gitude and geodetic height data, before calculating the DEM
ellipsoidal height with equation (3). The derived DEM ellip- soidal height was subtracted from the GPS ellipsoidal height to compute the vertical accuracy for both regions. Below is a flow chart of the entire process;
Table 3: SRTM vs GPS Statistical Analysis for Region A.
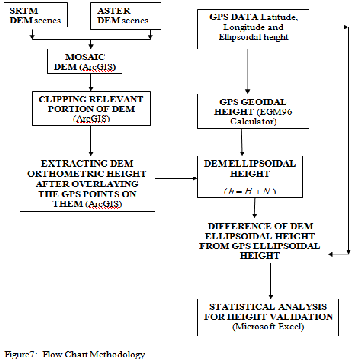
Table 4: ASTER vs GPS Statistical Analysis for Region B.
The statistical analysis for thIe entirJe process of tShe height vali- ER
dation for both regions is summarized in tables 2 to 5. In sta-
tistical computation of positional accuracy, the expected error is usually estimated by the root-mean-square error, or RMSE, while the standard deviation σ is the square root of the pop-
ulation (data) variance which measures how much the varia- bles of a population (data) deviate from the population (data)
Table 5: SRTM vs GPS Statistical Analysis for Region B.
mean. The standard error σ µ
measures how estimates of the
population (data) mean deviated from the true mean [22]. The results show that the absolute vertical accuracy of ASTER and SRTM for region A is ±12.72 and ±7.75, while that of region B is
±13.25 and ±14.48.
Table 2: ASTER vs GPS Statistical Analysis for Region A
A further analysis to test the relationship of both DEM and the referenced GPS elevation was carried out using linear regres- sion. Figure 8 below show the measure of association through their goodness of fit, R2 and correlation coefficient (r) values.
IJSER © 2013 http://www.ijser.org
International Journal of Scientific & Engineering Research, Volume 4, Issue 12, December-2013 527
ISSN 2229-5518
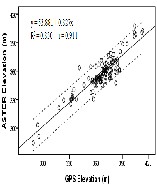
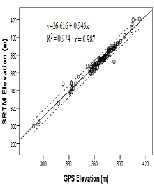
Table 6: R2 and r Statistic computed values.
REGION A |
SCATTER PLOTS | R2 | r |
Aster Elevation (m) against GPS Eleva- tion (m) | 0.8301 | 0.911 |
SRTM Elevation (m) against GPS Eleva- tion (m) | 0.974 | 0.987 |
REGION B |
SCATTER PLOTS | R2 | r |
Aster Elevation (m) against GPS Eleva- tion (m) | 0.627 | 0.792 |
SRTM Elevation (m) against GPS Eleva- tion (m) | 0.614 | 0.784 |
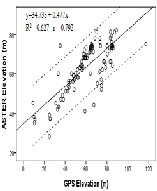
The values of R2 (table 6 above) help to interpret the relation- ships exiting between the variables (DEMs and GPS elevation)
in terms of variations. That is, from table 6 above, Region A and Region B in the graph of ASTER elevation against GPS elevation had 0.8301 and 0.627. These R2 values indicate that
83.01% and 62.7% of the changes in Aster elevation are ex- plained by the change of GPS elevation. In the case of SRTM
Figure (c) : A graph of
Aster Elevation (m)
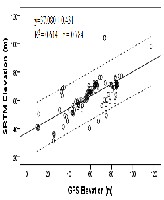
F
igure (d) : A graph of SRTM
elevation against GPS elevation data, 97.4% and 61.4% of the changes in the SRTM elevation and GPS elevation could be explained for Regions A and B respectively. The closer R2 is to
1, then there is an indication that the data points lie close to
Figure 8: Scatter Plot depicting DEM elevation as a function of
GPS elevation for both regions.
The graphs in figures 8a, 8b, 8c, 8d above reveal a linear and
positive slope between both DEMs (Aster and SRTM) and GPS
elevation for the two regions. The existence of this positive relationship (slope) between the two variables (DEMs and GPS elevation) points out that both variables are moving in the same direction. Also, the graphs (figure 8 above) also show the
95% confidence limits for the regression analysis revealing the
out layers of points that fell outside the 95% prediction region for the regression. The deterministic model (R2) and the corre- lation coefficients (r) between the variables were calculated and the results are shown in Table 6 below respectively.
the least square line. This can be seen in Figure 8 above. With reference to Table 6 above, it can be seen that the R2 value for Region A are relatively closer to 1. This means that the linear regression analysis performed to estimate the R2, comparative- ly, describe the variation in the data with reliable accuracy for Region A than Region B. The coefficient of correlation (r) fur- ther corroborated this high strength of linear dependence be- tween the variables.
In this study, the correlation coefficient (r) was used as a crite-
rion to determine the strength and nature of the linear rela- tionship between the two DEMs (aster and SRTM) and the referenced GPS elevation. The results in table 6 above revealed a very high positive correlation between both DEMs and GPS elevation for regions A and B respectively. Comparatively, it was also noticed that the strength of the relationship for Re- gion A in the linear regression analysis carried out were stronger than that of Region B. This shows that a stronger rela- tionship exist between the DEMs and GPS elevation in Region A than in Region B. Furthermore, this strong correlation is backed up with the observation that vertical accuracy of DEMs
IJSER © 2013 http://www.ijser.org
International Journal of Scientific & Engineering Research, Volume 4, Issue 12, December-2013 528
ISSN 2229-5518
are better predicted in mountainous regions compared to less
mountainous regions as in the case of Ondo State, Nigeria.
7.0 The Correlation Confirmatory Test
To further confirm the degree of linearity (correlation) be- tween the two DEMs and GPS elevation for both regions, a test of hypotheses (t-test statistic) at 5% significance level was con- ducted on the correlation coefficients determined.
Testing of Hypothesis: Both DEMs (Aster and SRTM) do not
have any correlation with GPS elevation,
Null Hypothesis: H0 : ρ = 0
Alternative Hypothesis: H1 : ρ ≠ 0

Significance Level: α = 0.05
n − 2
enced GPS is less compare to ASTER; confirming its vertical
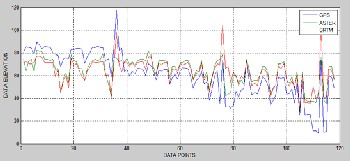
accuracy value. It is also clear that SRTM over estimated the referenced GPS while ASTER underestimated it. In region B, there is a striking observation. The two DEM tends to agree more with each other showing the same approximate extent of deviation from the referenced GPS. Both DEM under estimat- ed the referenced GPS to a particular point as shown on figure
10, and from that point to the end of the trend, over estimated
the GPS point, and also show the same approximate extent of deviation from the referenced points.
Test Statistic: t = r
Where;
1 − r 2
r = correlation coefficient (refer to table 2 above)
n = number of observations; n= 119 for region A and 118 for
region B
Decision Rule: Reject H0 if

 t
t  > t(α
> t(α
2,n−2)
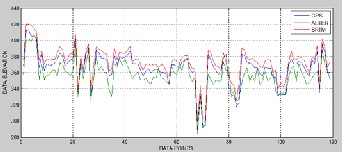
Figure 9: Datasets Elevation Profile for Region A

Conclusion: If the calculated  t
t  is greater than t(α
,n−2) , reject
IJS2 ER
the null hypothesis and vice versa.
From the student t- distribution tables the following critical
values were obtained:
1.9806.
t(0.025,117) = 1.9805 and
t(0.025,116) =
Table 7: Computed t-test (  t
t  ) value for correlation coefficient.
REGION A |
Aster Elevation (m) vs.GPS Elevation (m) | 23.90642 |
SRTM Elevation (m) vs.GPS Elevation (m) | 66.20997 |
REGION B |
Aster Elevation (m) vs.GPS Elevation (m) | 13.96689 |
SRTM Elevation (m) vs.GPS Elevation (m) | 13.59099 |
The calculated  t
t  values obtained (table 7 above), exceeds the appropriate critical values t(0.025,117) = 1.9805 and t(0.025,116) =
1.9806. Judging from the t-test values, it can be concluded that
the data provides convincing evidence that there is a relation-
ship between DEMs (Aster and SRTM) and GPS elevation.
These results further confirm that the correlation coefficients values obtained are statistically significant. Hence, H0 : ρ = 0 is rejected and H1 : ρ ≠ 0 is accepted.
Figures 9 and 10 represent an elevation profile developed from the various sources of data. Both plots show harmonious trend among the three dataset and also indicate level of DEM profile line relative to the referenced GPS data. A visual inspection from region A reveals that SRTM deviation from the refer-
Figure 10: Datasets Elevation profile for region B
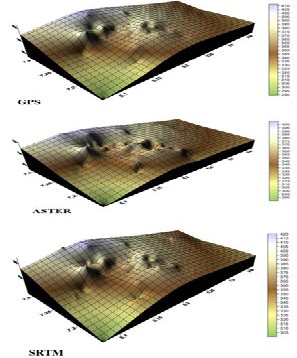
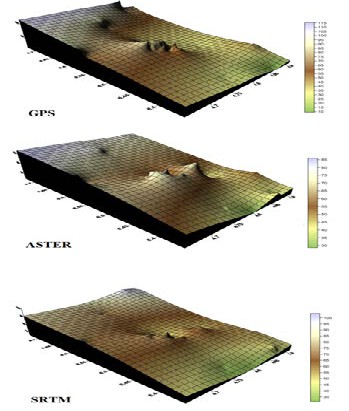
A 3D analysis was also carried out to know how both DEM represents the concerned regions relative to the referenced GPS. Although the three dataset used for the research were not obtained exactly the same period of time. But from clear ob- servation from region A, ASTER reveals features of terrain better than SRTM and even the referenced GPS data, showing its affinity for mountainous region. But in region B, the refer- enced GPS represents the terrain better compare to both DEM.
IJSER © 2013 http://www.ijser.org
International Journal of Scientific & Engineering Research, Volume 4, Issue 12, December-2013 529
ISSN 2229-5518
Figure 11: Region A 3DView of the referenced GPS data and
8.0 Conclusion
The height quality of current DEM datasets of two space mis- sions, ASTER and SRTM, has been investigated on Ondo State terrain. The DEM qualities which are considered appropriate for geomatics application were compared in mountainous and less mountainous region of the state. Their vertical accuracy in comparison with differential GPS ground control points for mountainous region A is ±12.72 for ASTER and ±7.75 for SRTM in terms of their RMSE. While for less mountainous region B is
±13.25 for ASTER and ±14.48 for SRTM. The good accuracy in
region A is possibly ascribed to the fact that the GPS ground control points are located on less vegetated hills as compared to region B. Although the vertical accuracy of SRTM is better than ASTER in region A, the 3D model of the latter shows that it brings out terrain features better than the former.
The vertical accuracy obtained from these DEM in the con-
cerned study area has indicated that SRTM can be used to de- velop topographic map with contour interval not less than
25m interval in region A, since vertical accuracy standard re- quires that the elevation of 90% of all points tested must be correct within half of the contour interval as stated in scientific findings. Based on the values of the obtained vertical, these
the two DEM
DEM can be used for other geomatic applications for both re-
gions depending on the accuracy demanded.
9.0 Acknowledgement
The author is highly indebted to China University of Geosci- ences (Wuhan), National Commission for Museums and Mon- ument Nigeria and The Department, Ministry of Lands, Hous- ing and Environment, Akure, Ondo State in Nigeria.
10.0 References
[1] Advanced Spaceborne Thermal Emission and Reflec- tion Radiometer (ASTER), (2011) Global Digital Eleva- tion Model (Gdem) Version 2.
[2] Brown, C. G., Sarabandi, K., and Pierce, L. E., 2005, Validation of the Shuttle Radar Topography Mission Height Data.
[3] Charles G & Brown Jr. (2005) Validation of the Shuttle
Radar Topography Mission Height Data .
[4] Chris Kiser L & Michael Kelly J. (2010) Gps- Vs. Dem- Derived Elevation Estimates from a Hardwood Dom- inated Forest Watershed.
Figure 12: Region B 3DView of the referenced GPS data and the two DEM
[5] Gerald Forkuor & Ben Maathuis. (2012) Comparison
of SRTM and ASTER Derived Digital Elevation Mod- els over two Regions in Ghana – Implications for Hy- drological and Environmental Modeling .
IJSER © 2013 http://www.ijser.org
International Journal of Scientific & Engineering Research, Volume 4, Issue 12, December-2013 530
ISSN 2229-5518
[6] Gorokhovich Y & Voustianiouk A. (2006)Accuracy as-
sessment of the processed SRTM-based elevation data by CGIAR using field data from USA and Thailand and its relation to the terrain characteristics.
[7] Giacomo Falorni, Vanessa Teles, Enrique R. Vivoni, Rafael L. Bras, and Kevin S. Amaratunga,2005, Analy- sis and characterization of the vertical accuracy of digital elevation models from the Shuttle Radar To- pography Mission.
[8] Hirt C, Filmer M. S, & Featherstone W. E. (2010) Comparison and Validation of the Recent Freely-Available ASTER GDEM Ver1, SRTM Ver4.1
And GEODATA DEM-9S Ver3 Digital Elevation
Models Over Australia.
[9] Jacobsen K. & Passini R. (2004) Analsysis of ASTER GDEM Elevation Models.
[10] Karsten Jacobsen. (2010) Comparison of ASTER
GDEMS with SRTM Height Models.
[18] Ozah A. P & Kufoniy O. ( 2008) Accuracy Assessment of Contour Interpolation from 1:50,000 Topographical Maps and SRTM Data For 1:25,000 Topographical Mapping.
[19] Olalekan Adekunle Isioye & Jobi N Paul. (2011) An Assessment of Digital Elevation Models (Dems) from Different Spatial Data Sources.
[20] OLAMIJU Isaac Oluwadare & OLUJIMI Julius. (2011) Regional analysis of locations of public educational facilities in Nigeria:The Akure region experience.
[21] Peng Lia, Chuang Shi, Zhenhong Li, Jan-Peter Muller, Jane Drummond, Xiuyang Li, Tao Li, Yingbing Li & Jingnan Liua. (2012) Evaluation of ASTER GDEM Ver2 Using GPS Measurements And SRTM Ver4.1 In China.
[22] Russell G. Congalton & Kass Green. (1999) Assessing
The Accuracy Of Remotely Sensed Data Principles
IJSER
[11] Koch. A., Lohmann, P. (2000), Quality assessment and
validation of digital surface models derived from the
Shuttle Radar Topography Mission (SRTM).

[12] Mirza M , Dawod G & AlGhamdi K. (2011) Accuracy and relevance of Digital Elevation Models for Geo- matics applications A case study of Makkah Munici- pality, Saudi Arabia.
[13] Miliaresis, G. Ch., & Paraschou, C. V. E. (2005). Verti- cal accuracy of the SRTM DTED level 1 of crete. Inter- national Journal of Applied Earth Observation and Geoinformation.
[14] Muller, J. P. (2005). Quantitative assessment of C-band and X-band SRTM datasets over the CEOS-WGCV- TMSG test sites and intercomparison of Cband DEM with the OS:emoji: PANORAMA DTM.
[15] NASA’s Earth Observation System Data and Infor- mation System” https://earthdata.nasa. gov/user- mg mt/ as accessed on 20th June 2013.
[16] National Digital Elevation Program (NDEP). (2004) Guidelines for Digital Elevation Data Version 1.0 .
[17] Nikolakopoulos K. G, Kamaratakis E.K & Chrysou- lakis N. (2006) SRTM Vs ASTER Elevation Products. Comparison for two Regions in Crete, Greece.
And Practices. ISBN 978-1-4200-5512-2.

[23] SRTM 90m Digital Elevation Database v4.1. http://www.cgiar-csi.org/data/srtm-90m-digital- elevation-database-v4-1, as accessed on 30th of Sep- tember, 2013.

[24] SRTM 90m Digital Elevation ta http://srtm.csi.cgiar.org, as accessed on 20th June,
2013.
[25] The CGIAR consortium for Spatial Information CGIAR-CSI http://www.google.com/gadgets/ direc- tory?synd=earth&id=834438802814, as accessed on 4th June, 2013.
[26] Zielin´ski R. & Chmiel J. (2007) Vertical accuracy as- sessment of SRTM C-band DEM data for different ter- rain characteristics.
Authors

Christian Odutola Amans is a Masters student in Surveying and Mapping Engineering at China University of Geosciences (Wuhan). Chris received his Post Graduate Diploma (PGD) in Statistics from Federal University ofTechnology Aku- re,Ondo State and a first Degree in Surveying
and Geoinformatics at Auchi, Edo State, Nigeria. He is a sur-
veyor to NCMM, Nigeria. His current research interests are;
IJSER © 2013 http://www.ijser.org
International Journal of Scientific & Engineering Research, Volume 4, Issue 12, December-2013 531
ISSN 2229-5518
Information System for Surveying and Mapping and Theory
of GPS Positioning and its Application. obydukwe@yahoo.co.uk

Wu Beiping is a Professor in Faculty of Infor- mation Engineering. He is in the Department of Surveying and Mapping Engineering of China University of Geosciences. His area of interest in
the field of research includes; Information System for Survey-
ing and Mapping and Theory of GPS Positioning and its Ap- plication.

Ziggah Yao Yevenyo is Masters degree holder in Geodesy and S u r v e y Engineering from China University of Geosciences (Wuhan).Received his B.Sc.degree from University of Mines and Tech-
nology Ghana. His current research interests are in reference
frames, gravity field determination and geoid modeling.
IJSER
IJSER © 2013 http://www.ijser.org