International Journal of Scientific & Engineering Research, Volume 5, Issue 2, February-2014 30
ISSN 2229-5518
Applying “SEVALERPS” a Systematic Evaluation
Method for ERP selection in a Public
Administration’s Case Study
Abdelilah Khaled, Mohammed Abdou Janati-idrissi, Boutaina Chakir, Badr Elmir i
Abstract— Enterprise Resource Planning (ERP) systems’ evaluation is an important activity to undertake in any ERP acquisition project. Empirical research has shown that selecting an inappropriate ERP system is a major reason for its implementation failure. Actually, inadequately selected ERP systems may affect companies’ market share and increase implementation time, effort and cost relating to these solutions. These negative impacts could even jeopardize the very existence of large organizations. A review of relevant literature has identified a need for methodologies, methods and approaches which could assist organizations in the risky, time consuming and complex activity of ERP selection. In this regard, we have developed in our previous works a systematic method, called SEVALERPS (Systematic EVALuation for ERP Systems), to help organizations to choose among the available ERP solutions, the ones that could best fit their requirements. This paper aims to validate the SEVALERPS method by applying it in a public administration’s case study. This case study helps to illustrate the method and to discuss its added value.
Index Terms— Choquet Integral, ERP Evaluation, ERP Functional coverage, ERP Performance Indicators, ERP Selection, ERP Tailoring, MACBETH, Multicriteria Analysis
1 INTRODUCTION
—————————— ——————————
n Enterprise Resource Planning (ERP) system is an enterprise software solution destined to integrate and streamline the main processes relating to different business domains within organizations. It is an industry concept that aims to enable organizations to implement their competitive strategies and to achieve operational flexibility by pulling their key business functions to work together more efficiently. According to [1], many organizations around the world have shifted from developing in house business systems to purchasing ready to use business solutions such as ERP systems. The main reason behind this is their tendency to gain a competitive edge or to sustain their market share in a highly severe market competition, by adopting the best world wide practices embedded in such solutions. Shakir and Maha [2] argue that even if the decision of undertaking an ERP project is not purely financial, its implementation remains costly and complex. Actually, the magnitude of such large capital investment projects let them highly risky and could therefore jeopardize the very existence of even large organizations. In fact, despite the significant amounts invested in ERP systems, many firms claim that they haven’t received the real business value expected from them after putting them in place, while others consider the task of accurately estimating the payoffs that could be bestowed from such systems as a thorny issue [3]. This significantly explains why
ERP projects are often considered as a pure loss.
The choice of the right ERP is obviously one of the most critical factors on which depends the success of its future implementation. Furthermore, the research that has previously been done to address the high failure’s rate of such projects, by ignoring the pre-implementation stage of the acquisition process, hasn’t yet brought satisfactory results [4].
Actually, many organizations seem to be ill-equipped to select the most promising solutions that could fit their
requirements. In this regard, there is a prominent need for suitable evaluation methodologies, methods and approaches to select ERP solutions to help them to make their choices.
A literature review and classification of enterprise software selection approaches conducted by [5] reveals that the past research pertaining to ERP packages addresses, in general, the following aspects: evaluation and selection processes, evaluation models and techniques, selection criteria, automation tools supporting the proposed methods.
However, according to [6], [7], among the most relevant criticism leveled at these approaches we find that 1) the existent approaches don’t take into account during the evaluation stage that ERP products are customizable piece of software. Hence, they don’t provide any systematic technique to assess the effect of their tailoring on their performances, 2) the most widely used multi-criteria evaluation models to aggregate selection team’s preferences on the selection criteria (for instance WSM (Weighted Sum Mean) or AHP (Analytic Hierarchy Process) [8]) are mainly based on additive aggregation functions which assume that evaluation criteria must be mutually independent. Actually, such assumptions are often unrealistic in practice.
In this regard, we have developed earlier a systematic
method for evaluating ERP systems, called SEVALERPS
(Systematic EVALuation for ERP Systems) [7], which
addresses the highlighted shortcomings of the existent approaches. This method aims to help organizations to choose
among the available ERP systems, the ones that best fit their requirements.
This paper presents a public administration’s case study that we undertook to illustrate SEVALERPS and to discuss its added value. It reports the experience while applying it in a real context. Section 2 of this paper describes in a nutshell the SEVALERPS method. Section 3 exposes the background of
IJSER © 2014 http://www.ijser.org
International Journal of Scientific & Engineering Research, Volume 5, Issue 2, February-2014 31
ISSN 2229-5518
using this method in this case study and details its application scenarios. Analyses of the obtained results along with a presentation of SEVALERPS’limitations are given as well in the same section. Finally, conclusions are given in the last section.
2 INTRODUCTION TO SEVALERPS
SEVALERPS is an ex-ante multi-criteria evaluation method geared toward helping organizations to choose the best ERP
solutions that fit their business requirements. It relies on a systematic six stages process that defines the steps that should be carried out by selection teams to select their solutions. The flow chart of this process is depicted in “Fig. 1”, and it comprises the following activities: requirements gathering and the definition of the evaluation criteria’s tree, candidates searching and screening, functional gap analysis, mismatch handling, elementary and global evaluations.
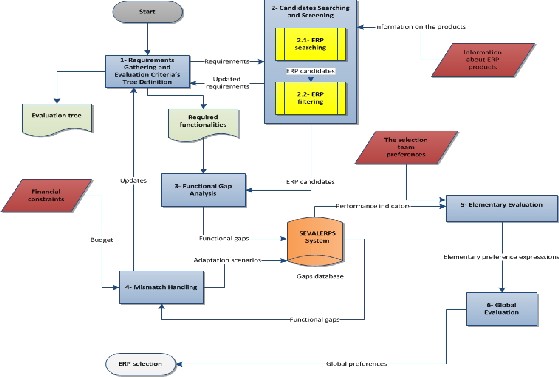
Fig. 1. SEVALERPS’s evaluation process [7]
Actually, SEVALERPS assumes that the evaluation criteria, against which candidate products are judged, and defined with reference to the organization’s requirements, and structured in a hierarchical manner using evaluation trees. The evaluation criteria tree and the required functionalities represent both the outputs of the first stage of SEVALERPS’s process.
From the functional standpoint, evaluating ERP candidates on the functional coverage criterion is done in SEVALERPS by resolving a linear 0-1 programming system which determines the best tailoring strategies for each candidate product. The identified strategies bring solutions to the detected mismatches and try to make a tradeoff between functional coverage’s improvement and tailoring risk’s reduction, within the limit of fixed adaptation budgets.
The parameters of the proposed linear system are presented in TABLE 1, and the optimization system for each candidate product is defined as it is illustrated in Eq. (1).
TABLE 1
ADAPTATION MODEL’S PARAMETERS
IJSER © 2014 http://www.ijser.org
International Journal of Scientific & Engineering Research, Volume 5, Issue 2, February-2014 32

ISSN 2229-5518
SEVALERPS’s process.
aij ∈ [0,1] Initial functional coverage relating to fj and
ERPi
bijk ∈ [0,1] Anticipated functional coverage relating to fj
and ERPi after applying Sijk
rijk ∈ [0,1] Tailoring risk relating to Sijk
cijk ∈ ℝ Tailoring cost relating to Sijk
costi ∈ ℝ Budget limit allowed for ERPi tailoring
xijk ∈ {0,1} Decision binary unknown factor to mention
whether the adaptation strategy Sijk is chosen
or not. xijk = 1 means that is yes and xijk = 0
two reference actions: SUP and INF. Those actions denote respectively the best and the worst potential actions relating to the evaluation criterion.
TABLE 2
PERORMANCE INDICATORS

Performance indicators Description
means that is no.

𝐅𝐅𝐅𝐅𝐅𝐅𝐅𝐅𝐅𝐅 𝐅𝐅𝐜𝐜𝐜𝐅𝐜𝐜(ERPi )
= � wj max(� bijk xijk , aij )
It represents the total functional coverage of

j k
For each ERPi an optimization system is defined as it is
the identified
requirements after adaptation.
illustrated in Eq. (1).
𝐀𝐀𝐅𝐀𝐅𝐅𝐅𝐅𝐅𝐅 𝐜𝐅𝐫𝐫(ERPi )
∑j,k | aij≠1 Γijk xijk
It represents the risk
average associated the

= 1 − ∑ w ∆ x
all adaptation strategies.
⎧ 𝐦𝐅𝐱(𝐎𝐅 )
j,k | aij≠1
j ijk
ijk
(∀𝒊)
𝐎𝐅 = ∑𝒋 | 𝐅𝐅𝐣≠𝟏 𝐰𝐣(𝐛𝐅𝐣𝐫 − 𝐅𝐅𝐣 )(𝟏 − 𝐜𝐅𝐣𝐫 )𝐱𝐅𝐣𝐫
(1)
With ∆ijk = (bijk − aij ) and
⎨ �∀𝒋|𝐅𝐅𝐣 ≠ 𝟏� ∑𝒌 𝐱𝐅𝐣𝐫 ≤ 𝟏
⎩ �∀𝒋, 𝒌|𝐅𝐅𝐣 ≠ 𝟏� ∑𝐣,𝐫 𝐱𝐅𝐣𝐫 𝐅𝐅𝐣𝐫 ≤ 𝐅𝐅𝐫𝐅𝐅
The first constraint (∑k xijk ≤ 1) indicates that only one
adaptation strategy must be chosen to handle an identified
mismatch. While, the second one (∑j,k xijk cijk ≤ costi) indicates that the total adaptation cost shouldn’t exceed the budget cost i allowed to ERPi.
Resolving these linear 0-1 programming systems permits to
determine the values of the unknown factors xijk that indicate
whether a tailoring strategy is chosen or not. Based on the
values of xijk, the selection team could assess the impact of
tailoring scenarios of ERP products on their performances
through the four performance indicators described in TABLE
2.
Γijk = wj ∆ijk (1 − rijk )
𝐀𝐀𝐅𝐀𝐅𝐅𝐅𝐅𝐅𝐅 𝐅𝐅𝐫𝐅 (ERPi) =
= � cijk xijk
j,k | aij≠1
𝐀𝐀𝐅𝐀𝐅𝐅𝐅𝐅𝐅𝐅 𝐀𝐜𝐜𝐜𝐜𝐜(ERPi)
= � wj ∆ijk xijk Ωijk
j,k | aij≠1
With Ωijk
= 0 if Sijk ≡ customization

1 Otherwise
It represents the sum of elementary costs incurred by adaptation strategies
It represents the
potential functional coverage that the organization would lose immediately after a version update.
In order to determine the preference values of the selection team on leave nodes of the evaluation criteria tree, SEVALERPS relies on a multi-criteria technique, called Measuring Attractiveness by a Categorical Based Evaluation Technique (MACBETH) [9]. This activity is handled in the elementary evaluation stage of SEVALERPS’s process. MACBETH is mainly developed in the context of Multi- Criteria Decision Aid (MCDA) and it is based on sound mathematical foundations. MACBETH introduces the concept of interval scales to elaborate the curve of the selection team’s preferences with reference to the candidate products. The main reason behind choosing MACBETH is its ability to provide such scales based only on predefined qualitative judgments voiced out by the selection team. MACBETH comprises seven predefined judgments which describe the difference of attractiveness between every two candidate products: No difference of attractiveness, Very weak difference of attractiveness, Weak difference of attractiveness, Moderate difference of attractiveness, Strong difference of attractiveness, Very strong difference of attractiveness, Extreme difference of attractiveness. MACBETH introduces
In the context of elementary evaluation of ERP candidates,
an illustrative example of a judgment matrix relating to the comparison of three ERP systems (ERP A, ERP B and ERP C) with respect to the security criterion is illustrated in “Fig.
2”.The MACBETH interval scale is obtained thanks to the M- MACBETH software that supports MACBETH method.
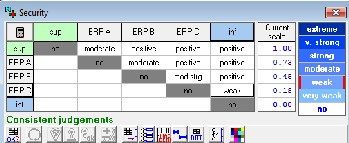
Fig. 2. MACBETH judgment matrix
The global preference score relating to an ERP candidate product is defined through aggregating preferences values along the evaluation criteria tree. Based on these scores, recommendations about optimal solutions are given with
IJSER © 2014 http://www.ijser.org
International Journal of Scientific & Engineering Research, Volume 5, Issue 2, February-2014 33
ISSN 2229-5518
respect to their decreasing ranking order. Accordingly, the best candidate is the one that has the highest score. The originality of SEVALERPS is its introduction of a new aggregation function which bases on the discrete Choquet Integral. In fact in order to represent the interdependencies among criteria, SEVALERPS relies on the concept of the importance of the criteria coalitions. Hence for a set of criteria
N, (1𝑋 , 0𝑁−𝑋 ) represents a binary vector which has the value of
1 on the criteria belonging to X and the value of 0 on the
criteria belonging to N-X. The set of {∀𝑋 ⊆ 𝑁|(1𝑋 , 0𝑁−𝑋 ) }
represents the all possible criteria’s coalitions belonging to N.
valid linear interpolator of such functions, called capacities.
The Choquet integral [11] relating to a µ capacity is defined in
Eq. (4).
n
Cµ (X) = � xσ(i) [µ�Aσ(i) � − µ(Aσ(i+1) )
1
X = (x1 , x2 , ⋯ , xn ) ∈ [0,1]n
σ is a m-permutation that ranges the
In order to assign a strategic importance to each coalition,
SEVALERPS relies again on the systematic technique of
MACBETH to determine these importances on interval scales.
To illustrate this concept, we suppose that the selection team
want to define the strategic weights relating to the coalitions
of the three following criteria: Security, Portability and
Extensibility to judge the quality of a candidate product that
has respectively the following three scores on thoses criteria:
elements of X as follows:
𝒙𝝈(𝟏) ≤ 𝒙𝝈(𝟐) ≤ ⋯ ≤ 𝒙𝝈(𝒏)
𝐀𝛔(𝐅) ≔ {𝛔(𝐅), ⋯ , 𝛔(𝐅)}
�
𝐀𝛔(𝐅+𝟏) = ∅
(4)
5%, 35% and 45%.
If we suppose that the qualitative judgments of the
evaluation team relating to the difference of importance
between each two of the 3-uplets coalitions are given in Fig. 3;
then the strategic importance of each coalition is defined in the
current scale column of the same figure.
Fig. 3. Difference of attractiveness among criteria’s coalitions
Accordingly, we denote by µ(X)|X ⊂ N the strategic importance function that assigns weights to each coalition of
the X criteria belonging to N as it is illustrated in Eq. (2).
∀𝑋 ⊆ 𝑁 µ(X) = SCALEMACBETH (1X , 0N\X ) (2)
In order to extend the definition of µ from {0,1}n to [0,1]n (n
is the number of elements within N) to define the global
preference scores related to the preference value vectors
associated with the ERP candidate products, such as the
aformentionned vector of (5%, 35%, 45%), SEVALERPS
interpolates the µ function within the [0,1]n domain.
In this regard, we easily notice that any µ function verifies
the two propreties of Eq. (2).
−µ(∅) = 0 and µ(N) = 1
-∀ S, T ⊆ N, S ⊆ T ⟹ µ(S) ≤ µ(T) (3)
According to [10], the discrete Choquet integral is the only
For instance, in the example of Fig. 3, the use of the
importance values, obtained through the elaboration of the MACBETH interval scale, as a capacity in the Choquet integral provides the following aggregated score of Fig. 4. This score is assigned to the preference vector of (5%, 35%, 45%).
Fig. 4. Aggregation by the Choquet Integral
It should be noted that in case of an additive capacity that
represents the weights of independent criteria, where ∀ U, V ⊆
N µ(U ∪ V) = µ(U) + µ(V), the Choquet integral will be
identical to a simple weighted sum mean (WSM): Cµ (X) =
∑n µ{i}xi. For this reason, the Choquet integral is considered as
a generalization of the WSM frequently used by the existent
methods proposed in the literature relating in general to
software selection and evaluation.
Hence, by this systematic evaluation process and
technique, SEVALERPS provides a quantitative approach to
compare ERP candidate products. For further information
about SEVALERPS method, the reader is asked to refer to our
previous work: [7], [12], [13], [14]. The next section of this
paper is destined to illustrate the application of this method in
a real study case.
IJSER © 2014 http://www.ijser.org
International Journal of Scientific & Engineering Research, Volume 5, Issue 2, February-2014 34
ISSN 2229-5518
3 CASE STUDY
In this section, we illustrate the application of SEVALERPS in a case study from an organization belonging to the public administration in Morocco. Because of confidentiality reasons, we won’t disclose the name of the organization and we denote it by “X”.
3.1 Background
In this case study, organization “X” aims to acquire an ERP system to manage the public accounting process. In this regard, the new ERP system has to manage mainly the following aspects:
1. Public Expenditure management.
2. Public Income management.
3. Public Accounting management.
4. Public Debt management.
More precisely, the selected ERP system should cover the modules depicted in “Fig. 5”.
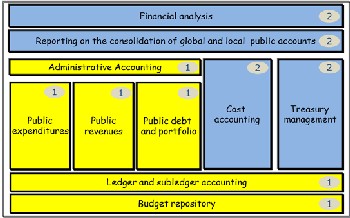
Fig. 5. Functional project’s scope

These modules define the functional scope of the acquisition project. Furthermore, the modules tagged with number “1” represent the mission critical functions that must be covered immediately by the adopted system, whilst the ones tagged with number “2 “are not urgently needed and could be implemented in the medium term. Hence the implementation strategy adopted by organization “X” is based on progressive acquisition of the modules described in the project’s scope.

In addition, it is worth mentioning that upon the completion of the implementation project, organization “X” aims to interoperate its ERP system to exchange financial data with other information systems belonging to other public departments, such as the tax and the custom ones. Organization “X” has to choose among three market leader ERP systems, which we denotes here by “Solution 1”, “Solution 2” and “Solution 3”. These solutions have respectively the following three initial acquisition costs: $5,8 million, $4 million, $2 million. It should be noted that based
on its initial acquisition cost and the description of the functionnalities which it provides, the selection team of organization “X” has basically a trend to choose solution 2.
In this overall context, it should be noted that the users have already defined the list of the required functionalities relating to each module as well as the evaluation criteria tree destined to judge the potential solutions. Based on which organization “X” has identified the three aforementioned ERP candidates. The evaluators have used also several information sources, such as search engines and special web sites that list and categorize ERP products. Accordingly, in this case SEVALERPS method is conducted from the third step of the evaluation process described in “Fig. 1”.
With regard to the first and second set of functions defined in “Fig. 5”, the numbers of critical, important and secondary functionalities relating to each of them are presented in TABLE 3.
TABLE 3
CRITICITY LEVELS OF THE REQUIRED FUNCTIONNALITIES
Category | First set of modules | First and second set of modules |
Critical | 73 | 130 |
Important | 66 | 100 |
Secondary | 36 | 65 |
| Total : 175 functionalities | Total : 295 functionalites |
Besides, four main criteria categories are taken into account by the selection team to evaluate the candidate products: Functional, Technical, Strategic and Financial. The evaluation structure of the criteria tree is illustrated in TABLE 4.
TABLE 4

EVALUATION CRITERIA
IJSER © 2014 http://www.ijser.org
International Journal of Scientific & Engineering Research, Volume 5, Issue 2, February-2014 35

ISSN 2229-5518
Financial
Licensing costs
Implementation costs
Opertaing costs
TABLE 6

PREFERENCE VALUES DEFINED ON EVALUATION CRITERIA

3.1 SEVALERPS Application
SEVALERPS is implemented, in this case study, under three different scenarios relating to a time perspective:
1. First evaluation scenario (short run): In this scenario SEVLAEPRS is applied to recommend an ERP solution to organization “X” based only on the functionalities of the set first of modules of TABLE 3.
2. Second evaluation scenario (intermediate run): In
this scenario SEVALERPS is applied to choose an ERP solution based on both the first and the second sets of modules of TABLE 3.
3. Third evaluation scenario (long run): In this scenario SEVALERPS is conducted to evaluate the three ERP products in case of the decision of interoperating information systems of public
departments is to be considered.
In the mismatch handling stage of SEVLAERPS’s evaluation process, the selection team has identified several tailoring strategies of each one of the potential solutions. By solving the
0-1 linear programming systems of Eq. (1), the impacts of the best tailoring strategies on the performances of the three systems are illustrated in TABLE 7.
TABLE 7
IMPACT OF BEST TAILORING STRATEGIES
3.1.1 First evaluation scenario
For each one of the three potential ERP solutions, the number of functionalities natively covered (before tailoring), the number of mismatches identified in the functional gap analysis of SEVALERPS’s process and the one relating to the critical functionalities not covered by the standard releases of these software products are illustrated in TABLE 5.
Functional coverage’s improvement Number of tailoring strategies

Solution 1 Solution 2 Solution 3

10% 16% 5%
18 53 46
TABLE 5
Adaptation risk 30% 35% 32%

FUNCTIONAL COVERAGE OF THE THREE CANDIDATE PRODUCTS

Solution 1 Solution 2 Solution 3
Total cost of
ownership (%
tailoring cost)
$5,8 million
(24%)
$4,2 million
(56%)
$3,7 million
(49%)
Number of functionalties covered natively (before tailoring)
150 110 94

The new preference values relating to these solutions after tailoring them are presented in TABLE 8.
Number of detected mismatches 25 65 81
Number of critical
In order to assign a global evaluation score to each ERP
solution, the selection team has considered that the three

functionalities that must be covered through tailoring
11 30 41
criteria of functional coverage, tailoring risk and total cost of
ownership are interdependent. These three criteria share the
strategic importance of 75%, whilst the criterion of technical
performance was considered as independent and has the
The preference values relating to these solutions are obtained in SEVALERPS thanks to the use of MACBETH Technique in the elementary evaluation stage. These values are presented in TABLE 6.
strategic importance of 25%. As to the definition of the strategic importance value of each coalition of the three interdependent criteria, SEVALERPS suggests using MACBETH to define the underlying values on an interval scale, as illustrated in “Fig. 6”.
IJSER © 2014 http://www.ijser.org
International Journal of Scientific & Engineering Research, Volume 5, Issue 2, February-2014 36
ISSN 2229-5518
TABLE 8

PREFERENCE VALUES AFTER TAILORING CANDIDATE PRODUCTS
the best one, followed by solution 1 and solution 3. However, we notice that solution 1 and solution 2 have almost the same scores. Even if solution 1 provides more anticipated functional coverage than solution 2, its higher total cost of ownership has downgraded its ranking order.
3.1.2 Second evaluation scenario
Similarly to the first scenario, TABLE 10, TABLE 11 and TABLE 12 describe respectively the standard functional coverage of the tree solutions before tailoring them, the impact of the best tailoring strategies on their performances and the
preference values related to the underlying performances.
TABLE 10
FUNCTIONAL COVERAGE OF THE THREE CANDIDATE PRODUCTS

Solution 1 Solution 2 Solution 3

Fig. 6. Qualitative judgemts matrix of coalitions’ weights
As a result, the aggregation of the preference values of table through the discrete Choquet integral and the weighted sum mean gives the global scores presented in TABLE 9.

Number of
functionalties covered natively (before tailoring)
Number of detected

mismatches Number of critical functionalities that must be covered through tailoring
250 209 175
45 86 120
25 55 97
TABLE 9
GLOBAL PREFERENCE SCORES
TABLE 11
IMPACT OF BEST TAILORING STRATEGIES

Solution 1 Solution 2 Solution 3

Functional
coverage’s improvement Number of tailoring strategies
15% 35% -
36 70 60 (excluded)
Adaptation risk 28% 65% -
Total cost of ownership (%
tailoring cost)
$7,7 million
(23%)
$7,5 million - (65%)

In this scenario, SEVALERPS has recommended solution 2 as
IJSER © 2014 http://www.ijser.org
International Journal of Scientific & Engineering Research, Volume 5, Issue 2, February-2014 37
ISSN 2229-5518
TABLE 12
PREFERENCE VALUES BEFORE AND AFTER TAILORING CANDIDATE
PRODUCTS

Criteria Solution Solution 1 Solution 2 Solution 3

Ex
3.1.3 Third evaluation scenario
For the third scenario, the selection team decides to use the RatQual Model [16] (for Ratio of Quality Model) to characterize external quality factors that depend on the environmental parameters in a cross organizational context. RatQual model is endowed with an assessment approach that
Functional
coverage
Technical performanc e
adaptation 70% 49% 25% Post
adaptation 85% (+15%) 84% (+35) -
Ex
adaptation 91% 89% 35%
Post
adaptation 91% 89% 35%
gives a ratio score of each specific external quality factor. An
example of RatQual assessment specification is RatIop (for
Ratio of Interoperability) [15].
In this case, RatQual is used to assess quality degree for (i)
flexibility, (ii) security and (iii) interoperability. Interoperability, security and flexibility features are
Tailoring risk
Ex adaptation
post
100% 100% 100%
mentioned in Table 14.
adaptation 72% 35% -
Total cost of
ownership
Ex adaptation
Post-
35% 60% 70%
-

TECHNICAL PERFORMANCE SUB-CRITERIA
adaptation 50% 52%

In this second scenario, solution 3 was discarded because some mismatches relating to set of critical functionalities couldn’t be resolved by the proposed tailoring strategies. Indeed, the number of tailoring strategies (60) is lower than the number of critical functionalities that must be covered through tailoring (97).
Technical performance

Sub-criteria Strategic importance Security 10% Reliability 10%
Flexibilty 10%
User-freindliness 10% Understandability 10%

Interoperability 50%
Contrary to the recommendation of the first scenario, the aggregated scores obtained for this scenario (see TABLE 13) show that, in the medium run, solution 1 is more suitable than solution 2. In fact, even if solution 1 remains a bit costly than solution 2. The tailoring risk of solution 2 is too high to promote its selection. For this reason, the global score of solution 1 is significantly important by comparing with the one relating to solution 2.
TABLE 13

GLOBAL PREFERENCE SCORES
According to [15] and [16], the three above quality factors are assessed based on the external interfaces used to interconnect the mentioned systems. RatQual takes into account the following three operational aspects:
1. Interoperation potentiality (PI).
2. Interoperation compatibility (DC).
3. Operational performance (PO).
The key performance indicator defined by RatQual to evaluate
Evaluation criteria Strategic
Importance
Anticipated functional coverage
Solution 1 Solution2
85% (+15%) 84% (+35)
quality is defined in Eq. (5).
RatIop = (PI + DC + PO)/3 (5)
Tailoring Risk
Coalitions
“Fig. 6”
72% 35%
other information systems (see “Fig. 7”):
Total cost of ownership 50% 52%
Aggregated score by Choquet
integral 75% 0,6754 0,4742
Technical performance 25% 0,91 0,89
Global preference score 0,69 0,73
IJSER © 2014 http://www.ijser.org
International Journal of Scientific & Engineering Research, Volume 5, Issue 2, February-2014 38
ISSN 2229-5518
system(S5) system (S10)
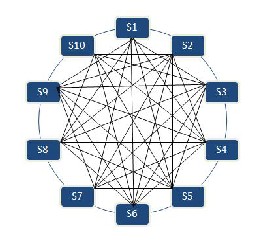
Fig. 7. Interoperabiltiy among the ten information systems [15]
According to a previous study conducted by [15], the levels of interoperation relating to solution 1 and solution 2 are respectively 0, 75 and 0, 62.
Based on these values, the global preference scores of solution
1 and solution 2 are presented in TABLE 15.
TABLE 15
GLOBAL PREFERENCE SCORES
Evaluation criteria | Importance | Solution 1 | Solution2 |
Anticipated functional coverage | Coalitions | 85% (+15%) | 84% (+35) |
Tailoring risk | Coalitions | 72% | 35% |
Total cost of ownership | Coalitions | 50% | 52% |
Aggregated score by Choquet integral | 75% | 0,6754 | 0,4742 |
Technical performance | 25% | 0,83 | 0,75 |
Global preference score | 0,71 | 0,54 |
As result, we conclude that in order to ensure better communication among the information systems and the future solution, it is advised to choose solution 1.
3.2 Analysis and Discussion
By analyzing the results obtained in the three aforementioned
scenarios, we can see as it is shown in TABLE 16 that the two last scenarios recommend clearly to choose solution 1, whilst the first scenario is barely making distinction between solution
1 and solution 2. With regard to solution 3, it is either ranked in the last position or eliminated from further consideration.
TABLE 16

SUMMARY OF SEVALERPS EVALUATION

Solution 1 Solution 2 Solution 3
Scenario 1 0,69 0,70 0,51
Scenario 2 0,73 0,58 -

Scenario 3 0,71 0,54 -
In the first scenario, we can see that the total cost of ownership has pledged for the selection of solution 2 with a difference of
$1,6 million comparing with the first solution. We can notice also that both solution 1 and solution 2 have a quite similar tailoring risk given that the most required functionalities relating to the first set of modules are well implemented by these two ERP systems.
Conversely, in the second scenario, SEVALERPS suggests choosing solution 1. In fact, in order to cover the functionalities of the overall modules described in the acquisition project’s scope, the tailoring risk of solution 2 reaches 65% in comparison with 28% relating to solution 1. In this situation, solution 1 seems to be more interesting because it provides the same functional coverage as solution 2 with lower tailoring risk. The difference of the total cost of ownership between these two solutions is insignificant and doesn’t justify taking a difference of tailoring of risk estimated at around 37%. We recall that solution 3 was eliminated from further consideration due to its inability to cover some business critical functionalities, even after its tailoring.
The third scenario reconfirms the outcomes of the second one. Actually, the interoperability levels of the first two solutions with the key information systems belonging to other public departments show that solution 1 provides more favorable conditions to deal with integrating the business processes and data of the relevant departments.
For all those reasons, we believe that despite the tendency of organization “X” to choose solution 2 (For mainly financial considerations), SEVALERPS considers that choosing solution 1 is highly recommended. The results of the in-depth analysis obtained by applying SEVALERPS method were presented to the senior officials and the decision makers of organization “X”. They recognized the interest of SEVELARPS method and systematic approach with which this method deals with the most tedious and complex evaluation questions. In spite of its initial higher acquisition cost, they were finally convinced that solution 1 is the most appropriate solution for the case of organization “X” for the long run. The feedbacks relating to the real implementation of solution 1 have shown that the adoption of this solution was done smoothly and the tailoring risk was controlled. However, there were some gaps between the estimated outputs and the
IJSER © 2014 http://www.ijser.org
International Journal of Scientific & Engineering Research, Volume 5, Issue 2, February-2014 39
ISSN 2229-5518
real ones, as show in TABLE 17.
TABLE 17
OUTPUTS’ ADJUSTMENT

Adjustement |
Anticipated fitness | -5% |
Tailoring Risk | 3% |
Total cost of ownership | 12% |

This leads us to the issue of the accuracy of inputs’ estimation and its impact on the outcomes of SEVALERPS method. In fact, these inputs are often uncertain and are based on the experience of the evaluators. For this reason, in the future, it is deemed wise to supplement SEVALERPS method by a sensitivity analysis to see how outcomes change if the inputs change within a limited range. This would consolidate the results obtained by SEVALERPS method.
4 CONCLUSION
The purpose of this paper is to illustrate the use of SEVALERPS, a method which we proposed for conducting ERP system evaluation and selection, in a public administration’s case study. This case study shows that SEVALERPS is practical and makes systematic and efficient the ERP selection process within organizations that aim to acquire such solutions. The main results obtained from using SEVALERPS in the case of organization “X” is firstly to determine, within limited acquisition budgets, the best tailoring strategies for each candidate ERP solution by seeking tradeoffs between improving its functional coverages and reducing its adaptation’s risks. Actually, the functional coverage of ERP solutions couldn’t be correctly assessed without the consideration of the risk relating to their implementation. In this regard, SEVALERPS has globaly recommended the solution that makes a fair balance among the three evaluation criteria of reducing tailoring risk, improving anticiapated functional coverage and lowering total costs of owener ship. Secondly, this case study illustrates the advantage of using the Choquet Integeral, suggested by SEVALERPS, as an aggregation function. The Choquet Integral has permitted to take into account the interdependicies that exist among the three aforementioned evaluation criteria, especially when it considers that the
Implementation: An Organizational Fit Perspective,” J. Information and
Management, vol. 40, no. 1, pp. 25–40, 2002.
[2] M. Shakir, “Decision Making in The Evaluation, Selection and Implementation of ERP Systems,” Proc.Americas Conference on Information Systems, 2000.
[3] C. Barclay and K.-M. Osei-Bryson, “An Exploratory Evaluation of Three IS Project Performance Measurement Methods,” http://csrc.lse.ac.uk/asp/aspecis/20090232.pdf. 2009.
[4] M. Al-Mashari, A. Al-Mudimigh, and M. Zairi, “Enterprise Resource Planning: A Taxonomy of Critical Factors,” J.European of Operational Research, vol. 146, no. 2, pp. 352–364, 2003.
[5] C. G. Sen, H. Baraçli, and S. Sen, “A Literature Review and Classification of Enterprise Software Selection Approaches,” J.Information Technology and Decision Making, vol. 8, no. 02, pp. 217–238, 2009.
[6] A. Khaled and M. A. Janati-Idrissi, “A Semi-Structured Tailoring-Driven Approach for ERP Selection,” J. International of Computer Science Issues, vol. 9, no. 2, 2012.
[7] A. Khaled and M. A. Janati-Idrissi, “SEVALERPS a New Ex-Ante Multi- Criteria Method for ERP Selection,” J.International Review on Computers and Software, vol. 8, no. 10, 2013.
[8] T. L. Saaty, What Is The Analytic Hierarchy Process?, Springer, 1988. [9] C. A. B. E. Costa and J.-C. Vansnick, The MACBETH Approach: Basic
Ideas, Software, and An Application, Springer, 1999.
[10] M. Grabisch, “The Choquet Integral as aLinear Interpolator,” Proc.tenth int. Conf. Information Processing and Management of Uncertainty in Knowledge-Based Systems (IPMU 2004), 2004, pp. 373–
378.
[11] G. Choquet, “Theory of capacities,” J.Annales de l’institut Fourier, vol. 5, no. 131-295, 1953, p. 87.
[12] A. Khaled and M. A. Janati-Idrissi, “A Learning Driven Model for ERP Software Selection Based on The Choquet Integral: Small And Medium Enterprises Context,” J. Digital Enterprise and Information Systems. Springer, pp. 358–371,2011.
[13] A. Khaled and M. A. Janati-Idrissi, “A Semi-Structured Methodology for ERP System Selection Based on MACBETH and Choquet Integral Applied to Small and Medium Sized Enterprises,”J. International of E- Entrepreneurship and Innovation (IJEEI), vol. 2, no. 4, pp. 1–19, 2011.
[14] A. Khaled and M. A. Janati-Idrissi, “A Framework for ERP Evaluation and Selection Using MACBETH Technique.” Proc.thirtheenth int.Conf. Enterprise Information Systems (ICEIS ‘13), 2011, pp. 339–342.
[15] B. Elmir B and B.Bounabat, “Integrated Public E-Services Interoperability Assessment,” J.International Information Science and Management (IJISM), pp. 1-12, 2012.
[16] A.Elmir, B. Elmir B, and B.Bounabat, “Towards an Assessment- oriented Model for External Information System Quality Characterization,” J. International Journal of Computer Science Issues, vol. 10, Issue 4, no 2,
2013.
importance relating to the coaliation of reducing tailoring risk
and improving anticiapated functional is far more important than the importance resulting simply from summing them. However, the main limitation of SEVALERPS pertains, like all existent evaluation methods, to that the accuracy of its outputs is completely dependent on the one relating to its inputs.
REFERENCES
i ENSIAS/UM5 Souissi University, Rabat, Morocco
[1] K.-K. Hong and Y.-G. Kim, “The Critical Success Factors for ERP
IJSER © 2014 http://www.ijser.org