International Journal of Scientific & Engineering Research, Volume 5, Issue 1, January-2014 2218
ISSN 2229-5518
Apply MTS-MTO & Rule Base in Food Flow
Processing System
Ammar Noorwali
Abstract—High competition in food forced companies to control their cost and that combine with reduce wastes and increase effciancy.The processing system of food considered as one of the most variable system because the nature of the product. The research can accomplish the goal by reduce variability in food processing system. Therefore, the research applied different steps. The steps include process map, identify different types of variability in food and in make to stock (MTS) and make to order (MTO), apply lean in food by categorize seven types of wastes in food, apply Taguchi orthogonal array, and implement Principle Competent Analysis for correlation between variables and factor to identify which variable has the most impact and from which factor the impact. This paper continues these steps as by highlighting MTS-MTO in food, existing variability measures. Minitab implemented to identify factors that affected with the highest variable. For process improvement rule base applied as an artificial intelligent tool for reduce effect of variability in the process.
Index Terms— Artificial intelligent, Food, MTS-MTO, Logic control, Principle components, System, rule base,
—————————— ——————————
Due to increasing competition in food industry , there is a
demand for increasing efficiency and reducing wastes. There-
fore, the research may accomplish this goal by reduce varibil-
ity level in food processing system.
make-to-stock still needed for standard products.
Following [13] mentioned that make-to-order (MTO) products
as the products with no inventory requirement. This could be
due to high irregular demand products, specified products,
trail products, tendered products, or very short shelf life
IJSER
The research will start with make to stock (MTS) and make to
order (MTO) as they are strategies that commonly applied in
food. Moreover, some of the existing variability measures will
be highlighted in this paper in order to help for finding the
proper method for reducing effect of variability in food.
In addition, the research adopted lean in food for reducing waste and increasing efficiency. As [12] started steps such as characteristics of food , different types of variability in food, process mapping ,and simulation model.
In addition,[10] continue steps by implementing lean by cate- gories seven types of waste in food . In addition Taguchi or- thogonal array method implemented combine with simulation models and then principle component implemented [11] to define which variable has the highest affect.
Moreover, the research will apply Minitab for identify which factor affected with the highest variable. Then, for process im- provement rule base will be applied as an artificial intelligent tool to reduce the affect of variability in the affected areas.
According to[2] , in manufacturing there are a different sources of variability such as demand and arrival time , con- sistency of the machines , processing time , and capability of operator .
Consumers consider order response time as one of the service performance measures. The new business model use tele- phone/internet ordering and the requirement of a quick re- sponse service increased implementation of make-to-order (MTO) that provide production of specific demand. However,
products.
The research will highlight the definitions of MTS and MTO to understand the strategies and linked them with food. In addi- tion, the research will compare MTS and MTO characteristics and the advantages of combination between them.
According to [17] make-to-stock (MTS) system is producing finished or semi-finished products and then stock them based on demand forecasts.
As [16] mentioned that under MTS management the items are produced in prediction of future orders and stocked in Fin- ished Goods Inventory(FGI).
Moreover, [1] defined MTS strategy as “ pre-build a standard product using efficient capacity in advance of single uncertain de- mand event”.
In summary, the research here can define MTS in food accord- ing to the above definitions as producing products and stock those in finished goods inventory FGI based on demand fore- casts and pulling level of inventory to increase flow in food processing system.
IJSER © 2014 http://www.ijser.org
International Journal of Scientific & Engineering Research, Volume 5, Issue 1, January-2014 2219
ISSN 2229-5518
As [17]mentioned that make-to-order (MTO) system produces only when customers demand placed.
illustrates a comparison between MTS and MTO characteris- tics[6]; [17]; [14]; [1]; [13]; [15])
![]()
![]()
MTS MTO
[16], interpreted MTO process, “a production order is released to manufacturing facility only after the firm demand has been re- ceived”.
According to [3], “ in MTO manufacturing or assembly is under- taken after the order is received as the product customized to meet the customer preferences”.
Furthermore , [1] defined MTO strategy as “a strategy to acquire more expensive flexible capacity that can produce after observing the demand event”.
According to the above, the research can define MTO in food as the manufacture only produce product after the order has been released in order to increase product value stream in food flow processing system.
From the definitions we may identify characteristics of MTs
Inventory [6] Considered MTS sys-
tem as a “push” system that has high level of in- ventory.
Cost [14] As MTS is producing in high capacity, the cost of product is low. However, [17], make-to-stock (MTS) is become expensive in large number of products.
Production [1] Operating in MTS sys- tem help to increase pro- duction utilization by run production lines for long term in high capacity as the plan will be for pro- duce to stock.
[17], MTO system removes
finished-goods stocks as the order dispatched to the customer after produced. In addition, [6] mentioned that MTO system is considered as a “pull” system that min- imise inventory level.
[1] Noted that using MTO
flexible system in produc- tion lines helps to reduce the expenses of extra costs.
MTO has flexibility in prod- uct mix to produce high range of products as it pro- duced after the order re- leased. However, the pro- duction schedule is more variable.
IJSER
and MTO. Table 1 shows explains the comparison between
MTS and MTO in Inventory, cost, production, demand, and
scheduling.
Demand [13] MTS products depend
on forecasting by knowing in advanced how much should be produced. In addition, as [16] mentioned that the MTS benefit is to enable immediate reactivi- ty to external demands.
scheduling [15] Mentioned that the main key performance in scheduling of MTS prod-
ucts is throughput.
[6] The demand will be as
the customer’s requirements instead of forecasts.
[15] The main key perfor- mance in scheduling of MTO products is on time delivery rate.
![]()
From the above, the research found that the combination of both MTS and MTO in food flow processing system may in- crease the following:
1) Meet customer requirement; the changing of demand may increase due to many factors such as weather. Meeting the demand is important as the customer will not buy not need it product. In addition, lean princi- ple specifies value can be applied for increase cus- tomer fulfillment.
————————————————
IJSER © 2014
2) Improve optimization in capacity planning; reduce waste ad increase efficiency. Lean perfection might applicable for improve optimization.
3) Reduce cost; due to high competition in food market cost reduction can give competition advantage.
4) Reduce level of inventory; increasing inventory may increase time and material wastes. Lean pull might be applied for reduce inventory level.
http://www.ijser.org
International Journal of Scientific & Engineering Research, Volume 5, Issue 1, January-2014 2220
ISSN 2229-5518
5) Improve scheduling utilization; MTO flexibility with
MTS forecasting may increase scheduling utilization.
Therefore, from identifying MTS and MTO and highlight their characteristics and the advantages of combination between them in food, the research identified types of variability in food and MTS-MTO as [12] :
1) Correlation between products.
2) Change in customer demand.
3) Changeover time.
4) Weather change.
5) Uncertain due date.
The research will measure the effect of each factor in increas-
ing variability level in food processing. The research will high-
light existing variability measures in food in the next section.
There are many measures that commonly used in measuring variability of food processing system; the research will highlight some of them in the following:
[8] Used MIP for planning and scheduling and classified large number of products into product families. They applied Dis-
Moreover, MILP was implemented successfully real case stud- ies in order to control machine breakdown and labor change
.The MILP framework is depends into four abstractions:
1) Sequencing decision and managing of allocation
separately.
2) Represent problem by offering each task process that may give the task sequence at any utilized resources item.
3) Use a unique set of binary variables to explain the proceeding task sequence for uniform handling of discrete resources.
4) Accomplish partial-rescheduling scheme until reach the optimum improvement.
[4] Applied mixed integer liner program (MILP) model for production scheduling problem and synchronize lot-sizing in yogurt production line in Greece. They plan was improving product and process sequence and manage inventory level as the requirement demand. They divided variables into two types:
Continues variables:
• Product quantity
• Utilization
• Inventory level
Binary variables:
IJSER
creet time approach for inventory and backlog cost, continues
time approach with sequencing for scheduling of families, lot-
sizing for scheduling products. Mathematical modeling ap-
plied for i.e.: lot-sizing and timing constrains and common resources constrains. The results were:
• Control changeover carryover and crossover
• Increase recourses utilization.
In addition, [7] applied Mixed Integer Programme (MIP) for
yogurt lot sizing problem for product families in packing
stage. The target was Increase yogurt packing capacity by in-
vesting in new fruit mixer that may increase the flexibility of
packing machines. In addition, there are problems in change-
over between some products. They crossbreed between dis-
creet-time and continues-time mathematical models.
Thus, the model shows that 7.6% improvement after adding fruit mixer and the inventory cost is lowered by12.2%.However, the model only focused in adding facilities to increase flexibility and reducing the cost, reducing variables such as changeover time and product mix and overcome of them should be considered for increase the efficiency level.
According to [9] the MILP is restructuring algorithm for im- proving non-optimal schedule or updating current schedule by repetitively discharging and repositioning a small number of jobs.
[5] Developed formulation that performing inventory mass balance by applying individual continues time grid and that allowing process event to take place at any time with different tasks duration.
• For each products indicating producing product in the particular day.
• For each possible transition for each changeover tak- ing place or not.
Thus, their results were reducing the cost of production and increasing machine utilization. However, the model only ap- plied in production scheduling problem. There is process flow problem such as machine breakdown and setup time need to be overcome in order to minimize lot-sizing and increase ma- chine utilization. In addition, there are other factors might need to be covered i.e. high process waste.
The steps for reduce the affect of variability in food flow pro- cessing system are:
1) Process mapping.
2) Simulation model.
3) Types of varibility on food processing system.
4) Lean seven types of wastes categories.
5) Taguchi 27 Array.
6) Principle components.
7) Rule base analysis.
Some of the above steps already published i.e. [10] ,[11] ,[12],. The research will summerise these steps and then continue with the new approach.
The model applied in biscuit production line in National bis- cuit and confectionary company (NBCC).As [10] there are three levels of variability and we have four variables , the re- search applied Taguchi orthogonal array 27 .Table 2 [10]
IJSER © 2014 http://www.ijser.org
International Journal of Scientific & Engineering Research, Volume 5, Issue 1, January-2014 2221
ISSN 2229-5518
shows the results of Taguchi 27 array for biscuit production line. The results include four variables %waiting, %Blocking,
%Stopping, %Working.
27 Arrays for biscuit production line[10]
affecting waiting. The highest affected factors are moisture, speed, low temperature, and short breakdown.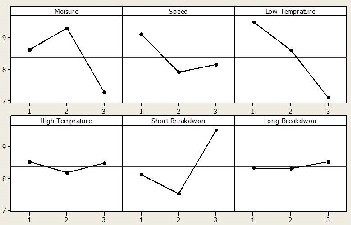
From the Taguchi orthogonal array results as Figure1 shows that waiting is affected by factors. The most affected factors are:
• Speed; affected in two work stations :
o Cooling conveyor; cooling conveyor speed is
2.8 m/sec which increase waiting in the next
processes such as aligning and packing. The
solution is to apply rule base to increase con- veyor speed to match the stander which is
4m/sec.
o Packaging 1; Packaging 1 conveyor speed is 1 m/sec which increase waiting in the process- es. The solution is to apply rule base to in-
crease conveyor speed to match the stander which is 3m/sec.
• Low temperature; affected in packing machine1 as the
sealing temperature is 62◦ which cause bad sealing
and that increase waiting in packaging1. The solution
After finalize the result , the research apply Principle Compo-
nent Analysis table 3 for find out which factor affecting more
in increasing variables.
![]()
correlation between variables and factors[11]![]()
F1 F2 F3
%Waiting -0.756 0.159 0.635
%Blocking -0.775 -0.542 -0.327
%Stoppages -0.133 0.958 -0.253
![]()
%Working 0.963 -0.178 0.201
Thus, table 3 results shows that %waiting and %blocking have the highest correlation with factor 1. Thus, %waiting and
%Blocking need to be reduced in order to reduce variability level in biscuit production line.
is to set machine temperature to 56◦.
• Short breakdown; affected in two workstations :
o Packing machine 2; sensor is not working
which affect in increase waiting in packaging
2. The solution is to adjust sensor to 0.05.
o Packaging 2; packing fingers out of timing (15 pack/min) which cause of increase wait- ing in the process. The solution is to increase
packaging fingers to 20 pack/min.
Therefore, the research identified each factor and area of af- fecting with defines the problem and the suggesting the solu- tion that shows in table 4.
![]()
Summary of affected factors and the required improvement
For identify the factors that affect with increasing the highest variable, Minitab applied as figure 1 shows that the factors
Variable Affected
Factors
Work station
Problem Improvement
![]()
IJSER © 2014 http://www.ijser.org
International Journal of Scientific & Engineering Research, Volume 5, Issue 1, January-2014 2222
![]()

ISSN 2229-5518
Waiting Speed Cooling conveyor
Lower con- veyor speed
2.8 m/sec
Increase con- veyor speed
4m/sec
Packing machine 2 = waiting
On Breakdown
Low tempera- ture
Short
Break- down
Packing machine1
Packing machine2
Bad sealing
62◦
Sensor not working
Set machine temp 56◦
Adjust sensor
0.05
IF packing machine2.Peration time ≥2
Then set machine temperature = 56
And set MTTR = 35
And set MTTF = 89
Speed Packag- ing1
Lower Con- veyor speed
1m/sec
Increase con- veyor speed
3m/sec
Short break- down
Packag- ing2
Packaging finger out of timing
![]()
15pack/min
Increase packaging finger to
20pack/min
is equal and more than three, then set conveyor speed to
3m/sec, MTTR = 20, and MTTF= 80.
Packaging1 =waiting
As the problem identified, for process improvement the re- search applied rule base in order to improve each process that affected with factors. Figures 2-6 shows rule base applied in affected areas such as cooling, packing, and packaging as the follwoing:
On Breakdown
IF Packaging. Operation time ≥3
Then set conveyor speed = 3 m/sec
And set MTTR = 20
And set MTTF = 80
IJSER

1) Cooling conveyor; figure 2 shows implementation of rule base for reduce waiting. The condition include if operation time is equal and more than five, then set cooling conveyor speed to 4m/sec, MTTR = 20, and MTTF=87.
5) Packaging 2; figure 6 shows implementation of rule base
for reduce waiting. The condition include if operation time
is equal and more than three, then set packing fingers to 20
packets/min, MTTR = 25, and MTTF= 85.
Cooling conveyor = waiting
On Breakdown
IF cooling conveyor. Operation time ≥5
Then set conveyor speed = 4m/sec
And set MTTR = 20
And set MTTF = 87

0.05, MTTR = 30, and MTTF= 87.
Packing macine1 = waiting
On Breakdown
IF packing machine1. Operation time ≥2
Then set Sensor = 0.05
And set MTTR = 30
And set MTTF = 87
base for reduce waiting. The condition include if operation
time is equal and more than two, then set machine temper-
ature = 56, MTTR = 35, and MTTF= 89.
Packaging2 = waiting
On Breakdown
IF Packaging2.Peration time ≥3
Then set Packaging finger = 20 pack-
ets/min
And set MTTR = 25
And set MTTF = 85
Applied rule base reduced the effect of factors in variables at the affected areas. Table 5 and 6 shows the comparison between the results of the simulation model before and after rule base im- plementation.
Results of the simulation model before apply rule base
IJSER © 2014 http://www.ijser.org
International Journal of Scientific & Engineering Research, Volume 5, Issue 1, January-2014 2223
ISSN 2229-5518
• Waiting; by implementing logic control waiting was decreased and the process was improved as shown in figure 8.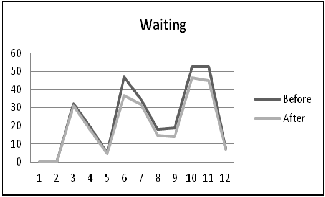
Results of the simulation model after rule base applied
IJSEFigure 8 compRarison of waiting before and after rule base
• Stopped; by implementing logic control the process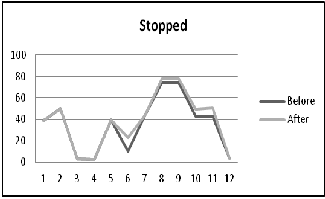
was getting slower and stopped was slightly in- creased as shown in figure 9.
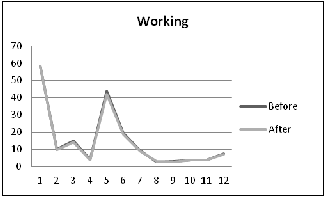
Figures 7-11 shows the comparison of variables before and after rule base implementation.
• Working; by applying logic control working was slightly decreased due to slow of the process as shown in figure 7.
IJSER © 2014 http://www.ijser.org
International Journal of Scientific & Engineering Research, Volume 5, Issue 1, January-2014 2224
ISSN 2229-5518
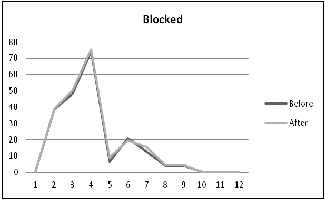
• Blocked; implementation of logic control reduce blocking slightly in packing areas as shown in figure 10.
• Throughput; due to implementation of logic control, throughput was slightly increased as shown in figure 11.
4) Packaging 1; the results from table 2 and 3 shows that waiting in packaging1 reduced from %52.65 to %46.57. On the other hand, Stopped in packaging1 increased from %42.88 to %48.98.
5) Packaging 2; the results from table 2 and 3 shows that waiting in packaging2 reduced from %52.37 to %44.99. However, Stopped in packaging1 increased from %42.98 to
%50.72.
I would like to thank my sponsor King Abdullah bin Abdul- Aziz the royal king of Saudi Arabia and ministry of higher education in Saudi Arabia and Saudi cultural bureau in UK and Ireland and the cultural attaché Dr.Faisal Abalkhail for sponsor me to continue my higher education including master and PhD degrees. In addition, they fully support me for pub- lishing my work.
I also thank my supervisors and the department Centre of Advanced Manufacturing Process and Mechatronics at De Montfort University for help and support.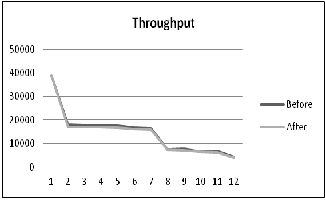
Also I thank my family and my parents for supporting me during my research including my father Prof.Abdulwahab Noorwali , my mum Mrs.Halema Noorwali , my wife Eng.Fatima Nasralla , son Mazen Noorwali , and Wsam Noorwali(died in 19/8/2012).
1) Cooling conveyor; the results from table 2 and 3 shows that waiting in cooling conveyor reduced from %47 to
%36.72 and in aligning reduced from %34.67 to %31.85. However, Stopped in cooling conveyor increased from
%10.44 to %22.93.
2) Packing machine 1 ; the results from table 2 and 3 shows that waiting in packing machine 1 reduced from
%18.12 to %14.60 and in packaging1 reduced from
%52.65 to %46.57. On the other hand, Stopped in pack-
ing machine1 increased from %74.43 to %77.78.
3) Packing machine 2 ; the results from table 2 and 3 shows that waiting in packing machine 2 reduced from
%18.92 to %14.14 and in packaging2 reduced from
%52.37 to %44.99. However, Stopped in packing ma-
chine2 increased from %74.43 to %77.78.
MTO and MTS are commonly used strategies in food. The re- search identified types of variability in food processing sys- tem. Then, the research highlighted the exits variability measures in food. In addition, pervious published method steps have been summarized.
From rule base we can find that there were and improvement of process after implement rule base in waiting affected factors in different areas. In addition, as the result of implementation, waiting is decreased in all work stations.However; stopping was slightly increased in some workstations.
Therefore, apply artificial intelligent tools rule base in food flow processing system could reduce factors affect with varia- bles. Thus, that could decrease variability level in food pro- cessing system. Although, there are many methods applied in food processing, rule base applied in bottleneck areas and re- duce of each factor. For future work, Autonomous could be applied in food flow system for continues improvement.
IJSER © 2014 http://www.ijser.org
International Journal of Scientific & Engineering Research, Volume 5, Issue 1, January-2014 2225
ISSN 2229-5518
[1] Cattani K, Dahan E and Schmidt G M 2003 Using Make- to-Order Production Layered on Make-to-Stock Production to
Hedge Against Uncertainty
[2] Chang K-H and Lu Y-S 2010 Queueing analysis on a
single-station make-to-stock/make-to-order
inventory-production system Applied Mathematical
Modelling 34 978-91
[3] Claycomb C, Dröge C and Germain R 2005 Applied
customer knowledge in a manufacturing
environment: Flexibility for industrial firms Industrial
Marketing Management 34 629-40
[4] Doganis P and Sarimveis H 2007 Optimal scheduling in a yogurt production line based on mixed integer linear programming Journal of Food Engineering 80 445-53
[5] Ierapetritou M G and Floudas C A 1998 Effective
Continuous-Time Formulation for Short-Term
Scheduling. 1. Multipurpose Batch Processes
Industrial & Engineering Chemistry Research 37 4341-59
[6] Kaminsky P and Kaya O 2009 Combined make-to-
order/make-to-stock supply chains IIE Transactions 41
103-19
[7] Kopanos G M, Puigjaner L and Georgiadis M C 2010
dedication features International Journal of Production
Economics 112 416-26
[16] Youssef K H, Van Delft C and Dallery Y 2004 Efficient
Scheduling Rules in a Combined Make-to-Stock and Make-to-Order Manufacturing System Annals of Operations Research 126 103-34
[17] Zaerpour N, Rabbani M, Gharehgozli A H and Tavakkoli- Moghaddam R 2008 Make-to-order or make-to-stock
decision by a novel hybrid approach Advanced
Engineering Informatics 22 186-201
Optimal production scheduling and lot-sizing in dairy plants: The yogurt production line Industrial and Engineering Chemistry Research 49 701-18
[8] Kopanos G M, Puigjaner L and Maravelias C T 2011
Production planning and scheduling of parallel
continuous processes with product families Industrial and Engineering Chemistry Research 50 1369-78
[9] Mendez C A and Cerdá J 2004 An MILP framework for batch reactive scheduling with limited discrete resources Computers & Chemical Engineering 28 1059-68
[10] Noorwali A 2013 Apply Lean and Taguchi in Different Level of Variability of Food Flow Processing System Procedia Engineering 63 728-34
[11] Noorwali A 2013 Apply MTS-MTO and Principle
Component in Food Flow Processing In: International
Conference in Production and supply chain management
(Rome,Itlay
[12] Noorwali A, Khalil R and Stockton D 2012 Investigating
Types of Varibility on Food Flow Processing System In: International Confrence on Manufacturing Research (Aston University Birimingham Aston Business School)
[13] Soman C A, Pieter van Donk D and Gaalman G 2006
Comparison of dynamic scheduling policies for hybrid make-to-order and make-to-stock production systems with stochastic demand International Journal of Production Economics 104 441-53
[14] Soman C A, van Donk D P and Gaalman G 2004
Combined make-to-order and make-to-stock in a food production system International Journal of Production Economics 90 223-35
[15] Wu M-C, Jiang J-H and Chang W-J 2008 Scheduling a hybrid MTO/MTS semiconductor fab with machine-
IJSER © 2014 http://www.ijser.org