International Journal of Scientific & Engineering Research Volume 2, Issue 11, November-2011 1
ISSN 2229-5518
Application of Wavelet Transform for Power Quality Studies of Signal Notches in Weak AC System
S.Debdas, M.F.Qureshi,
(
Abstract- The emergence of power quality as a topical issue in power systems in the 1990s largely coincides with the huge advancements achieved in the computing technology and information theory. This unsurprisingly has spurred the development of more sophisticated instruments for measuring power quality disturbances and the use of new methods in processing the measurements. Fourier theory was the core of many traditional techniques and it is still widely used today. However, it is increasingly being replaced by newer approaches notably wavelet transform and especially in the post- event processing of the time-varying phenomena. This article reviews the use of wavelet transform approach in processing power quality data. The power quality disturbances like sag, swell, notch, spike, transients and chirp and analyzed using various transform techniques such as Chriplet trans- form, S-transform and Wavelet transform. Wavelet transform has received greater attention in power quality as this is well suited for analyzing certain types of transient waveforms. In this paper, Multi-Resolution Analysis technique (MRA) is used to decompose the disturbances. The detection of signal notches in weak utility system is a difficulty of power quality detection. Also it is the focus of power quality detection research. A new strategy of wave- let transformation is used to realize the detection of power quality disturbance is mentioned. Daubechies wavelet transformation and dyadic filter based multi resolution algorithm are used in wavelet arithmetic. This paper will demonstrate an application of wavelet transform in this area which is superior in many respects to the earlier methods.
Index Terms- : Dyadic analysis, Filters, Notches, Wavelet transform
1 INTRODUCTION
—————————— ——————————
he emergence of power quality as a topical issue in power systems in the 1990s largely coincides with the huge ad- vancements achieved in the computing technology and in- formation theory. This unsurprisingly has spurred the develop- ment of more sophisticated instruments for measuring power quality disturbances and the use of new methods in processing the measurements. Fourier theory was the core of many tradition- al techniques and it is still widely used. However, it is increasing- ly being replaced by newer approaches notably wavelet transform and especially in the post-event processing of the time-varying
phenomena.
Voltage notching is a type of periodic waveform distortion pro-
duced by the normal operation of power electronics devices when
current commutated from one phase to another. Three phase con-
verters are the most important case of voltage notching. The
notches occurs when current commutated from one phase to
another and during these periods there is a momentarily short
circuit between two phases. The severity of the notch is deter-
mined by the source inductance between the converter and the
point being monitored. Voltage supply waveform with voltage
notches due to the operation of a six-pulse converter [1] has been
shown in Fig.1. Voltage notches are a real type of power quality
disturbance that falls between harmonics and transient distor-
tions. Since notches occurs continuously with the voltage wave-
form so it can be characterized using the voltage harmonic distor-
tion. Frequency components associated with notches will be very
high so using harmonic measurement equipment it is impossible
to measure. Other quality standards, such as the Engineering
Recommendation G5/4 [2] recommended that the notch depth
should not exceed 15% of the nominal fundamental peak voltage
and that the peak amplitude of oscillations, due to the commuta-
tion at the start and the end of the notch, should not exceed 10%
of the nominal fundamental peak voltage.
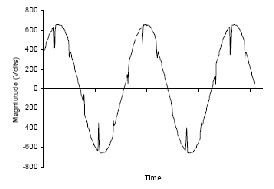
Fig.1. Voltage notches produced by a six pulse converter.
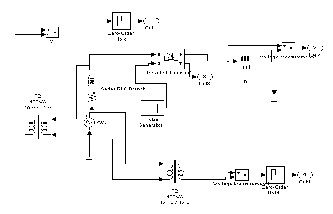
Again weak utility system with large source inductance creates deep notches in the line voltages when high current switching occurs in a power electronics converter. The synchronizing signal of the converter is generally obtained from the front end of the supply line voltages through step down transformers. So, the supply notches are reflected in the synchronizing voltages. The converter mal-functions due to the deep in the voltage signals as the notches produce false zero crossing and ultimately lead to gating signal instability[3]. Without any delay the correct zero crossing instants must be found out as these instants are used for time-critical synchronization. Many attempts are taken to combat this problem [3]-[18]. The notch magnitudes are reduced by low pass filters. But there is a disadvantage. It introduces additional phase shift in the synchronization signal. Gating instability in the converter may be caused due to voltage reduction in a weak sys-
IJSER © 2011
http://www.ijser.org
International Journal of Scientific & Engineering Research Volume 2, Issue 11, November-2011 2
ISSN 2229-5518
tem due to commutation reactance [3]-[7]. To filter out high and low frequency noises which remain outside the pass band, band pass filter with frequency 40Hz with a center frequency at the fundamental of the supply frequency can be used. But the supply frequency must remain constant which is a disadvantage and also the phase shift by the filter due to high Q setting takes away the advantage of this scheme [3, 7, and 8]. The use of zero crossing digital PLL is useful under wide supply frequency change to get synchronized firing pulses but the frequency of the reference sig- nal must not change readily. The zero crossing still remains in the system which is the error of this approach [3, 9, 10, and 11]. In predictive linearization method, the distorted reference voltage signal is linearised in the near the zero-crossing region in order to obtain an approximate location of the zero crossing instant [1, 10]. The drawback are large memory requirement, assumption of con- stant communicating inductance and prediction of the same commutation delay for transient and steady state which is not true[3,7].The voltage of the transformer before supplying the con- verter is assumed to be free of distortion. Its implementation in analog-digital environment is moderately complicated. The noise reduction by predictive digital filtering [13] method has three cascaded filtering blocks but no heuristic reasoning or decision making blocks. This approach cannot tolerate the large frequency variations which may occur with stand-alone generator set and also the sinusoidal nature of the waveform is not fully restored. By the use of sinusoidal band-pass predictor adapting itself with line frequency [14] instead of linear band pass predictor in [13], the sinusoidal nature can be restored. In order to detect the true zero crossing instants of the line voltage signal application of Neural Network (NN) is done. By utilizing the redundant infor- mation obtained from ail the three phases [15] accurate operation is achieved. The method requires training of the Neural Network a DSP is utilized to get transformation of the three use phase utili- ty voltage phasors to get the correct phase and frequency infor- mation of synchronized reference frame PLL phase. Depending on the disturbance level and the different requirements a tradeoff between the dynamic stiffness and the robustness of the system is required which is an involved task [16]. Line synchronization using switched capacitor filters is detailed in [17]. Adaptive filter- ing is realized in this scheme but then also it has problems in tun- ing as well as error tolerances, frequency drifting for time and parameter variations with temperature [18]. According to [18] the error can be reduced by advanced digital signal processing tech- nique like harmonic cancellation without fundamental phase shift and disturbance observer based negative and zero sequence com- ponents elimination. The experimentally achieved response time of the scheme is 8ms. An NN based zero crossing detection is de- scribed in [19]. With comparators line voltages are measured and regularity of the zero crossing is assured by feedback of the time elapsed from the previous zero crossing. But there is a disadvan- tage. The frequency variation is assumed to be within 2%. In this paper a simple method of zero crossing detection of the synchro- nization signal contaminated with switching disturbances using
Wavelet transform is proposed. In this method, no tuning is ne- cessary and is applicable for wide range of frequency variation and it is fast.
2. Wavelet
Wavelet analysis is a technique for carving up function or data into multiple components corresponding to the different frequen- cy bands. The main idea existed since the early 1800s when Joseph Fourier first discovered that signals could be represented as su- perposed sine and cosine waves, forming the basis for the infam- ous Fourier analysis. From the beginning of 1990s, it began to be utilized in science and engineering, and has been known to be particularly useful for analyzing signals that can be described as aperiodic, noisy, intermittent or transient. With these traits, it is widely used in many applications including data compression, earthquake prediction, and mathematical applications such as computing numerical solutions for partial differential equations. In recent year it is widely applied in power quality measurement and assessment. Wavelet analysis is a form of time-frequency technique as it evaluates signal in the time and frequency do- mains simultaneously. The Fourier transform is a frequency do- main approach which converts a continuous time signal into fre- quency domain. Fourier representation X (f) which is calculated by the Fourier transforms integral shown by
(1)
The disadvantage of frequency-domain analysis approach is that a significant amount of information may be lost during the trans- formation process. This information is non retrievable unless a permanent record of the raw vibration signal has been made. The problem of Fourier transform is overcome up to some extent us- ing Short Term Fourier Transform. STFT is simply the result of multiplying the time series by a short time window and perform- ing a discrete Fourier transform. Mathematically for a signal , it is written as,
STFT (2) For discrete signals, this transform is known as Short Term Dis-
crete Fourier Transform (STDFT) expressed mathematically with signal & window as
(3)
Application of STFT have been used to for analyzing different vibration signals for different application but having problem that time resolution is same for all spectral components. This problem is reduced by using the wavelet transform. It is a technique which allows the time-frequency place to be divided in a more flexible way such that a smaller time is use for higher frequencies & larger time is used for lower frequencies. It is calculated by convolving the wavelet with the original signal, multiply the shifted wavelet with the original signal, then sum the result to produce a single value.
IJSER © 2011
http://www.ijser.org
International Journal of Scientific & Engineering Research Volume 2, Issue 11, November-2011 3
ISSN 2229-5518
2.1 Continuous Wavelet
Wavelets, ―small waves‖ which are functions with limited energy
and zero average,
(4) The functions are typically normalized, and centered in the neighborhood of The continuous wavelet transform (CWT) was introduced in 1984 by Morlet and Co-workers to anal- ysis geophysical signals with some kind of modified windowed Fourier transform (WFT), which reads,
time and frequency resolution. The MSD technique decomposes a given signal x(t) into its detailed and smoothed versions. In power quality (PQ) disturbance signals, many disturbances contain sharp edges, transitions, and jumps. By using the MSD technique, the PQ disturbance signal is decomposed into two other signals; one is the smoothened version of the PQ signal and the other, the detailed version of the PQ disturbance signal that contains the sharp edges, transitions, and jumps. Through dyadic filter banks MSD can easily achieved. So, the MSD technique discriminates disturbances from the original one and analyses them separately. We will consider the smoothed version of the PQ signal and in- vestigate its filtering property to make the signal disturbance notch free.
Fh S t, w


1 s( y)hy t etwy dy
2 R
For
s L2 (R) a time – continuous signal and
h L2 (R) a
window function. Hence
L2 (R) denotes the space of square
Integral functions on R. The modification of the WFT was estab- lished by combining window function and Fourier mode etwy in- to one window function that can be scaled. This modification
become the CWT given by,

1 t b

W [s](a, b)

s(t) a
dt.
a R
The continuous wavelet transform is defined as the convolution between the original signal s(t) and a wavelet a,b (t).
Fig.2 Utility system with high inductive load.
3. Designing Daubechies Wavelet Filters
| φ(t)=h(0)√2φ(2t)+ h(1)√2φ(2t-1)+ | h(3)√2 | φ(2t-2)+ | h(3)√2 |
| | | | | φ(2t-3) | | | |
| | | | (5) | Where, h (0)= (1/4√2)/(1+√3) | | | |
Where s(t) is the input signal; ‗a‘ is the scaling factor; ‗b‘ is the translation parameter; and (t) is called mother wavelet. The wavelet function is given by


The Discrete Wavelet Transform (DWT) coefficients are usually sampled from the CWT on a dyadic grid parameters of translation b = n*2m and scale a = 2m and is defined as


(7)
2.2 Discrete Wavelet
An important property of discrete wavelet transform is the MSD
technique which decomposes a signal into scales with different


h (1)= (1/4√2)/(3+√3)
h (2)= (1/4√2)/(1-√3)
h(3)= (1/4√2)/(3-√3)
and
g(0)= (1/4√2)/(3-√3)
g (1) = - (1/4√2)/(1-√3)
g (2) = (1/4√2)/(1+√3)
g (3). = - (1/4√2)/(1+√3)
2K+N-1
Sj(k) =∑h(m-2k)Sj+1(m)
m=2k
For Daubechies wavelet N=4
For K equal to 0,1,2,3
IJSER © 2011
http://www.ijser.org
International Journal of Scientific & Engineering Research Volume 2, Issue 11, November-2011 4
ISSN 2229-5518
Sj(0) = h(0)Sj+1(0)+ h(1)S j+1(1)+ h(2)S j+1(2)+ h(3)S j+1(3) Sj(1) = h(0)S j+1(2)+ h(1)S j+1(3)+ h(2)S j+1(4)+ h(3)S j+1(5) Sj(2) = h(0)S j+1(4)+ h(1)S j+1(5)+ h(2)S j+1(6)+ h(3)S j+1(7) Sj(3) = h(0)S j+1(6)+ h(1)S j+1(7)+ h(2)S j+1(8)+ h(3)S j+1(9)
dj(0) = g(0)Sj+1(0)+ g(1)S j+1(1)+ g(2)S j+1(2)+ g(3)Sj+1(3) dj(1) = g(0)Sj+1(2)+ g(1)S j+1(3)+ g(2)S j+1(4)+ g(3)Sj+1(5) dj(2) = g(0)Sj+1(4)+ g(1)S j+1(5)+ g(2)S j+1(6)+ g(3)Sj+1(7) dj(3) = g(0)Sj+1(6)+ g(1)S j+1(7)+ g(2)S j+1(8)+ g(3)Sj+1(9)
4. DETECTION OF TRUE ZERO CROSSING OF THE SYNCHRONIZING
SIGNAL
The trend signal retains the major portion of the energy content, so the trend waveform is close to the signal waveform with reduced disturbances. A single phase, (R) phase angle control switched circuit configuration with thyristors as switches has been simulated to create the environment of switching disturbances in the synchro- nization signal. Subsequently WAVELET TRANSFORM tool box with Daubechies wavelet is used to recover the noise free synchro- nizing signal for detecting the instant of the true zero crossing of the signal.
4.1 Case Study
The input synchronous waveform of the R-phase is plotted in the
Fig. 2 for load neutral connected to input supply neutral and load
neutral not connected to the input supply neutral respectively.
Thyristor in each phase is triggered at an angle of 60ْ from neu-
tral reference zero of each phase. If the neutrals were not con-
nected then the load currents in 3-phases would be dependent on
each other and there will be an effect of switching of any thyristor
in a phase on the other phases. So we can observe more notches.
These small notches are important because they affect the nova1
zero crossing instants for certain firing angles.
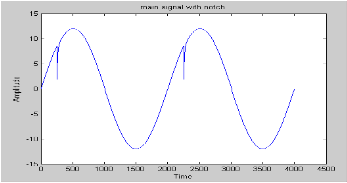
Fig.3 Primary signal without decomposition
level 6 is a staircase type sinusoidal. This signal leads to different kinds of situation where with the desired synchronization signal comparatively high frequency low amplitude is added. Further, the magnitude of this high frequency component is very small is found out by the Fourier analysis of the signal. So, in order to eliminate both notch type disturbances and any false zero crossing problem. MSD technique can be effectively applied to a signal. The Fourier series co-efficient of the signal contaminated with noise and the transformed signal in different levels using MSD are plotted in Fig.4 (a). It is seen that the Frequency-Magnitude plot of signals are all coincident and there is a minute difference in the plot for the signals at level 4 and 5. A very low magnitude signal at a frequency of 1600
Hz is observed after Level 6 denoising. As after Level 6 32 (2048/2^6) samples in one time period (0.02sec), and a magnitude at a frequency of 1600 Hz (32x50 Hz) due to sampling process ex- cept at a frequency of 50 Hz is observed. The time required for ef- fective filtering up to level 6 is approximately 64 times the sampling time period i.e. 0.6 ms approximately in this study and it is a big advantage in comparison to the earlier methods.
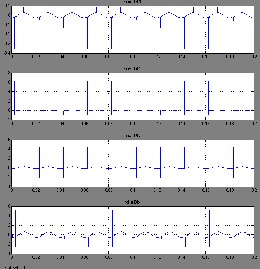
Fig.4 (a) Signals after different decomposition
The noise data or the detail error for different level of decomposi- tion is shown in Fig. 4(b)
4.2 Different level of decomposition
The noised signal in Fig.3 is decomposed up to level 6 in or- der to have the trend or average signal. 102400 Hz is taken as the sampling frequency for the first level of decomposition which is 2048 times the supply frequency 50 Hz. The notches are being reduced in each level of decomposition and almost disappear in level 5. Hence, the shape of the waveform at
IJSER © 2011
http://www.ijser.org
International Journal of Scientific & Engineering Research Volume 2, Issue 11, November-2011 5
ISSN 2229-5518
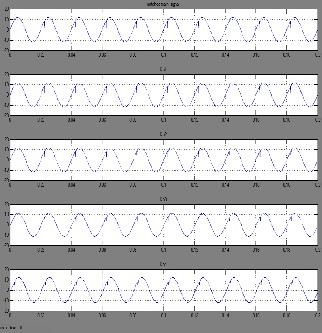
Fig.4 (b) Noise level for different level of decomposition
5. CONCLUSION
A new method of Wavelet transform to denoise a distorted weak AC signal is described. It is shown that this scheme is applicable for a wide range of frequency and the time required for removing the notch is insignificant. This method also overcomes the prob- lem in locking the signal as faced in the schemes using PLL. The scheme is verified through MATLAB simulation and gives a very satisfactory performance.
REFERENCES
[1] http://grouper.ieee.org/groups/harmonic/iharm/docs/data/
[2] Engineering Recommendation G5/4, Planning Levels for Harmonic Voltage Distortion and the Connection of non-linear Equipment to Transmission Systems and Distribution Network in the United king- dom,2001.
[3] R.Weidenhug, F.P.Dawson, and R.Bonen, ―New Synchronization Method for Thyristor Power Converters to Weak AC-System,‖ IEEE Transaction on Ind.Electron. Vol.40, PP.505-511, October 1993.
[4] R.Kedll, “Detecting cross over moments of alternating voltages,” EPE Con-
ference of Power Electronics and Application, Brussels, Vol.1, PP. 223-227,
1985.
[5] F.J.Bourbeau, “LSI based three phase thyristor firing circuit,” IEEE Transac- tion, Vol.19, PP.575-578, 1989.
[6] W.McMurray. “The close loop stability of power converters with an Inte-
grating controller,” IEEE Trans. Ind.Appl., Vol.18, PP.521-531, 1982.
[7] A.Mirbob and A.El.Amaway, “Performance analysis for a novel Micropro- cessor based controller for a phase controlled rectifier,” IEEE Vol.23, PP.57-
66, 1987.
[8] L.Kauferle, R.Mey, and Y.Rogovsky, “HVDC station connection,” PAS.
Vol.1, PP.1610-1617, 1975.
[9] S.Simard and V.Rajagopalan, “Economical equidistance pulse firing scheme for thyristorized DC drives,” IEEE Trans. Ind. IECI Vol.425-459, 1975.
[10] W.L.Huy, R.Feuillet, and D.Roye, “A digital firing scheme for thyristorised converter,” IEEE Ind. Appl. Conf. Vol.2, PP.407-503, 1979.
[11] S.Krishna Bhat, “Novel equidistant digital pulse firing schemes for three
phase thyristor converter,” Int.J.Electronics, Vol.50, no.3, PP.125-127.
[12] O.H.Ptitscher, “A Microprocessor Control Scheme for naturally commutated thyristor converter with variable frequency supply,” Conf. Rec.IFAC Contr. Power Electron. Elect. Drives. Luanne, Switzerland, 1983, PP.431-435.
[13] O.Vainio and S.J.Ovska, “Noise Reduction in Zero Crossing Detector by Predictive Digital Filtering,” IEEE Trans. On Industrial Electronics, Vol.42, no.1, PP.58-62, Feb.1995.
[14] S.Valiviita, “Neural Network for Zero Crossing Detector for Distorted Line voltage in Weak AC system,” IEEE Trans. On Measurement Technology Conf. IMTC Vol.1, PP.280-285, April1998.
[15] L.N.Armda, S.M.Silva, B.J.C Fitho, “A PLL Structure for Utility Connected
System,” IEEUIAS Ann.Conf. Vol.4, May 2001.
[16] G. Bos and J.Levasscur, “A Novel Line Synchronization Scheme for Static
Power Converters,” IEEWIECON Conf. Proc. PP.136-142, 1989.
[17] S.Chen and G. Joos, “ A Novel DSP-Based Adaptive Line Synchronization System for Three Phase utility phase Power Converter,” IEEE/PESC Conf. Rec., Vol.2,PP.528-532, June 2001.
[18] S. Valiviita, “Zero Crossing Detection of Distorted Line Voltages Using I-b
Measurements,” IEEE Trans. On Ind. Electron, Vol.46, PP.231-235.
[19] W.Kanitpanyacharoean and S. Premrudeepreechacharn, “Power Quality

Problem Classification using NN tools” IEEE transaction, PP.252-255.
First S.Debdas was born in Naihati, West Ben- gal, India, on November, 1978. He graduated in Electrical Engineering in 2001 from the Bengal Engineering College Shibpour, Howrah, West Bengal, India and M.Tech in Electrical Power
System from the Bengal Engineering and Science University Shibpur, Howrah, West Bengal, India. The author is now a re- search scholar of NIMS University Jaipur, Rajasthan India. His special field of research includes power quality, harmonic detec- tion and real time condition monitoring system. Mr.S. Debdas became a Member (M) of IACSIT and IAENG.

Second M.F.Qureshi was born in Raipur, Chhattisgarh on 07th of July 1958.He received his B.E. in Electrical Engineering from GGDU, Bilaspur in the year 1984 and M.E in Electrical High Voltage from RDU Jabalpur in the year of
1998 and PhD Electrical Engineering from
GGDU in 2004. His special field of research in- cludes fuzzy type two, high voltage; power quality, harmonic detection and real time condition monitoring system.
Now he is working as Principal in Govt. Polytechnic College, Janjgir-Champa, and Chhattisgarh, India.
IJSER © 2011
http://www.ijser.org