
International Journal of Scientific & Engineering Research, Volume 6, Issue 5, May-2015 148
ISSN 2229-5518
Application of Taguchi Method to Study the Influence of Cutting Parameters on the Surface Hardness in Turning Inconel 718
Dr.C.Srinivas1, Ch. Deva Raj2*, V.Rahul Jetson3, Sk.Basheer ahmed4, P.Mastan Rao5
Abstract— In this study, the Taguchi method is used to investigate the relation between changes in hardness caused on the material surface due the turning operation with respect to different machining parameters. The orthogonal array, the signal-to-noise ratio, and analysis of variance are employed to study the performance characteristics in turning operations of Inconel 718 bars using TiCN – Al2 O 3 coated cemented carbide insert tools. Three cutting parameters namely, speed, feed rate, and depth of cut are used to find the optimum combination of the cutting parameters to minimize the surface hardness using Taguchi method. Experimental results are provided to illustrate the effectiveness of this approach.
Index Terms— Turning, Taguchi, Inconel 718, Vickers surface hardness, S/N ratio.
—————————— ——————————
N modern industry the goal is to manufacture low cost, high quality products in short time. Automated and flexible manufacturing systems are employed for that purpose along with computerized numerical control (CNC) machines that are capable of achieving high accuracy and very low pro- cessing time. Turning is the first most common method for cutting and especially for the finishing machined parts. In a turning operation, it is important task to select cutting param- eters for achieving high cutting performance. Usually, the de- sired cutting parameters are determined based on experience
or by use of a handbook.
Hardness is generally considered as resistance to penetra-
tion. The harder the material, the greater is the resistance to
penetration. Hardness is directly related to the mechanical
properties of the material. Factors influencing hardness in-
clude microstructure, grain size, strain hardening, etc. The
most popular methods are brinell, vickers and rockwell hard-
ness tests for metals and alloys. Always researchers have tried
to investigated the relation of surface roughness with different
process parameters of different machining operations like drilling, milling etc. But there is a gap in determining of the exact affect of speed, feed and depth of cut on hardness of work piece in turning operation. Therefore this aspect has
been selected for study in this research paper.
To select the cutting parameters properly, several mathemat-
ical models [1–5] based on statistical regression or neural net-
work techniques have been constructed to establish the relation-
ship between the cutting performance and cutting parameters.
Then, an objective function with constraints is formulated to
solve the optimal cutting parameters using optimization tech-
————————————————
1Assoc. Prof.,R.V.R.&J.C. College of Engineering,Guntur-19, srinivaschandana2010@gmail.com
2*Asst. Prof., R.V.R.&J.C. College of Engineering,Guntur-19, chdevaraj@g mail.com
3Asst. Prof.,K.H.I.T., Dasari Palem ,Guntur-19,
4Asst. Prof., Malineni Inistitute of Engineering,Guntur
5Asst. Prof., P.V.P. Sidhardha Institute of Technology, Vijayawada-7,
pmastanrao@yahoo.co.in
-niques. Therefore, considerable knowledge and experience are required for this approach. In this study, an alternative approach based on the taguchi method [6–8] is used to deter- mine the desired cutting parameters more efficiency.
Taguchi has developed a methodology for the application of designed experiments, including a practitioner’s handbook [1]. This methodology has taken the design of experiments from the exclusive world of the statistician and brought it more fully into the world of manufacturing. His contributions have also made the practitioner work simpler by advocating the use of fewer experimental designs, and providing a clearer understanding of the variation nature and the economic con- sequences of quality engineering in the world of manufactur- ing [1,2].
In Taguchi method, the word "optimization" implies "de- termination of best levels of control factors". In turn, the best levels of control factors are those that maximize the signal-to- noise ratios. The signal-to-noise ratios are log functions of de- sired output characteristics. The experiments, that are con- ducted to determine the best levels are based on "orthogonal arrays", are balanced with respect to all control factors and yet minimum in number. This in turn implies that the resources (materials and time) required for the experiments are also minimum.
The use of the parameter design of the taguchi method to optimize a process with multiple performance characteristics includes the following steps [11]:
1. Identify the performance characteristics and select process parameters to be evaluated.
2. Determine the number of levels for the process pa- rameters and possible interactions between the pro- cess parameters.
3. Select the appropriate orthogonal array and assign- ment of process parameters to the orthogonal array.
4. Conduct the experiments based on the arrangement
IJSER © 2015 http://www.ijser.org
International Journal of Scientific & Engineering Research, Volume 6, Issue 5, May-2015 149
ISSN 2229-5518
of the orthogonal array.
5. calculate the total loss function and the s/n ratio.
6. Analyze the experimental results using the s/n ratio
and anova.
7. Select the optimal levels of process parameters.
8. Verify the optimal process parameters through the
confirmation experiment.
.
2.1 Selection of cutting parameters and their levels inal
Stage
The cutting experiments were carried out on an Johnford T35
CNC lathe using TiN coated tools with the grade of P-20 for
the machining of AISI 1030 steel bars. In the tests used inserts were TNMG160404-MA,TNMG160408-MA and TNMG160412- MA.. The initial cutting parameters were as follows: insert radius of 0.8 mm, a feed rate of 0.25 mm/rev, and a depth of
cut of 1.5 mm. The feasible range for the cutting parameters was recommended by a machining handbook, i.e., insert radi- us in the range 0.4–1.2 mm, feed rate in the range 0.15–0.35 mm/rev, and depth of cut in the range 0.5–2.5 mm. Therefore, three levels of the cutting parameters were selected as shown in Table 3.
Inconel 718 is Gamma Prime (Ni3 Nb) strengthened alloy with excellent mechanical properties at elevated temperatures, as
well as cryogenic temperatures. The chemical composition of Inconel 718 is given in Table 1. The properties of Inconel 718 are given in Table 2.
Inconel 718 is used in any environment that requires resistance to heat and corrosion but where the mechanical properties of the metal must be retained.
High-speed machining to cut nickel-based super alloy Inconel
718 has long been researched to increase cutting process
productivity [13]. The challenge and difficulty to machine In-
conel 718 is due to its profound characteristics such as high
shear strength, tendency to weld and form build-up edge, low
thermal conductivity [12], and high chemical affinity. Inconel
718 also has the tendency to work harder and retain major part
of its strength during machining. Due to these characteristics,
Inconel 718 is not easy to cut and thus has been regarded as a
difficult-to-cut material. Inconel 718 being a difficult-to-
machine material requires hard cutting tool
A methodology was developed to study the influence of cut- ting parameters on the surface hardness developed after turn- ing of Inconel 718 with TiCN – Al2 O3 coated cemented carbide insert.
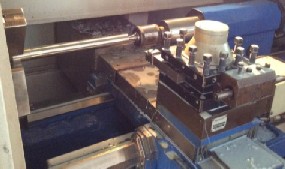
The workpiece considered for the experiment was Inconel 718 and cemented carbide insert with TiCN – Al2 O3 coating was used as cutting tool which were shown in Figures 3.1 and 3.2 respectively. The ISO designation of the cutting tool insert is TNMG 160408–MT. Turning tests were carried out on a Com- puter Numerically Controlled (CNC) lathe machine under wet condition using ISO VG68 cutting fluid. The CNC lathe ma- chine, located in “M. Govind & Sons”, Perecharla, Guntur, used for the experimental purpose was of Simple Turn type by ACE Designers Limited and was shown in Figure 3. Three cutting parameters (speed, feed rate and depth of cut) were considered with three levels for each cutting parameter. The cutting speeds were 300, 400 and 500 rpm. The feed rates used were 0.05, 0.1 and 0.15 mm/rev. The depths of cut of 0.1, 0.3 and 0.5 mm were used. The cutting parameters and their lev- els were summarised in Table 3.
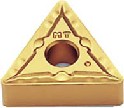
Figure 2 Cutting tool: TiCN−Al2 O3 coated cemented car- bide insert
IJSER © 2015 http://www.ijser.org
International Journal of Scientific & Engineering Research, Volume 6, Issue 5, May-2015 150
ISSN 2229-5518

Levels of the experi- mental factors | Factors | ||
Levels of the experi- mental factors | Speed -N (rpm) | Feed rate-f (mm/rev) | Depth of cut -d (mm) |
1 | 300 | 0.05 | 0.1 |
2 | 400 | 0.10 | 0.3 |
3 | 500 | 0.15 | 0.5 |
Three experimental factors and three levels for each factor are considered. So, L9 orthogonal array was taken and the exper- imental combinations were shown in Table 4.
Experiment | Factor A | Factor B | Factor C |
1 | 1 | 1 | 1 |
2 | 1 | 2 | 2 |
3 | 1 | 3 | 3 |
4 | 2 | 1 | 2 |
5 | 2 | 2 | 3 |
6 | 2 | 3 | 1 |
7 | 3 | 1 | 3 |
8 | 3 | 2 | 1 |
9 | 3 | 3 | 2 |
The workpiece was initially of about 32 mm diameter and 345 mm length. It was first center-drilled on one side as shown in Figure 4. The workpiece was then set up on the CNC lathe machine as shown in Figure 5. Turning operation was first performed on the workpiece using CNC lathe to reduce the diameter to 30.9 mm for a length of 160 mm in order to mini- mize any effect of non-homogeneity on the experimental re- sults. The nine experimental runs are performed based on the combinations from Table 4 with each experiment carried for a length of 15 mm.
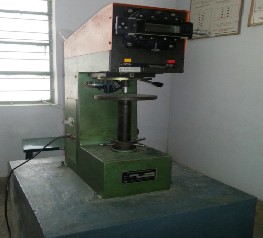
After machining, the surface hardness was measured using Vickers Hardness Tester of model VM – 50 which was shown in Figure 6. The Vickers hardness test uses a diamond indenter which is a pyramid with square base. The angle between the faces of pyramid is 136o as shown in Figure 7. The test load selected was 10 kg. The length of diagonals (d1 and d2 ) of the indentation was measured to calculate the hardness. The Vickers Hardness Number (HRV) of materials is obtained by dividing the applied force P, in kg, by the surface of the py- ramidal depression which yiels the relationship,
HRV = 1.854 * p/d2 (1) Where,
HRV = Vickers hardness number
P = applied force in kg
d = average length of the diagonals in mm
d = (d1 +d2 ) / 2 (2)
The lengths of the diagonals d1 and d2 along with the aver-
age diagonal length (d) and the Vickers hardness number cal-
culated using equations 1 and 2 were shown in Table 5.
IJSER © 2015 http://www.ijser.org
International Journal of Scientific & Engineering Research, Volume 6, Issue 5, May-2015 151
ISSN 2229-5518
5 | 0.171 | 0.169 | 0.170 | 641.52 |
6 | 0.162 | 0.187 | 0.1745 | 608.86 |
7 | 0.178 | 0.155 | 0.1665 | 668.78 |
8 | 0.100 | 0.194 | 0.147 | 857.97 |
9 | 0.181 | 0.182 | 0.1815 | 562.80 |
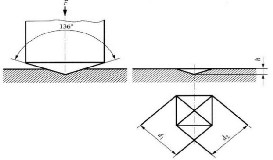
Table 6 shows the selected design matrix based on Taguchi L9 orthogonal array consisting of machining conditions and the experimental results of the response − surface hardness (HRV). All these data were utilised for the analysis and evalu- ation of the optimal parameter combination.
To determine the effect each variable has on the output, the signal-to-noise (S/N) ratio needs to be calculated for each ex- periment conducted. The SN ratio formulae are given below: Smaller-the better (minimize):
S/NS = -10 * ![]() (3)
(3)
y = average of the observed data
r = number of replications
lated and listed in Table 8. The variation of responses of the S/N ratios and the means for each factor was shown in Fig- ures 8 and 9 respectively. The graphs were obtained using the software Minitab 15.
Table 6 Machining conditions and responses
Run no. | Cutting parame- ters | Output response | S/N ratio | ||
Run no. | Spe ed N (rp m) | Feed rate f (mm/ rev) | Dep th of cut d (m m) | Hard- ness (HRV) | S/N ratio |
1 | 300 | 0.05 | 0.1 | 572.22 | -55.1513 |
2 | 300 | 0.10 | 0.3 | 623.06 | -55.8906 |
3 | 300 | 0.15 | 0.5 | 601.94 | -55.5911 |
4 | 400 | 0.05 | 0.3 | 605.39 | -55.6407 |
5 | 400 | 0.10 | 0.5 | 641.52 | -56.1442 |
6 | 400 | 0.15 | 0.1 | 608.86 | -55.6903 |
7 | 500 | 0.05 | 0.5 | 668.78 | -56.5057 |
8 | 500 | 0.10 | 0.1 | 857.97 | -58.6694 |
9 | 500 | 0.15 | 0.3 | 562.80 | -55.0071 |
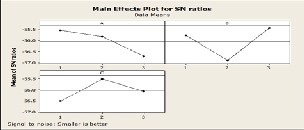
S/NS ratio is used if the system is to be optimized when the response is as small as possible. Factor levels that maximize the appropriate S/N ratio are optimal. To obtain optimal ma- chining performance smaller-the-better performance is con- sidered as the characteristic for surface hardness
Table 6 shows the experimental results for surface hardness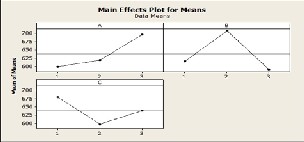
and the corresponding S/N ratio using the equation (3). Since
the experimental design is orthogonal, it is then possible to
separate out the effect of each cutting parameter at different
levels. For example, the mean response for the speed at levels
1, 2 and 3 can be calculated by averaging the responses for the
experiments 1–3, 4–6 and 7–9 respectively. The mean respons-
es for each level of the other cutting parameters were comput-
ed in the similar manner and shown in Table 7. The delta val-
ues represent the algebraic difference between the maximum
and minimum mean values of the levels for each factor.. In the
similar manner, the mean S/N ratios for each factor at each level and also the total mean S/N ratio of the nine experi- ments were calculated and shown in Table 8 In addition, the total mean S/N ratio for the nine experiments was also calcu-
IJSER © 2015 http://www.ijser.org
![]()
International Journal of Scientific & Engineering Research, Volume 6, Issue 5, May-2015 152
ISSN 2229-5518
Speed, N (rpm) | Feed rate, f (mm/rev) | Depth of cut, d (mm) | |
1 | -55.54 | -55.77 | -56.50 |
2 | -55.83 | -56.90 | -55.51 |
3 | -56.73 | -55.43 | -56.08 |
Delta | 1.18 | 1.47 | 0.99 |
Rank | 2 | 1 | 3 |
Mean S/N ratio = -56.03 |
Regardless of the category of the performance characteristics, a greater S/N value corresponds to a better performance. Therefore, the optimal level of the machining parameters is the level with the greatest S/N value. Based on the analysis of the S/N ratio from Table 8 and Figure 8, the S/N ratio was maximum at 1st level of speed, 3rd level of feed rate and 2nd level of depth of cut. Hence, the optimal combination for min- imising the surface hardness is 300 rpm speed, 0.10 mm/rev feed rate and 0.3 mm depth of cut.
4.1 Analysis of Variance
The purpose of ANOVA is to determine which cutting param- eters significantly affect the quality characteristic (here, HRV). ANOVA tests the null hypothesis that the population means of each level are equal, versus the alternative hypothesis that at least one of the level means are not all equal. This is accom- plished by separating the total variability of the S/N ratio, which is measured by the sum of squared deviations from the total mean S/N ratio, into contributions from each of the turn- ing parameters and error. The sums of squared deviations are calculated by using the following
SST = SSF + SSe (4) SST = ![]() 2 (5)
2 (5)
SST = Total sum of the squared deviations about the mean S/N ratio
γj = S/N ratio for the jth experimental run
γm = Mean S/N ratio
In addition, the F-test was used to determine which turning
parameters have a significant effect on the output responses.
The ANOVA for the S/N ratios was shown in Table 9. The
following formulae are used for ANOVA calculations:
MSS = SS/DOF
F = MSS/MSE
Contribution % = SS/SST (6) Where, MSS = Mean sum of squares
SS = Sum of squares
DOF = Degrees of freedom of factors
MSE = Mean sum of squares of error
4.1 Confirmation test
For the optimal combination, N1 f3 d2 , a confirmation experi- ment was performed for 300 rpm speed, 0.15 mm/rev feed rate and 0.3 depth of cut. The predicted S/N ratio for the op- timal combination was -54.42 and the surface hardness for the predicted S/N ratio was 526.02. HRV Surface hardness test when performed on the workpiece for this optimal combina- tion was found to be 530.18 HRV. The S/N ratio for this value of surface hardness was -54.48 which was in close proximity with the predicted value. The results show that using the op- timal parameter settings (N1 f3 d2 ) causes a lower surface hard- ness.
Reference value | Optimal cutting condi- tion | ||
Reference value | Prediction | Experiment | |
Factor com- binations | N1 f1 d 1 | N1 f3 d 2 | N1 f3 d 2 |
HRV | 572.22 | 526.02 | 530.18 |
S/N ratio | -55.1513 | -54.42 | -54.48 |
ccording to this analysis, the most effective parameters with respect to surface hardness are feed rate, speed and depth of cut. The percentage contribution calculated by equation (6) indicates the relative power of a factor to reduce the variation. For a factor with a high percentage contribution, there is a greater influence on the performance.
IThis paper presents the optimisation of the surface hardness during the turning of Inconel 718 with TiCN – Al2 O3 coated cemented carbide insert by using Taguchi method of DOE. The surface hardness was optimised for minimum and the factors accountable for it were 300 rpm speed, 0.15 mm/rev feed rate and 0.3 mm depth of cut. The effectiveness of this approach was verified by the confirmation test and analysis of variance (ANOVA). The predicted and the experimental S/N ratios and Vickers surface hardness of the optimal combina- tion were in close proximity.
[1] Taguchi G. Introduction to quality engineering. Tokyo: Asian Productivity
IJSER © 2015 http://www.ijser.org
International Journal of Scientific & Engineering Research, Volume 6, Issue 5, May-2015 153
ISSN 2229-5518
Organization; 1990.
[2] Ross PJ. Taguchi techniques for quality engineering. New York:McGraw-Hill;
1988.
[3] Phadke MS. Quality engineering using robust design. Englewood Cliffs (NJ): Prentice-Hall; 1989.
[4] [Disney BJ, Pridmore WA. Taguchi methods: applications in world industry.
UK: IFS Publications; 1989.
[5] Yang H, Tarng YS. Design optimization of cutting parameters for turning operations based on the Taguchi method. J Mater Process Technol
1998;84:122–9.
[6] Abuelnaga AM, El-Dardiry MA. Optimization methods for metal cutting. Int
J Mach Tool Design Res 1984;24(1):11–8.
[7] Chryssolouris G, Guillot M. A comparison of statistical and AI approaches to the selection of process parameters in intelligent machining. ASME J Eng Ind
1990;112:122–31.
[8] Chua MS, Rahman M, Wong YS, Loh HT. Determination of optimal cutting conditions using design of experiments and optimization techniques. Int J Mach Tools Manuf 1993;33(2): 297–305.
[9] Montgomery DC. Design and analysis of experiments. 4th ed. New York: Wiley; 1997.
[10] Fisher RA. Statistical methods for research worker. London: Oliver & Boyd;
1925.
[11] Nian CY, Yang WH, Tarng YS. Optimization of turning operations with multiple performance characteristics. J Mater Process Technol 1999;95:90–6.
[12] Ezugwu, E. O., Wang, Z. M. and Machado, A. R., “The machinability of nickel-based alloys: a review”, Journal of Materials Processing Technology, vol. 86, pp. 1–16, 1999.
[13] L. Li, N. He, M. Wang, and Z. G. Wang, “High speed cutting of Inconel 718 with coated carbide and ceramic inserts,” Journal of Materials Processing Tech-
nology, vol. 129, no. 1−3, pp. 127–130, 2002.
IJSER © 2015 http://www.ijser.org