International Journal Of Scientific & Engineering Research, Volume 6, Issue 1, January-2015 633
ISSN 2229-5518
Application of Remote Sensing and GIS in
Rainwater Harvesting: A Case from Goa, India
Dr. Sanjay D. Gaikwad
Abstract—Present paper deals with the application of RS and GIS in rainwater harvesting through case study of Quepem tehsil of Goa. An attempt is made to elaborate the application of RS and GIS in the field of identification mapping of impervious surfaces and roof top area as potential sites for water harvesting using tassel-cap transformation (Kauth and Thomas 1976[1], Cris and Cicone1984 [2]). Terrain analysis, DEM, hill shade, aspect direction of flow of streams, stream network and stream ordering are the features considered for hydro morphological analysis of the region. Land use and land cover, soil, vegetation, water availability, water loss through various sources including evapotranspiration are considered for estimation of water resource up to village level. W ater requirement of domestic and livestock is calculated from daily demand, crop requirement is based on FAO’s estimates of ETcrop. The estimated potential roof rain water may contribute in minimizing the gap between demand and supply of domestic sector as well as to some extent the agriculture of the region.
Budget
—————————— ——————————
1 INTRODUCTION
ATER is a natural resource, fundamental to life, livelihood, food security and sustainable development.
India has more than 17 % of the world’s population, but has only 4% of world's renewable water resources with 2.6% of world's land area. There are limits on utilizable quantities of water, owing to uneven distribution over time and space. There are challenges of frequent floods and droughts in one or the other part of the country. Growing population of fast developing countries will put pressure on utilizable water resources that may lead to deepening water conflicts among different user community. Watershed management envisages a systematic and scientific approach towards conservation, harvesting, proper utilization and safe disposal of flowing water on sustained basis (Chatterjee, K., 2014[3]).
It has been witnessed through the last decade, an enormous interest in application of GIS and remote sensing in hydrology and water resources. Digital image processing technology provides access to spatio- temporal information on watershed from regional to global scales. New sensors and imaging technology have increased the capability of remote sensing in hydro-morphological applications (Bakir, M. et al.
2008[4]).
————————————————
Dr. Sanjay D. Gaikwad, Assistant Professor, Department of Geography, Parvatibai Chowgule College of Arts and Science, Gogal, Margao, Goa. India Pin 403602
E-mail: sdg001@chowgules.ac.in and drsanjaydgaikwad@gmail.com
Human population of the Indian subcontinent is increasing, thereby, increasing the demand for water for domestic, agricultural and industrial use. However, the quantum of rainfall and surface water availability has remained the same; thus, resulting in over-exploitation of ground water, declining water table and deterioration of water quality (Ramakrishnan, D., et al 2009[5]).
India’s water budget (ministry of water resource, Govt. of India 2011[6], 2012 [7]) clearly indicate that only 35% water is available through various, out of that only 48.8 % is usable water resources (48% of 1340 BCM of water), by the end of
2050, annual per head availability of water may fall up to
1140 M3/year from 1816 M3/year of 2001 and 1545 M3/year of
2011. Except North and North-East States, other States of
India may suffer from moderate to severe gap between
exiting water supply and demand. The national water policy
insists to propose framework for water resource development
at micro level at par with national perspective.
Water harvesting (WH) is defined as the concentration; collection and in situ storage of rainwater or at a different location, immediately or at a later time (Siegert, 1994)[8]. WH aims to improve the efficient use of rainfall by capturing it on the site where it falls, and capturing the runoff for irrigation, livestock and domestic purpose (Rockström, 2000[9]; Agarwal, 2001[10]; Ziadat et al., 2006[11]). Wherever, direct rainfall may be insufficient for crop growth, the water available through WH techniques is appropriate way to
IJSER © 2015 http://www.ijser.org
International Journal Of Scientific & Engineering Research, Volume 6, Issue 1, January-2015 634
ISSN 2229-5518
ensure sustainable production. Rainwater Harvesting (RWH) as defined by Boers and Ben-Asher (1982[12]), M. Bakir, et al. (2008) [4], emphasis on storing the harvested water in small ponds, dams, cisterns, shallow aquifers, or in the soil profile to make it available to a target crop, shrub, tree or domestic purposes. It has the potential to reduce the effects of mid- season dry spells and drought, which often reduce crop yields. Landscape conditions dictate the type of RWH system that can be implemented as parameter of quantity and quality of water. The measurement and understanding of how these landscape characteristics influence the hydrological function of WH systems, this is essential for understanding and modeling the WH.
The present paper aims to apply remote sensing and GIS for rainwater harvesting through micro lab investigation. It also deals with the water budget at micro level, demands from various sectors and the availability of water. It highlights the application of tasseled cap and high resolution satellite data for site specific analysis of in situ decentralized water harvesting structures in the study region. At the outset paper takes an account of the potentials of RWH in the study region.
The present paper deals with an application of RS and GIS in watershed management in general and rainwater harvesting in particular. It is supported by case study of rainwater harvesting in Quepem tehsil of Goa. An attempt is made to elaborate the application of geospatial technology in the field of identification and mapping of potential sites for water harvesting. Special emphasize is given on tassel-cap transformation (Kauth and Thomas 1976[1], Cris et al. (1984) [2], Sharma et, al. (1990) [13] to derive Soil Brightness Index (SBI), Green Vegetation Index (GVI) and Wetness Index (WI). Watershed delineation consisting of terrain Analysis, DEM, hill shade, aspect direction of flow of stream, stream network and stream ordering are the features considered for hydro morphological analysis of the region.
Average annual rainfall, Land use and land cover, soil, vegetation, water availability, water loss through evapotranspiration are considered for estimation of water resource up to village level of Quepem tehsil of Goa. Further through high resolution satellite image data, area of water harvesting potentials sites are calculated for roof-top.
Water budget and regional distribution of water has been calculated through Thornthwaite and Mather, (1955) [14] method, RF and PET of the major station of Goa are derived using IDW interpolation of isolines at village level. Data of livestock is taken from Animal Department and domestic water supply from Irrigation department Govt. of Goa. Gaps are analyzed for the requirement of water. Mapping is done
using Arc GIS and Mapmaker whereas images are processed in ENVI 4.2.
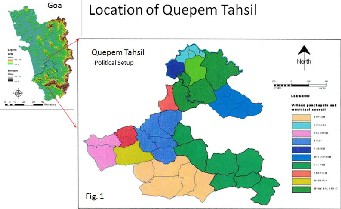
Goa is divided in two districts comprising 11 tehsils with Panjim as headquarter of North and Magrao of South Goa District. Further the state is divided into 12 community development blocks. According to the Census 2011 the total population of State is 1458545. Out of five tehsils of South Goa, Quepem is extended between 150 03’ 54’’ to 15016’39’’ North latitude and 73056’9’’ to 74008’33’’ East Longitude, surrounded by Salcette, Ponda, Sanguem, and Cancona tehsils. It has two municipal centers and 33 villages (Fig.1) all together comprise 28155.91 hectare area. Study region belongs to the western summits of Western Ghats, exhibits small hills, plateaus and gentle plains. The western margin of tehsil is covered by Mabor, Betul and Canaginim beaches. Uplands are dissected by sub streams of river Kushavati a major tributary of river Zuari. The tropical moist deciduous forest occupies large area of tehsil. Geologically it is composed of metamorphic rock consisting of iron ore and manganese ore deposits. The plains are covered with shallow to deep alluvial soils intensively used for paddy cultivation. Lateritic soils of the slopes are brought under cashew and mango cultivation. Tehsils total population is about 81193 (Census 2011[15]). The most populated, rapid developing centers are Curchorem, Quepem, Avedem, Xeldem, Amona, and Sirvoi.
Fig. 1 Location of Study Region, Quepem Tehsil of Goa State, India
5. APPLICATION OF TASSELED CAP
Multi band combination has the capability to enhance the feature of interest to the analyst. The main aim of band combination is to enhance interpretability of feature of interest. The most important linear combination, widely used by the remote sensing community is the “Tassel Cap Transformation” (Kauth and Thomas 1976[1]., Crist and
IJSER © 2015 http://www.ijser.org
International Journal Of Scientific & Engineering Research, Volume 6, Issue 1, January-2015 635
ISSN 2229-5518
Cicone, 1984[2]), the SBI, GVI the Yellow Vegetation index
(YVI) and the Non Such Index (NSI).
TASSELED CAP TRANSFORMATION
Perfect Positive correlation between the Green vegetation Index on Y Axis and
Soil Brightness Index on X Axis.
The coefficients of each combination index are taken from Kauth and Thomas (1976)[1]; Thompson and Wehman (1980) [16], Kauth and Thomas 1976[1], Crist and Cicone (1984) [2], Sharma et al. (1990) [14] to generate the coefficients for GVI and SBI Tasseled Cap transformation has been applied in order reduces the redundancy in the image (Banukumar K., et al. 2011) [17]. Two main features are defined as Brightness (soil) and Greenness (vegetation) are weighted sum of all the ETM+ bands (1, 2,3,4,5 and 7), defined principally by variation in soil reflectance. The contrast between near infrared band and visible band can be related to the substantial scattering of infrared radiation resulting from cellular structure in green vegetation. Targets with high densities of green vegetation would produce a high greenness response and flatter reflectance is express with low greenness values.
Tasseled Cap Transformed image (Fig. 2.1), discriminates vegetative and non-vegetative areas quite comprehensible it makes analysis easier than the original image (Fig.2.2). However, the soil with moisture or inundated pockets is considered as a tank becomes recognizable in this transformed image. The resultant tasseled cap image has been sharpened to identify the edges of water bodies and boundaries of wet and dry soil (Banukumar K., et al. 2011) [17].
An impervious surface consists of built up areas, areas under road, pavement, railway and other permanent built structures. All together covers approximately 35.32% of total geographical area of the Quepem tehsil (Table 2). It also consists of surfaces comprises open areas (~ 1 %) and bared lateritic rocky plateaus with thin veneer detritus have minimal permeability. These areas have maximum surface runoff and massive erosion. The hilly tract covered by
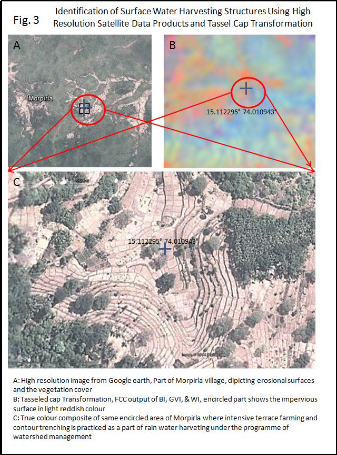
tropical deciduous and semi evergreen vegetation whereas slopes have intensive practice of agriculture (Fig.3). The areas under mining region are clearly seen in the tasseled cap. When compared with the Google Earth image of the same scene, it matches perfectly with the location and extension of such entities.
The impervious surfaces seen in the FCC of Brightness, greenness and wetness index are the priority areas for in situ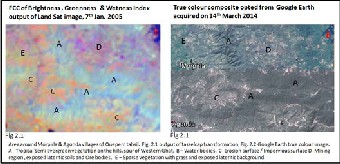
water harvesting. The sites need to be focused where terraces are built; gully plugging and small wired bunds to be constructed. It is evident from the fig 2.1 & 2.2, that the areas appeared impervious in fig. 3 are exactly been considered for watershed management work of Morpila village and surrounding.
RS can be used to assess soil, slope, land cover and infrastructural characteristics that influence the runoff, storage potential WH sites in the watershed (Bulcock 2012) [18]. Fig.3 - A, B, and C shows that there is resemblance in the spatial distribution of impervious surfaces, depicted through the tassel cap transformation and high resolution data. The image clearly represents the terraced farming structures as an evidence of practice of agriculture on the slopes. In low resolution LANDSAT TM images these areas are seen differently. After tasseled cap transformation the whole set of spectral and radiometric data regrouped into principal component like greenness, brightness and wetness index. The pockets of bright impervious surfaces are simply matches with the existing RWH structures at respective sites. The permanent water bodies, large RWH structures are easily mapped using principal component and supervised classification of moderate resolution data, whereas high resolution data can be used for visual mapping of phenomenon.
Management of a watershed demands the rational utilization of land and water resources for optimum production without
IJSER © 2015 http://www.ijser.org
International Journal Of Scientific & Engineering Research, Volume 6, Issue 1, January-2015 636
ISSN 2229-5518
degrading the natural and human resources. According to Vora, K. (2011)[19] the water shade may properly understood after recognition of the inter-relationships among land use, soil and the linkages between uplands and downstream areas through the terrain analysis (fig. 4.1 to 4.4).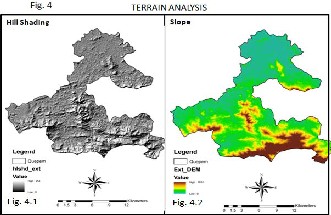
The slope derived from the hill shade i.e. generated from the SRTM data of terrain. The relief ranges from sea level to the height above 1000 feet’s. The lower ranging spurs of the Western Ghats and the hillocks are predominantly controlling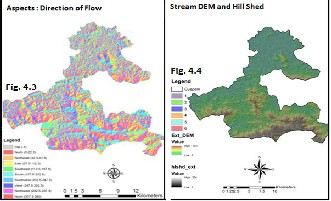
the direction of the slope and direct the flow of water. Major portion of the region has undulating plains, with randomly distributed inselburges. The water moves in all the direction in to sub basins from the dividers. Drainage network exhibits maximum 6 orders of streams. The first order streams may be considered for gully plugging, contour trenching, and nala bunds. Streams up to third orders are to be considered for in situ decentralized water harvesting structures like KT wares, check dams and percolation tanks. This will contribute better watershed management and soil conservation practices in the region.
The land use pattern of the tehsil (fig. 6), reveals that most of the southern part is covered by the reserved forest (8 .80%) whereas the prominent linear settlement pattern in the northern and highly scattered in southern part of tehsil. All together settlement covers 30 % of geographical area. The agriculture shares 28.68% area including paddy, coconut and plantation. The area under orchards shares 24 % of geographical area of region. A water body covers approximately 3.2 % area. Miscellaneous area is occupied by industries (0.73 %), private forests 0.68%, cultivable wasteland and fallow land together covers 1.55 % area. Roads, railways and open areas together cover about 3 % area.
The actual gain of water is measured by balancing the water received from rainfall, the loss through evaporation using Thornthwaite and Mather (1955) [14] water balance approach. The figure 5.1 shows the isohyets of rainfall and isolines of evapotranspiration over the study region. The balance through runoff is considered as the net gain of water at village level (fig 5.2). The average annual gain in the region ranges from 1020mm to 1620mm from north east to south west. The annual net gain of water through rain is 374.29
Million M3 (table 1).
IJSER © 2015 http://www.ijser.org
International Journal Of Scientific & Engineering Research, Volume 6, Issue 1, January-2015 637
ISSN 2229-5518
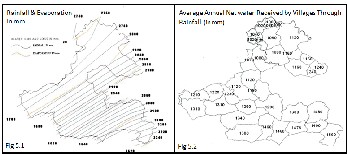
Fig 5 regional water gain through rainfall at village level based on water balance approach
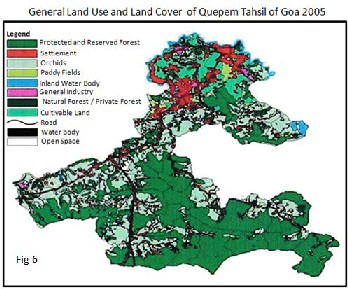
TABLE 1
Annual Maximum Potential of Water Availability in Quepem Tehsil
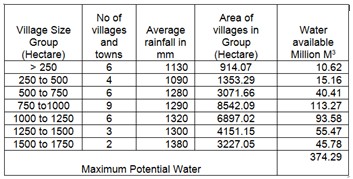
Source: Calculated and compiled by researcher
It is evident from table 2 to 6, that about 8.26 Million M3 of water is evaporated annually. Various crops grown in region need at least 50.83 Million M3 of water during the growing season. The livestock demand is more than 350 Million liters (0.35Million M3) of water per annum. Similarly the domestic demand reveals about 3.79 Million M3 of water throughout the years. The demands at rural and urban regions vary due
to the lifestyle differences. Though the region receives
374.29Million M3 water, practically it is not possible to harvest
water from the forest (private and protected), agricultural
fields, roads and railways (260.27 Million M3). The optimum
limit is 106.81 Million M3 (excluding considering loss by daily
evaporation), only alternative is to focus initially on roof rain
water harvesting.
TABLE 2
Land Use and Loss of W ater through Evaporation and Evapo- Transpiration – Quepem
Source: Land use land cover based on figure 6. Evaporation figures are average for vegetative and non vegetative regions Computed and Compiled by researcher.
It is clear from previous discussion and tables that existing water is not sufficient to cater demand of all the sectors. Either one has to depend on ground water or other alternatives have to be adopted at micro level. Due to rapid urbanization, infiltration of rain water in to the sub soil has decreased drastically and recharging of groundwater has diminished. The only affordable and eco-friendly alternative is to harvest the rainwater to recharge the groundwater efficiently. In general to calculate the volume of potential roof rain water using Gould and Nissen (1999) [20] formula is used,
Harvestable rainwater volume=Rainfall x Built up area x Coefficient of Runoff
Where rainfall is the total amount of rainfall and built up area considered equivalent to the rooftop area. Average Coefficient of Runoff for settlement (60%) Industrial areas (80%) and open rocky outcrops (60%) are considered as leftover water after all sorts of losses. The roof rain water
IJSER © 2015 http://www.ijser.org
International Journal Of Scientific & Engineering Research, Volume 6, Issue 1, January-2015 638
ISSN 2229-5518
harvest potential (table 6) is about 80.94 Million M3; it may cater demands of water from domestic, livestock, agriculture vegetables cultivation in summer season for local folks and to some extent the industries.
Water Demand From Various Crops of Quepem Tehsil
Source : Crop growing period and water need for entire season are based on the standards of FAO., computed and compiled by researcher
Domestic Demand for Water 2011
Source: Population data is obtained from Census 2011, domestic water supply from Irrigation department, Govt. of Goa. Computed and compiled by researcher.
Live Stock Requirement of Water from Quepem Tehsil
Source : Live stock data is obtained from Animal Department ,Govt. of Goa, computed and compiled by researcher
Potential Harvestable Rain Water of Quepem Tehsil
Source: Area of roof and surface taken from table 2, runoff coefficient are taken from Gould and Nissen (1999), runoff of open surfaces and roof of settlement are considered equal like fired tiles/hard lateritic rocky outcrops. Computed and compiled by researcher
Though the region receives assured rain during the South West monsoon, maximum amount of rain is lost through natural process. The potential resources are tapped through very few surface structures. The roof rain water may contribute in minimizing the gap in demand and supply scenario of the study region. The remote sensing and GIS technology has proved its reliability in identifying the impervious surfaces and water harvesting structures. It is very essential to think about more water harvesting options that need to be explored using micro lab investigation and intensive field study.
[1] Kauth, R.J. and Thomas, G.S., "The tasseled Cap -- A Graphic Description of the Spectral-Temporal Development of Agricultural Crops as Seen by LANDSAT." Proceedings of the Symposium on Machine Processing of Remotely Sensed Data, Purdue University of West Lafayette, Indiana, pp. 4B-41 to 4B-51, 1976.
[2] Crist, E. P. and Cicone, R. C, “A physically-based transformation of Thematic Mapper data -- the TM Tasseled Cap”, IEEE Trans. on Geosciences and Remote Sensing, GE-22, pp 256-263, 1984.
[3] Chatterjee, K., “Water Resources Of India”, online www.climatechangecentre.net_pdf_waterresources accessed on 31st Jan
2014
[4] Bakir, M. and Xingnan, Z., GIS and Remote Sensing Applications for Rainwater Harvesting in The Syrian Desert (Al-Badia). Twelfth International Water Technology Conference, IWTC12, 2008, Alexandria, Egypt.
[5] Ramakrishnan, D., Bandyopadhyay, A and Kusuma, K. N., “ SCS-CN and GIS-based approach for identifying potential water harvesting sites in the Kali Watershed, Mahi River Basin, India”. J. Earth Syst. Sci. 118, No.
4, August 2009, pp. 355–368.
[6] Ministry Of Water Resources, “Annual Report 2011-12”, Government of India, New Delhi, 2012.
IJSER © 2015 http://www.ijser.org
International Journal Of Scientific & Engineering Research, Volume 6, Issue 1, January-2015 639
ISSN 2229-5518
[7] Ministry of Water Resources, “Draft National Water Policy”, As Recommended By National Water Board in Its 14th Meeting Held On 7th June, 2012, Government of India,
[8] Siegert, C., “Socio-economics of water harvesting. Water Harvesting for Improved Agricultural Production”. Expert Consultation, Cairo, Egypt 21-25 Nov.1993, FAO, Rome
[9] Rockström., Johan, “Water Resources Management In Smallholder Farms In Eastern And Southern Africa : An Overview”. Phys. Chem. Earth (B), Vol 25(3), 275 – 283, 2000
[10] Agarwal, A., “”Water Harvesting in a New Age”. In: Khurana, I. (Ed.). Making Water Everybody’s Business. Centre for Science and Environment, New Delhi, pp 1-13, 2001.
[11] Ziadat, F., Oweis, T., Mazahreh, S., Bruggeman, A., Haddad, N., Karablieh, E., Benli, B., Abu Zanat, M., Al-Bakri, J. and Ali, A., “ Selection And Characterization Of Badia Watershed Research Sites”. ICARDA, Aleppo, Syria, 2006.
[12] Boers and Ben-Asher, “A review of Rainwater Harvesting”.
Agricultural water Management, 5, 145-158, 1982.
[13] Sharma, S. A., Bhatt, H. P., Ajai: Generation of brightness and greenness transformations for IRS-LISS II data. Journal of the Indian Society of Remote Sensing, September 1990, Volume 18, Issue 3, pp 25-31
[14] Thornthwaite and Mather, “The Water Balance”, Publications in
Climatology, Laboratory of Climatology. Vol. VIII, No.1. pp, 184-220, 1955
[15] Goa: Census 2011, Government of India, http://www.censusindia.gov.in/Meta-Data/metadata.htm#/tab2/subtab26 [16] Thompson; D.R. and Wehmanen, O.A., “Using Landsat Digital data to detect Moisture Stress in Corn-soybean Growing Region.” Photogrammetric Engineering and Remote Sensing, Vol. 46, 1980, pp 1082-9. [17] Banukumar. K, Panneerselvam. A, Aruchamy.S, Ganesh. A., “Surface water mapping for Watershed management using Geospatial techniques.”, International Journal of Geomatics and Geosciences, Volume 2
Issue 1, 2011, p. 298
[18] Bulcock, L.M., Jewitt, G.P.W. and Chaplot, “Improving the Understanding of Water Harvesting Sites in Sub-Saharan Africa Using Remote Sensing.”, 2012, (e-proceeding online) http://www.ru.ac.za/static/institutes/iwr/SANCIAHS/2012/documents/03
0_Bulcock.pdf
[19] Vora, Krunali , “Application Of Remote Sensing & GIS In Watershe d Land Use Development.” Proceeding of National Conference on Recent Trends in Engineering & Technology, 2011.
[20] Gould, J. and Nissen-Petersen, E., “Rain Water Catchment Systems
for Domestic Supply”, International Technology Publications, 1999, United Kingdom.
IJSER © 2015 http://www.ijser.org