the nodal x, y, and z directions. This element is also capable of
International Journal of Scientific & Engineering Research, Volume 5, Issue 9, September-2014 776
ISSN 2229-5518
Application of Nonlinear Concrete Model for Finite Element Analysis of Reinforced Concrete Beams
V. B. Dawari, G. R. Vesmawala
Abstract—The non-linear behavior of reinforced concrete (RC) beams till the ultimate failure is a complicated phenomenon due to the involvement of heterogenic material properties and cracking behavior of concrete. Behavior prediction of reinforced concrete elements till failure is usually carried out using experimental testing, and the observations are recorded only at critical locations due to restriction in cost of testing equipment and accessories. In order to avoid the destructive testing, reduction of the cost of materials and manpower, the behavior prediction of RC beams is generally carried out using numerical methods. This paper presents study on non-linear flexural behavior of reinforced concrete beams. Non-linear finite element analysis of reinforced concrete beams under flexural loading is presented in this paper. Finite element modelling of reinforced concrete beams is carried out using discrete reinforcement modelling technique. The capability of the model to capture the critical crack regions, loads and deflections for various loadings in reinforced concrete beam has been illustrated. Comparison is made between the experimental results and finite element analyses with respect to initial crack formation and the ultimate load capacity of beams. The results obtained in the present study show close agreement with those in the available literature.
Index Terms—.ANSYS, Discrete model, Flexural cracks, Load-Displacement Curve, Nonlinear finite element analysis, Reinforced concrete, Ultimate load.
—————————— ——————————
einforced concrete (RC) has become one of the most important building materials and is widely used in many types of engineering structures. The economy, the effi- ciency, the strength and the stiffness of reinforced concrete make it an attractive material for a wide range of structural applications. Understanding the response of the structural components during loading is crucial to the development of an overall efficient and safe structure. Different methods have been utilized to study the response of structural components. Typically, the behavior of reinforced concrete beams is studied by full-scale experimental investigations. The results are com- pared to theoretical calculations that estimate deflections and internal stress/strain distributions within the beams. Finite element analysis can also be used to model the behavior nu- merically to confirm these calculations, as well as to provide a valuable supplement to the laboratory investigations, particu-
larly in parametric studies.
Buckhouse [1] studied the flexural behavior of RC beams experimentally and compared the results with analytical val- ues. Wolanski [2] has verified and validated the experimental test results provided by Buckhouse [1] using the finite element software ANSYS. Kachlakev, et al. [3] used ANSYS to study concrete beam members with externally bonded Carbon Fiber Reinforced Polymer (CFRP) fabric. The study indicated that the use of a finite element program ANSYS to model experi-
————————————————
• V. B. Dawari is pursuing Ph.D in Structural Engineering Section of S V National Institute of Technology, Surat, Gujarat, India.
E-mail:vaishali.dawari@gmail.com
• G. R. Vesmawala is currently Assistant Professor, Applied Mechanics
Department in S V National Institute of Technology, Surat, Gujarat, India
mental data was viable and the results were reasonably well.
Fanning [4] used 3.0 m long ordinarily RC beams with cross section of 155 mm x 240 mm to validate the FE analysis using ANSYS. The results of the FE models were found to be partic- ularly sensitive to the Young's modulus of the concrete and the yield strength of the reinforcement. Dahmani et al. [5] studied the crack propagation in RC beams using ANSYS software modelled with Solid65 element with smeared rein- forcement approach. Vasudevan and Kothandaraman [6] con- ducted non-linear analysis of six numbers of RC beams using ANSYS based on IS 456: 2000 guide lines and compared the results with analytical calculations. Vasudevan and Kothanda- raman [7, 8] explored the advantages of batch mode approach and non-linear FE analysis has been carried out by creating a single batch file from modelling to complete post processing.
In this paper, the nonlinear material model of concrete in commercially available finite element software ANSYS v12 is
used to evaluate the ultimate load, Load-midspan displace- ment relationship and cracks development of reinforced con- crete beams.
The validity of the model is calibrated against the results of previous experimental studies. The beam model used by
Buckhouse [1] is considered for the first numerical example. This paper also compares the results of flexural response ob- tained using the discrete approach in the present study to the smeared approach used by Dahmani [5] in the second numeri- cal example. The third numerical example demonstrates the ANSYS model to validate the experimental results.
IJSER © 2014 http://www.ijser.org
International Journal of Scientific & Engineering Research, Volume 5, Issue 9, September-2014 777
ISSN 2229-5518
crete. This element has eight nodes with three degrees of free- dom at each node – translations in the nodal x, y, and z direc- tions. This element is capable of plastic deformation, cracking in three orthogonal directions, and crushing. A schematic of
al stress-strain relationship for the concrete is obtained using modified Hognestad piecewise elastic model [10]. Following equations are used to compute the multilinear isotropic stress- strain curve for the concrete (Fig. 3).
the element is shown in Fig 1(a).
E = 57000 f '
(1)
c c
steel reinforcement. This element is a 3D spar element and it has two nodes with three degrees of freedom – translations in
the nodal x, y, and z directions. This element is also capable of![]()
f = Ecε
ε
![]()
1 + ε
(2)
plastic deformation. This element is shown in Fig. 1(b).
0
2 f '
ε = c
(3)
Ec
f
![]()
Ec = ε
(4)
where:
f = stress at any strain ε, psi
ε = strain at stress f
ε0 = strain at the ultimate compressive strength fc '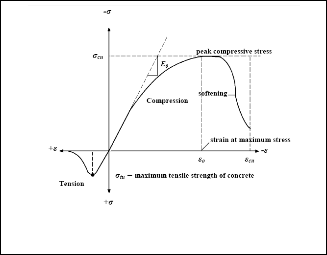
(a)
(b)
Fig. 1. (a) Solid 65 Element (b) Link 8 Element
Fig. 2. Typical uniaxial compressive and tensile stress-strain curve for concrete [9]
Concrete: Concrete is a quasi-brittle material and has high- ly nonlinear and ductile stress strain relationship. The nonlin- ear behavior attributed to the formation and gradual growth of micro cracks under loading. The tensile strength of concrete is typically 8-15% of the compressive strength. Fig. 2 shows a typical stress-strain curve for normal weight concrete [9]. In compression, the stress-strain curve for concrete is linearly elastic up to about 30% of the maximum compressive strength. Above this point, the stress increases gradually up to the max- imum compressive strength. After it reaches the maximum compressive strength σcu , the curve descends into a softening region, and eventually crushing failure occurs at an ultimate strain εcu . In tension, the stress-strain curve for concrete is ap- proximately linearly elastic up to the maximum tensile strength. After this point, the concrete cracks and the strength decreases gradually to zero [9].
Various mathematical models are available to approximate
this nonlinear behavior. In this paper, the compressive uniaxi-
Fig. 3. Typical uniaxial compressive and tensile stress-strain curve for concrete [9]

The model is capable of predicting failure for concrete ma- terials (Fig. 4). Both cracking and crushing failure modes are accounted for. The two input strength parameters i.e., ultimate uniaxial tensile and compressive strengths are needed to de-
IJSER © 2014 http://www.ijser.org
International Journal of Scientific & Engineering Research, Volume 5, Issue 9, September-2014 778
ISSN 2229-5518

fine a failure surface for the concrete. Consequently, a criterion for failure of the concrete due to a multiaxial stress state can be calculated [11].
Fig. 5. Strain curve for the steel reinforcement
Fig. 4. Failure Surface for concrete
In a concrete element, cracking occurs when the principal tensile stress in any direction lies outside the failure surface. After cracking, the elastic modulus of the concrete element is set to zero in the direction parallel to the principal tensile stress direction. Crushing occurs when all principal stresses are compressive and lies outside the failure surface; subse- quently, the elastic modulus is set to zero in all directions, and the element effectively disappears. During the study of past researchers [2],[ 3], it was found that if the crushing capability of the concrete is turned on, the finite element beam models fail prematurely. Therefore, in this study, the crushing capabil- ity was turned off and cracking of the concrete controlled the failure of the finite element models.
For Implementation of the Willam and Warnke [11], mate-
rial model in ANSYS, nine constants are defined as : Shear
transfer coefficients for an open crack; Shear transfer coeffi-
cients for a closed crack; Uniaxial tensile cracking stress; Uni-
axial crushing stress (positive); Biaxial crushing stress (posi- tive); Ambient hydrostatic stress state for use with constants 7 and 8; Biaxial crushing stress (positive) under the ambient hydrostatic stress state (constant 6); Uniaxial crushing stress (positive) under the ambient hydrostatic stress state (constant
6); Stiffness multiplier for cracked tensile condition.

There are three techniques that exist to model steel rein- forcement in finite element models for reinforced concrete: the discrete model, the embedded model, and the smeared model [12]. In the work presented in this paper, discrete modelling technique is used for modelling the reinforcement. The rein- forcement in the discrete model (Fig. 6) uses bar or beam ele- ments that are connected to concrete mesh nodes. Therefore, the concrete and the reinforcement mesh share the same nodes and concrete occupies the same regions occupied by the rein- forcement.
Fig. 6. Discrete Models for Reinforcement [12]
The beam is modelled by creating volumes. To obtain good results from the Solid65 element, rectangular mesh is used. The individual elements of reinforcement are created in the modelling through the nodes created by the mesh of the con- crete volume. The command ‘merge items’ merges separate entities that have the same location. These items will then be merged into single entities.
Displacement boundary conditions are needed to constrain
the model to get a unique solution. To ensure that the model
acts the same way as the experimental beam, boundary condi-
tions need to be applied at the supports and loadings. The
support is modelled in such a way that a hinge and roller is
created. The force applied is applied across the entire modal line.
IJSER © 2014 http://www.ijser.org

International Journal of Scientific & Engineering Research, Volume 5, Issue 9, September-2014 779
ISSN 2229-5518
In nonlinear analysis, the total load applied to a finite ele- ment model is divided into a series of load increments called load steps. At the completion of each incremental solution, the stiffness matrix of the model is adjusted to reflect nonlinear changes in structural stiffness before proceeding to the next load increment. The ANSYS program uses Newton-Raphson equilibrium iterations for updating the model stiffness. New- ton-Raphson equilibrium iterations provide convergence at the end of each load increment within tolerance limits.
on the previous solution history and the physics of the mod-
els, if the convergence behavior is smooth, automatic time stepping increases the load increment up to a selected maxi- mum load step size. The maximum and minimum load step sizes are required inputs for the automatic time stepping.
Failure for each of the models is defined when the solution
for a 1 kN load increment still does not converge. The pro-
gram then gives a message specifying that the models have a
significantly large deflection, exceeding the displacement limi-
tation of the ANSYS program.

For the validation of the modelling and analysis techniques using ANSYS 12, the RC beam model used by Buckhouse [1] is considered. For flexural analysis, a RC beam is modelled in ANSYS 12 using GUI with the details given by Buckhouse [1]. The geometry of the beam is shown in Fig. 7. The FE model in ANSYS is shown in Fig. 8. The properties of steel and concrete are given in Table 1.
Fig. 7. Geometry of the beam for Numerical Example 1

Fig. 8. FE model of the beam for Numerical Example 1
Fig. 9. Load-Displacement Curve for Numerical Example 1
Left support is modelled as hinged and the right support is modelled as roller by constraining the displacement in the relevant directions. Load is given in increments (at each time step increment of 5000 lb).
TABLE 2
![]()
COMPARISON OF THE RESULTS OF FLEXURAL ANALYSIS
TABLE 1
Beam Ultimate
Load (lb.)
Centre-line
deflection
![]()
(in.)
PROPERTIES FOR STEEL AND CONCRETE
![]()
![]()
Property Value
Present study (ANSYS) 16094 3.056
Experimental Study [1] 16310 3.650![]()
Numerical Study [1][2] 16310 3.586
28-Day Compressive Strength of Concrete (psi) Modulus of Elasticity for concrete (psi)
4770
3949076
Fig. 9 shows the load vs. mid-span deflection plot of the present study. The Table 2 shows comparison of load and cen- tre-line deflection at failure of beam. The results are compared
Yield Stress of Steel (psi) 60000
Modulus of Elasticity for steel (psi) 29000000![]()
Poisson’s ratio 0.3
with those reported by Buckhouse [1]. The load – deflection
behavior and the values of Centreline deflections of the of the
finite element model compare well to experimental data ob-
tained from a reinforced concrete beam [1]. The failure mech-
IJSER © 2014 http://www.ijser.org
International Journal of Scientific & Engineering Research, Volume 5, Issue 9, September-2014 780
ISSN 2229-5518

anism of a reinforced concrete beam is modelled quite well using FEA, and the failure load predicted is quite close to the failure load measured during experimental testing [1]. The tri- linear behavior is observed from the load vs. mid-span deflec- tion curve (Fig. 9) which is closely matching with results available in literature [1].
The beam model used by Dahmani et al. [5] is considered for the study. Three-dimensional nonlinear finite element model of a reinforced concrete beam has been developed by Dahmani et al. [5]. The beam specimen used is of size 3000 mm * 500 mm * 200 mm. Tension reinforcement of 2 bars of 16 mm diameter is used. Concrete of 28 days cube strength is 27
MPa and reinforcing steel is with yield stress 525 MPa and
clear cover of 25 mm is considered in this study. A central
point load is applied for the model. SOLID65 solid elements are used for modelling, where the compressive crushing of concrete is facilitated using plasticity algorithm while the con- crete cracking in tension zone was accommodated by the non- linear material model. Smeared reinforcement technique was adopted by Dahmani et al. [5] and reinforcement was intro- duced as a percentage of steel embedded in concrete. The ca- pability of the model to capture the critical crack regions, loads and deflections for various types of loadings in rein- forced concrete beam has been illustrated.
Fig.12. Load-Displacement Curve obtained in the present study for Numerical Example 2

Fig.13. Load-Displacement Curve obtained by Dahmani et al. [5]

Fig. 10. Geometry of the beam for Numerical Example 2
Fig. 11. FE model of the beam for Numerical Example 2

In the present study, the same geometry and the material properties are used with discrete reinforcement modelling method and the results are compared with that of literature [5]. Fig. 10 and Fig. 11 show the geometry and FE model of the beam considered for the study.
Fig. 14. First crack of the concrete beam model for Numerical
Example 2
IJSER © 2014 http://www.ijser.org
International Journal of Scientific & Engineering Research, Volume 5, Issue 9, September-2014 781
ISSN 2229-5518

recorded at midspan using dial gauge of least count 0.01 mm. Hinge and roller support condition is modelled in FE model with span of 900 mm by restraining linear displacements. Fig.
18 shows details of FE model.
(a)
(b)
Fig. 16. Details of beams used for Experimental Study

(c)
Fig. 15. First crack of the concrete beam Cracking in the beam model at (a) 50000 N (b) 60000 N, and (c) 70000 N
Load - displacement curves are plotted as shown in Fig. 12 show the close agreement with the available literature (Dah- mani et al. [5]) in the elastic region as shown in Fig. 13. The first crack load as shown in Fig. 14, i.e. 41682 N is consistent with a load of 42602 N (Dahmani et al. [5]). In the non-linear region of the response, subsequent cracking occurs as more loads are applied to the beam. Cracks grow in the constant moment region, and the beam starts cracking out towards the supports at a load of 50,000 N (Fig. 15(a)). Significant flexural cracking occurs in the beam at 60,000 N (Fig. 15 (b)). Also, di- agonal tension cracks start to form at load of 70,000 N (Fig. 15 (c)). Yielding of steel reinforcement occurs when a force of
68748 N unlike 94,000 N (Dahmani et al. [5]),) is applied. At
this point the displacements of the beam begin to increase at a
higher rate as more loads are applied.
For the Finite element and experimental analysis, three beam specimen of size 1000 mm * 150 mm * 150 mm are con- sidered and details are shown in Fig. 16. Tension bars are of 2 numbers 10 mm diameter, hanger bars are 2 numbers 8 mm diameter and shear reinforcement of two legged 6 mm at 110 mm spacing is used in this study. Concrete of 28 days cube strength as 27 MPa and reinforcing steel with yield stress 525
MPa is used. The clear cover of 25 mm is used in experimental
testing. These beams were tested and analysed for four point
bending test under loading with distance of 350 mm from ei- ther end. The material properties were derived from IS
456:2000 codal provisions and used for plotting multilinear stress strain curve for concrete.
Flexure testing of the beams is carried out using a Universal
Testing Machine of capacity 600kN The two point loading is
applied through a spreader beam with a constant moment zone of 300 mm. The clear span of 900 mm is set for testing. Testing arrangements are shown in Fig. 17. The deflections are
Fig. 17. Experimental setup for Four point Bending test
Fig. 18. FE model of RC beam with rebars, boundary conditions and loads for Numerical Example 3
Results and Discussions: Plots of load versus mid-span de- flection from FEA and experiments and are shown in Fig. 19 for beams. The shapes of the load–deflection plots are trilinear. Immediately after the first crack formation, there is a small kink in the FEA plot, which is due to sudden loss of moment of inertia after the first crack formation. The comparison of experimental and FEA curves indicated that the experimental and FEA results are in good agreement. The values for ulti- mate load show consistency in FE and experimental results. Figure shows the nodal deformation and cracking regions
IJSER © 2014 http://www.ijser.org
International Journal of Scientific & Engineering Research, Volume 5, Issue 9, September-2014 782
ISSN 2229-5518

generated by FEA. Fig. 20 and Fig. 21show cracks at initial cracking load and ultimate load.
Fig. 19. Load Vs. mid-span Deflection for experimental study

Fig. 20. First crack at load 16.439 kN for Numerical Example 3
Finite element models of reinforced concrete beams, con- structed in ANSYS 12 using the dedicated concrete elements have accurately captured the nonlinear flexural response of these systems up to failure. The failure mechanism of a rein- forced concrete beam is modelled quite well using FEA, and the failure load predicted is very close to the failure load measured during experimental testing. The analysis procedure used in this paper and various output plots constructed by FEA have provided a deeper insight for future application of finite element software for the non-linear analysis of RC beams. Based on the analyses carried out on the RC beams using ANSYS, it is found that results are more sensitive to mesh size, materials properties, load increments, etc.
[1] E.R. Buckhouse, “External Flexural Reinforcement of Existing Rein- forced Concrete Beams Using Bolted Steel Channels”, Master of Sci- ence Thesis, Marquette University, Wisconsin, 1997.
[2] A.J. Wolanski, “Flexural Behavior of reinforced and Prestressed Con-
crete Beams Using Finite Element Analysis”, Master of Science The- sis, Marquette University, Wisconsin , 2004.
[3] D. Kachlakev, T. Miller, S. Yim, “Finite Element Modeling of Rein- forced Concrete Structures Strengthened with FRP Laminates”, Final Report SPR 316, Oregon Department of Transportation , 2001.
[4] P. Fanning, “Nonlinear Models of Reinforced and Post-tensioned
Concrete Beams”, Electronic Journal of Structural Engineering, vol. 2,
pp. 111- 119, 2001.
[5] L. Dahmani, A.Khennane, and S.Kaci, “Crack Identification in Rein-
forced Concrete Beams using ANSYS Software,” Strength of Materi- als, Vol. 42, No. 2, pp. 232–240, 2010.
[6] G. Vasudevan and S. Kothandaraman, “Modeling and simulation of
RC beams using ANSYS by APDL batch mode approach,” CiiT Int. J. Data Min. Knowledge Eng., 3, No. 11, 2011.
[7] G. Vasudevan and S. Kothandaraman, “Behaviour Prediction of RC Beams - Comparison of Experimental, FEA and Analytical Methods,” in: Proc. of the IEEE Int. Conf. on Advances in Engineering, Science, and Management, Nagapattinam, India, pp. 365–370, 2012.
[8] Vasudevan G. and S. Kothandaraman, “ Study on Non-Linear Flex-
ural Behavior of Reinforced Concrete Beams using ANSYS by Dis- crete Reinforcement Modeling”, Strength of Materials, vol. 45, no. 2, pp. 231 - 241, 2013.
[9] M.Y.H. Bangash, “Concrete and Concrete Structures: Numerical
Modeling and Applications”, Elsevier Science Publishers Ltd., Lon- don, England. 1989.
[10] J.G. MacGregor, “Reinforced Concrete Mechanics and Design”, Pren-
tice-Hall, Inc., Englewood Cliffs, NJ., 1992.
[11] K.J. Willam, and E. P. Warnke, “Constitutive Model for Triaxial Be-
haviour of Concrete,” Seminar on Concrete Structures Subjected to Triaxial Stresses, International Association of Bridge and Structural Engineering Conference, Bergamo, Italy, 174. (1974),
[12] F.A. Tavarez, “Simulation of Behaviour of Composite Grid Rein- forced Concrete Beams Using Explicit Finite Element Methods”, Mas- ter of Science Thesis, University of Wisconsin–Madison, Madison, Wisconsin, 2001.
Fig. 21. Cracks developed at ultimate load for Numerical
Example 3
IJSER © 2014 http://www.ijser.org