International Journal of Scientific & Engineering Research, Volume 4, Issue 2, February-2013
ISSN 2229-5518
Application of Lean Manufacturing to Higher
Productivity in the Apparel Industry in Bangladesh
*1Md. Mazedul Islam, 1Adnan Maroof Khan, 2Md. Monirul Islam
Abstract-For any industry cost and time related to production and quality management or wastages reductions have important impact on overall factory economy. Internal cost spent by a company and savings made by eliminating non productive works and time are important for management to keep the industry economically sound and safe. Emphasizing on it steps has been taken to investigate and apply lean manufacturing in the apparel industry. Lean Manufacturing can be considered as a business strategy which originated and developed in Japan. It tries to identify waste and eliminate it. Thus it leads to i mprovement in productivity of manufacturing and service organizations and quality of products leading to a competitive advantage over others. Bangladeshi industries, especially apparel sector have attempted to implement this, but a little research work is carried out in regarding its suitability. Our research on applicability of lean manufacturing helped the organization to visualize the different types of wastes generated in the organization and future possibilities of eliminating or reducing them. The research was administered with two leading apparel manufacturers in Bangladesh using personal interviews, secondary data and observations . The outcome of this observation reflected that an industry may gain higher productivity and profitability by proper application of lean manufacturing. The findings can be extended to similar apparel organizations in the future. A general overview over this development is given in this paper.
Keywords – Apparel industry, Costs, Lean Manufacturing, Lead time, Manufacturer, Productivity, W astages elimination.
—————————— ——————————
1 Introduction
Generally in an industry more focus is given on profit. Though there are different issues involved in cost reduction internally spent by an industry through finding wastages, preventing and correcting defective work would result in huge savings [1]. The apparel industry faced considerable changes as a result of the removal of Multi Fiber Agreement in 2005 [2]. Delivering high quality garments at low cost in shorter lead times are the major challenges faced by the apparel manufacturers. Most of the apparel manufacturers are trying to achieve these challenges successfully. In 2008, global recession badly affected almost all the apparel manufacturing industries in the world [2]. Due to that demand for the low cost garments are increased by the customers. Suppliers are forced to deliver low cost garments. Because of many high cost factors in Bangladesh, most of the companies faced difficulties in getting orders and some companies were closed down. The companies are seeking ways to minimize their cost in order to meet the competition by other low cost countries such as China, India,
————————————————
1Md. Mazedul Islam, 1Adnan Maroof Khan, 2Md. Monirul Islam
1 . Lecturer, Department of Textile Engineering, Daffodil
International University, Bangladesh.
Email: mazed@daffodilvarsity.edu.bd, maroof215@gmail.com, PH:+8801717825648, +8801671438336
2. Associate Professor and Dean, Faculty of Textile Clothing, Fashion & Business Studies, Bangladesh University of Textiles, Email: mislammgt@gmail.com
Sri Lanka, and Pakistan and to survive. In order to face this global challenge, most of the local apparel manufacturers have adopted different strategies. The recent adoption is Lean Manufacturing to achieve low cost, short lead times and improved quality. Lean Manufacturing can be defined as "A systematic approach to identify and eliminate waste through continuous improvement by flowing the product at the demand of the customer” (Introduction to Lean, 2010) [4]. Lean manufacturing helps to identify productive and non- productive activities. Productive activities focus on any activity that customer is willing to pay for. Non productive activities describe that the customer does not consider as adding value to his product (for example, waiting time, over processing, over production, defective works and reworks, inspection time, wrong motion, improper line balancing, improper transportation, sharing of working instruments, Therefore, a study was carried out on application of lean manufacturing in the sewing section of apparel industry named Opex & Sinha Textile Group[5] located at Mirpur, Dhaka, Bangladesh, and Viyellatex Group[3] located at, Gazipur, Bangladesh, to identify non productive activities so as to eliminate them for saving time, cost and improve productivity. By eliminating waste in the processes, companies can achieve a shorter lead time, lower cost, highest quality and can achieve a competitive advantage over the others.
IJSER © 2013 http://www.ijser.org
International Journal of Scientific & Engineering Research, Volume 4, Issue 2, February-2013
ISSN 2229-5518
2 Background of the Research Problem
Environmental changes, intensive international competition, unpredictable consumer demand, and market trends of variety and short product life cycles, compel the Bangladeshi textile and apparel industry to focus increasingly on the consumer as a way to meet these challenges “We are no longer a low cost producer of garments and low productive producer. The survival of industry depends on moving upmarket where the country needs to cater” said by a Professor of Bangladesh University of Bangladesh Textiles. In order to cater the upmarket, the industry needs to provide high quality garments within short lead time. In order to do this, one of the solutions is Lean Manufacturing. Since it is new to Bangladeshi apparel sector, there is not much background knowledge of how it suits in Bangladeshi context. When implementing Lean Manufacturing, companies have to use Lean tools and techniques introduced by “Toyota” motor company [10, 14]. These must be managed and used carefully in order to prevent potential failures. In this research, the author tries to investigate the applicability of Lean Manufacturing in Bangladeshi apparel sector.
3 Problem Statements
Based on the above explanation a broader research problem can be stated as: “How can Lean manufacturing be effectively applied to improve the performance of apparel industry?”
4 Objectives of the study
In answering the research problem, the study sought to accomplish the following research objectives.
To examine the present level of applying lean manufacturing in apparel manufacturing organization in Bangladesh. Besides, to identify and propose potential avenues for improving present level of lean manufacturing. Also to eliminating waste in the processes and helping the companies to achieve a shorter lead time, lower cost, highest quality and to achieve a competitive advantage.
5 Literature Review on Lean Manufacturing
5.1 What is Lean?
Lean Manufacturing can be defined as "A systematic approach to identifying and eliminating waste through continuous improvement of the product at the demand of the customer." Taiichi Ohno once said that “Lean Manufacturing is all about looking at the time line from the moment the customer gives us an order to the point when we collect the cash. And we are reducing that time line by removing the non – value added wastes” (Ohno, 1988)[6]. Lean always focuses on identifying and eliminating waste and fully utilizing the activities that add value to the final product. From the customer point of view, value is
equivalent to anything he is willing to pay for the product or service he receives. Formally value adding activities can be defined as: activities that transform materials and information into products and services the customer wants. On the other hand non-value adding activities can be defined as: activities that consume resources, but do not directly contribute to product or service. This non-value adding activities are the waste in Lean Manufacturing. Waste can be generated due to poor layout (distance), long setup times, incapable processes, poor maintenance practices, poor work methods, lack of training, large batches, ineffective production planning/scheduling, lack of workplace organization etc. By eliminating wastes in the overall process, through continuous improvements the product’s lead time can be reduced remarkably. By reducing lead time organization can obtain operational benefits (enhancement of productivity, reduction in work-in-process inventory, improvement in quality, reduction of space utilization and better work place organization) as well as administrative benefits (reduction in order processing errors, streamlining of customer service functions so that customers are no longer placed on hold, reduction of paperwork in office areas, reduction of labor turnover).
5.2 Wastes in Lean Manufacturing
The waste can be categorized into seven types which are commonly referred to as the “Seven wastes” *14]. Taiichi Ohno suggests that these account for up to 95% of all costs in non – Lean Manufacturing environments. These wastes are:
5.2.1 Overproduction – Producing more than the customer demands. There are two types of overproduction (Shingo, 1989):
1. Quantitative – making more products than needed.
2. Early – making products before needed.
Overproduction is highly costly to a manufacturing plant because it obstructs the smooth flow of materials and degrades the quality and productivity. Overproduction manufacturing is referred to as “Just in Case” whereas Lean Manufacturing is referred to as “Just in Time” (McBride, 2003). The corresponding Lean principle is to manufacture based upon a pull system, or producing products just as customers order them. Anything produced beyond customer order ties up valuable labor and material resources that might otherwise be used to respond to customer demand. Ohno considered the fundamental waste to be overproduction, since it leads to other wastes such as overstaffing, storage, and transportation costs because of excess inventory.
5.2.2 Waiting – Whenever goods are not being moving or being processed, the waste, waiting occurs. Typically more than
99% of a product’s life cycle time in traditional mass produc tion is spent in idling. This includes waiting for material, labor, information, equipment etc. Lean requires that all resources are
IJSER © 2013 http://www.ijser.org
International Journal of Scientific & Engineering Research, Volume 4, Issue 2, February-2013
ISSN 2229-5518
provided on a just-in-time (JIT) basis – not too soon, not too late by linking processes together so that one feeds directly into the next and can dramatically reduce waiting.
5.2.3 Transportation or conveyance – Moving product between processes does not add value to the product. Excessive movements and handlings can cause damages and can lead to reduction in quality. Materials should be delivered to its point of use. Lean requires the material be shipped directly from the vendor to the location in the assembly line where it will be used. This is called Point-Of-Use-Storage (POUS).
5.2.4 Over processing or incorrect processing – Taking unneeded steps to process the parts. Some of the more common examples of this are reworking, inspecting, rechecking etc. This is due to poor layout, poor tools and poor product design, causing unnecessary motion and producing defects.
5.2.5 Excess Inventory – Any type of inventory (raw material or in process or finish goods) does not add value to the product and it should be eliminated or reduced. Excess inventory uses valuable floor space and hides problems related to process in capabilities. Excess inventory results in longer lead times, obsolescence, damaged goods, transportation and storage costs, and delay.
5.2.6 Defects – Defects can be either production defects or service errors. Having a defect results a tremendous cost to organizations. In most of the organizations the total cost of defects is often a significant percentage of total manufacturing cost. Repairing of rework, replacement production and inspection means wasteful handling time, and effort.
5.2.7 Excess Motion – Any motion that employee has to perform which does not add value the product is an unnecessary or excess motion. Unnecessary motion is caused by poor workflow, poor layout, poor housekeeping, and inconsistent or undocumented work methods.
5.3 Lean Approach
Lean organizations are highly customer focused, providing the highest quality, lowest cost products in the shortest lead time possible. According to the book “Lean Thinking” by James P. Womack and Daniel Jones, the Lean approach can be summarized in five principles (Womack and Jones, 2003):
5.3.1 Specify what creates value from the customer’s perspective
- Value should be specified from the customer point of view not Productivity. Stop watch method was used to study the time required in each steps of process involved in sewing section and also initial and final time was noted. Total time required
for the process is the sum of differences between initial and
by the perspective of individual firms, functions and departments. If the customer does not pay for an activity, it is a non- value adding activity and should be eliminated.
5.3.2 Identify all the steps along the process chain – This means identifying the value stream. It can be used to identify activities where value is added to the product and those do not.
5.3.3 Make those processes flow – The value added product must flow continuously from the start to finish without interruptions, detours, backflows, waiting, scrap and stoppages.
5.3.4 Make only what is pulled by the customer – The customer should pull the product from the source as needed rather than process pushing the products onto the customer.
5.3.5 Strive for perfection – After implementing above steps the team should be continuously remove wastes as they are uncovered and pursue perfection through continuous improvement. Lean uses practically proven tools and techniques to systematically implement these Lean principles. If these are correctly applied, it will bring improvements to quality, cost and delivery of the final product. Those tools help in implementing, monitoring, and evaluating Lean efforts and its results. On the other hand if these were used without proper understanding, it can spoil Lean efforts in one’s organization
6 Materials and Methodology
6.1 Basic Research Approach
As shown in Fig. 1, a comprehensive literature review was carried out on Lean Manufacturing. Then a well reputed apparel manufacturing organization was selected to carry out the implementation study. As the first step site tour was conducted in order to get a clear idea about the existing products and the overall process of the company. Five garment styles were then selected (same garments design having color variation only) to produce 10,500 no. of garments for application of lean manufacturing by collecting the relevant data. In order to carry out this task, cross-functional teams with 9 members’ were formed. They were divided into 3 groups and were responsible for analyzing the raw material, cutting, sewing and finish goods departments’. We know different non- value added works have a great impact on productivity. Higher non –value added activities, higher standard minute value (SMV) leads to less
final time of each step involved. Both for including and excluding non productive activities, SMV for each style was calculated. Then current state of lean manufacturing has been analyzed and various improvement proposals were identified
IJSER © 2013 http://www.ijser.org
International Journal of Scientific & Engineering Research, Volume 4, Issue 2, February-2013
ISSN 2229-5518
to reduce the non-value adding waste. After that effective suggestion and recommendations were made.

The steps considered in the process are given below. Study about Lean Manufacturing
Select manufacturing organization for the Implementation study
Site tour and visual observation
Select a garment style
Develop current state lean manufacturing
Analysis of current state & proposals for future lean application
Develop future state of lean manufacturing
Fig-1 Research approach- steps by steps process


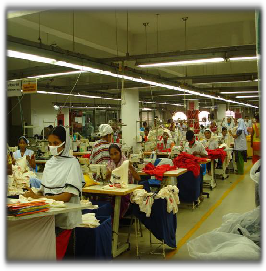
Fig.2 General Overview of the garments sewing Fig 3 Front & back view of long sleeve hoody (women’s wear)
Section of Viyellatex Group (Experimental Garments product)
A typical experimental data of operational breakdown with variable SMV output is given below.
Table 1: Experimental Garments Sewing Operational Breakdown and SMV Variation for Including & Excluding
Non Productive (NP) Activities.
IJSER © 2013 http://www.ijser.org
International Journal of Scientific & Engineering Research, Volume 4, Issue 2, February-2013
ISSN 2229-5518
GENERAL PRODUCT SPECIFICATION |
BUYER ESPRIT STYLE NO # L-94657 |
ITEM L.S. HOODY FACTORY VIYELLA TEX |
FABRIC QUALITY 1X1 RIB,100% COTTON QUANTITY 10,500 |
GSM 180 TARGET SMV 25.047 |
WASH TYPE NORMAL WASH TARGET/HR 55 PCS |
Sl. Operational Breakdown SMV including SMV No of M/c No NP Activities excluding operator No NP Activities |
1 Hood panel make + hood opening join 3.751 3.051 3 OL |
2 Hood inside herring bone tape join 3.622 2.622 2 PM |
3 Hood upper & lower tack + kacha tack 1.532 1.132 2 PM |
4 Hood hem 0.615 0.615 1 FL |
5 Front inside moon trim rib join 0.854 0.654 1 OL |
6 Inside moon top 0.558 0.415 1 FL |
7 Hole stitch + position mark 0.676 0.426 1 HS |
8 Chest cut panel +kacha 0.611 0.611 1 PM |
9 Shoulder join 1.135 0.811 2 OL |
10 Neck rib join 0.499 0.355 1 OL |
11 Care label join + hood tack 0.295 0.345 1 PM |
12 Hood join 0.656 0.558 1 OL |
13 Back neck piping 0.307 0.295 1 PM |
14 Back neck twill tape join 0.380 0.325 1 PM |
15 Back neck twill tape top+ label join 0.591 0.450 1 PM |
16 Front neck top + arm hole top 0.758 0.680 1 FL |
17 Inside moon tack with body 0.780 0.655 2 PM |
18 Chest twill tape insert tack+ end tack 0.952 0.844 2 PM |
19 Chest cut panel tack with body 0.908 0.882 1 PM |
20 Chest cut panel 0.730 0.655 1 OL |
21 Chest top 0.431 0.355 1 FL |
22 Sleeve hem open 0.655 0.465 1 FL |
23 Sleeve join 0.462 0.360 1 OL |
24 Sleeve opening tack 0.254 0.250 1 PM |
25 Side seam join 0.375 0.375 1 OL |
26 Side seam top 0.851 0.835 2 FL |
27 Sleeve ¼ tack+ side seam security tack 0.471 0.430 1 PM |
28 Bottom trim join 0.622 0.565 1 OL |
29 Bottom hem tack +trim in tack 0.722 0.610 1 PM |
30 Bottom hem 0.513 0.510 1 FL |
Total 25.047 min 21.136 min 38 |
6.2 Calculation of SAM or SMV through Time Study
Step 1: Select one operation for which you want to calculate
SAM.
Step 2: Take one stop watch. Stand by side of the operator.
IJSER © 2013 http://www.ijser.org
International Journal of Scientific & Engineering Research, Volume 4, Issue 2, February-2013
ISSN 2229-5518
Capture cycle time for that operation. (cycle time – total time taken to do all works to complete one operation, i.e. time from pick up part of first piece to next pick up of the next piece) [8,9]. Do time study for consecutive five cycles. Discard if found abnormal or non value added time in any cycle. Calculate average of the 5 cycles. Time you got from time study is called cycle time [9]. Convert this cycle time into basic time by multiplying cycle time with operator performance rating. [Basic Time = Cycle Time X performance Rating]
Step 3: Performance rating. Now you have to rate the operator at what performance level he was doing the job seeing his movement and work speed. Suppose that operator performance rating is 80%. Suppose cycle time is 0.780 minutes. Basic time = (0.780 X 80%) = 0.624 minutes
Step 4: Standard allowed minutes (SAM) = (Basic minute + Bundle allowances + machine and personal allowances). Add bundle allowances (10%) and machine and personal allowances (20%) to basic time [9]. Now you got Standard Minute value (SMV) or SAM. SAM= (0.624+0.0624 +0.1248)
=0.8112 Minute.
Similarly, for all the operation related to the above garments style standard allowed minute or SAM was calculated. The approximate value of SMV both for excluding and including non productive time are 21.136 min & 25.047 min respectively. Value added and non value added time in each steps wherever found was identified for the above process for each style and the SMV or SAM in minutes were noted. Finally the ultimate SMV variation was calculated [9, 10].
7 Findings and Discussion of the Study
Looking at the current state of manufacturing several common causes were identified: (a) large inventories, (b) the difference between the total production lead-time and the value added time (c) each process producing to its own schedule, (d) over production, (e) Excess Motion, (f) Waiting time and other non productive time were observed and recorded carefully. As the initial step a site tour was conducted with the management team and followings observations were made.
Organizational Discipline: Factory floor is reasonably clean
but it must be free of anything in operation areas. There is a scope for improvement. Some good visual control signs (e.g. hour by hour board, floor marking and line identification) are in place. Some trails for performance measurement board exist, but not working efficiently: no target, no takt time, no abnormality
management as well as no kaizen newspaper. Overall 5S is not adequate and is given a low attention. 5S program must be promoted as a pre-requisite of Lean Manufacturing implementation. Major improvements in visual management can be made in order to incorporate abnormality management helping to fix daily issues and to start process of continuous improvement.
Material flow and processing: The site’s material flow is, at places, disjointed, resulting in excess transportation, labor content and extended lead times. There are plenty of opportunities exist to create better flow, to better synchronize processes with reduction in WIP as well as lead time. There are many opportunities to improve flow and to move towards pull system. Only production department has implemented line system. Furthermore, there is no evidence of any “pacing” element in the lines to schedule delivery or processing expectations. Improvements in this area will require TOP: Take time establishment, one piece flow implementation and Pull production.
Machine utilization: No major setup time issues are observed in sewing lines. Reducing line setup time tremendously is a future challenge, to provide more flexibility to customers’ requirements. No major machine utilization issues are noted.
Quality: Rework rates are very high as compared to industry standards. Abnormality management with quick response time must be implemented first to reduce this rework level. Improvement on supplier quality level is also a dramatic concern in garment industry. Quality provided at final customer level is good but this quality is produced at very high cost.
Sewing: There is always a challenge to run “One piece flow” instead of batch with imbalanced operations. One piece flow will generate new opportunities for improvement. Current “Hour by hour chart” does not demonstrate the initiatives on abnormality management to solve day to day, hour by hour problems. Thus line management including line supervisor and production executive needs to play the role of Lean leaders and prevent abnormal from becoming normal.
Visual Management: There is no evidence of visual control and visual management throughout the whole system. Visual management has to be improved to see abnormalities easily in
both production area and warehouses. 5S is the first basic step of
IJSER © 2013 http://www.ijser.org
International Journal of Scientific & Engineering Research, Volume 4, Issue 2, February-2013
ISSN 2229-5518
making system more visual and it is below normal in warehouse areas as well as cutting and numbering. SQCD (Safety, Quality, Cost, and Delivery) boards with adequate performance measurement, abnormality management with quick response time as well as Kaizen newspapers must be in place. Quick response time to problem solving is a key success factor for employee’s motivation in Lean environment. This is a key factor to sustain result successfully and to move to the next steps.
Inventory:
RM - First, 5S is to be implemented at raw material, cutting and numbering departments. Both inventory and lead time reduction must be managed in parallel. Better control of inventory level will be achieved by introducing Pull system for repetitive parts. Poor quality and long lead time for incoming fabric is always a
huge issue for garment industry. Negotiations must be done with the suppliers of fabric in near future.
WIP- Creating better flow by implementing TOP strategy will help the organization to reduce WIP as well as manufacturing lead time. Creating one piece flow will be also very helpful in fixing some Quality issues. This will in turn reduce WIP.
FG – By reducing manufacturing lead time, it will automatically reduce unnecessary finish goods inventory. Reduction in overall inventory will generate very significant additional cash flow savings for the organization.
After Then their consequence effects on overall productivity were calculated.
Table 2 shows the total SMV taken for each garment to complete the process of operation and the same table shows SMV segregat ion of productive and non productive activities.
Table 2 Variations of SMV for non productive (NP) activities in sewing section for different styles.
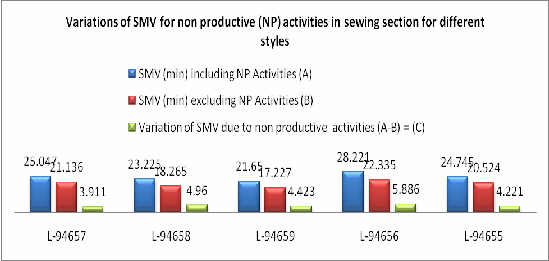
Fig. 4 Style-wise SMV variations due to productive & non productive activities
These non productive time are due to, defects and reworks,
waiting, over processing, over production, excess motion, wrong
transportation, negligence of operators, no proper identification,
zigzag movement due to improper lay out, no proper planning,
IJSER © 2013 http://www.ijser.org
International Journal of Scientific & Engineering Research, Volume 4, Issue 2, February-2013
ISSN 2229-5518
improper machine use, sharing of working instruments, absence of operators, workers’ fatigue, less experienced workers, poor machine performance, no standard operation followed by operator, Machine break down, imbalanced line (WIP control), continuous feeding to the line, quality problem, individual operator performance level, operators absenteeism, etc [11].
Table 3 shows the style-wise costs of productive and non productive activities in lean manufacturing application in sewing section. As per the factory information, the unit CM costs for each garments in sewing section was taken into consideration to calculate the overall productive and non productive activities cost in terms of SMV, CM & production rate and consequent cost savings in ultimate factory expenditure. During the experimental observation, total productive and non productive times were identified separately and costs related to each time also calculated. Finally, cost savings for non productive activities time in terms of total time (both for including and excluding non productive time) required to finish the job were calculated.
7.1 Formula for Production Estimation
Daily production = Total man minutes available in a day/SAM X Average Line efficiency
Total available man-minutes =Total no. of operators X Working
hours in a day X 60%, [9]
Suppose, SAM of the garment is 25.047 minutes, a line of 38 operators, works at 8 hours shift / day. Line works at average 60% efficiency.
So, Total available man minutes = 38 X (8 X 60) = 18240 minutes Daily estimated production = 18240 /25.047 X 60% = 437 pieces/day (For SMV 25.047 min.)
So, per hour production = 437/8 = 54 pieces/hour
Again, daily estimated production = 18240 /21.136 X 60% = 518 pieces/day (For SMV 21.136 min.)
So, per hour production = 518/8 = 65 pieces/hour
From the above calculation it is easily observed that due to SMV variation for including and excluding NP activities, variation in daily estimated production is (518-437) = 81pieces. And variation in hourly production is (65-54) = 11 pieces approximately.
Style No. | SMV (min) including NP Activities(A) | Output/ hour with NPA | SMV (min) excluding NP Activities (B) | Output/hour without NPA | Variation in SMV (A-B)= (C) | Variation in output/hour (D) |
L-94657 | 25.047 | 54 | 21.136 | 65 | 3.911 | 11 |
L-94658 | 23.225 | 59 | 18.265 | 75 | 4.960 | 16 |
L-94659 | 21.650 | 63 | 17.227 | 80 | 4.423 | 17 |
L-94656 | 28.221 | 49 | 22.335 | 62 | 5.886 | 13 |
L-94655 | 24.745 | 55 | 20.524 | 67 | 4.221 | 12 |
Total | 122.888 | 280 | 99.487 | 349 | 23.401 | 69 |
Average | 24.578 | 56 | 19.897 | 70 | 4.680 | 14 |
Table 3: Style-Wise Production Rate Variation at Variable SMV
IJSER © 2013 http://www.ijser.org
International Journal of Scientific & Engineering Research, Volume 4, Issue 2, February-2013
ISSN 2229-5518
In Viyellatex Group per day (8 hr shift) average CM cost for the above experimental style is considered as $35.5 per dozen or
$2.95 per piece. From the table 3, it is clearly observed that due to SMV variation for including and excluding non productive activities the sum of SMV is 23.401 min for which estimated production variation is 70 pieces per hour for the above five styles in five production line. The table also indicates that due to non productive activities about 4.680 min extra SMV is required on average for which equivalent production loss per hour is approximately 70 pieces. So, we can calculate the average production loss in terms of total factory economy that is the way of costs savings for the industry.
The average variation in production/hour / line is 14 pieces
The average factory earning loss / hour/line is $2.95 x 14 = $41.3
The average variation in production / day / line is 14 x 8 = 112 pieces
The average factory earning loss / day / line is $2.95x 14 x 8 =
$330.4
The average variation in production/month / line is 14 x 8 x 26 =
2912 pieces
The average factory earning loss / month / line is $2.95 x 14 x 8 x
26 = $8590.4
The average variation in production / year / line is 14 x 8 x 26 x 12
= 34944 pieces
The average factory earning loss / year / line is $2.95x 14 x 8 x 26 x 12 = $103084.8
Similarly, if this figure is considered in terms of total factory economy then a huge amount of factory earning loss could be saved easily that may have an important impact on overall factory economy. For example, from the above experimental data analysis we can estimate the earning figures for any factory as big as Viyellatex Group having 80 production lines that may save
$ 8246784/year (80 lines x $103084.8). Earning loss $ 8246784/year, what a big amount they are losing!
8 Recommended Suggestions to Apply Lean
Manufacturing in the Apparel Industry
In order to reduce the waste and improve the productivity by application of lean manufacturing [15] the following main opportunities were identified.
Waiting time: There should be minimum waiting time in fabric cutting section before bulk Production starting, should eliminate/ reduce relaxing time of fabric in the cutting department, It is better to establish an electronic indication method for mechanic support.
Transportation: Re-layout of Washing and drying processes required. Relocate panel inspection section inside the cutting department.
Excess inventory: Reduce embroidery and printing lot size,
Reduce embellishment by giving accurate figures to suppliers. Coordinate with embroidery/printing plants and reduce their inventory up to 2 days. Start one piece flow manufacturing in Sewing department. Arrange shipment weekly basic to reduce to finish good inventory. Reduce fabric inventory by having proper fabric in date.
Excess motion: Establish proper scheduling for ratio packing, Use
of folding boards & tools to reduce folding & packing time. Analyze measuring process and measure only high risk area. Style wise locate the fabric in stores.
Over-production: Cut only next day sewing requirement.
Establish a visual link between cutting and production departments.
Over Processing: Eliminate or reduce numbering processes. Eliminate repacking. Reduce 100% panel inspection. Reduce no of quality checking points by implementing self checking process by the sewing machine operators (quality at the needle point).
Defects: Reduce Fabric Inspection Time. Get testing reports from fabric suppliers. Need batch wise test reports from supplier. Get
100% shrinkage report from supplier. Supply good quality fabric
and trims to reduce inspection lead time [12]. Send a person to the fabric mill to inspect fabric before in-house. Reject & return fabric to the supplier whenever the fabric fails as per the point system. Get the confirmation of fabric width from the supplier.
Some other recommendations provided to eliminate wastages are,[12, 15] proper production planning, effective application of industrial engineering, well trained operator, proper layout plan, minimum rework, smooth running of sewing machine, proper line balancing, right time oiling to the sewing machineries, ensuring quality production, sufficient numbers of working aids
can be provided for smooth working, stickers can be used for
IJSER © 2013 http://www.ijser.org
International Journal of Scientific & Engineering Research, Volume 4, Issue 2, February-2013
ISSN 2229-5518
identification, manual counting is not required, correct shade[9 [9] Dr P Khanna: Work study, time and motion study, Dhanpat Rai
variation, length, width of the fabric should be issued by proper identification, proper allocation of manpower is necessary, books to note down production to be given as one common book is used, proper quality checking, minimum waiting time, inspection time, reduced zigzag movement etc. These recommendations were suggested to the sewing section in the apparel industry.
9 Conclusions
In Modern industries it is difficult to identify the key areas and practices, which can be used to eliminate waste in their processes. Based on the practical experiment conducted, it can be seen that lean manufacturing can be effectively applied to apparel industry as the key step of waste identification. Using this tool, it is possible to map the current status and subsequently analyze to achieve waste elimination. The case study presented in this paper, has shown that the wastes such as transport, inventory and defects, over processing, excess motion, over production etc can be reduced to a great extent which in turn improves the productivity of the organization. In order to accomplish this task, the managers of the case company have to implement approaches like 5S, one piece flow, Cellular manufacturing etc. Thus, lean manufacturing helps the organization to visualize the present level of wastes occurring in the organization and the future possibilities of reducing or eliminating them. In order to continuously reduce or eliminate waste, management of companies need to apply different Lean tools and techniques accordingly while giving adequate training to their employees. Therefore organizations of similar type can use the research outcomes as a knowledge base to identify their wastes and come up with suitable remedies. Findings of this research can be valuable to other organizations of Bangladesh, which expect to implement Lean Manufacturing in the near future.
References
[1] Feld,M.W.,(2000).Lean Manufacturing: Tools, Techniques, and how to use them. Boca Raton, London: The St. Lucie Press [2] Kumar, S. A. (2008). Production and Operations Management. Daryaganj, Delhi, India: New Age International, p. 217-220.
[3] http//www.viyellatexgroup.com
[4] Shahidul, M. I. and Syed Shazali, S. T.Dynamics of
manufacturing Productivity: Journal of Manufacturing
Technology Management Vol. 22 No. 5, 2011, p. 664-678
[5] http//www.opexgroup.com
[6] Productivity Development Team, ed. Cellular Manufacturing: (Portland, .Oregon: Productivity Press, 1999).
[7 [7] http//www.sepalgroup.com
[8 [8] Saroj Bala, Factors Influencing Costing of Woven Fabrics, The
Indian Textile Journal, June 2003
and Sons, New Delhi, (pp 21).
[10] Romm, Joseph J. Lean and Clean Management: How to
Boost Profits and Productivity by Reducing. Pollution (New
York: Kodansha International, 1994)
[11] Abdulmalek, F.A. and Rajgopal, J. (2007). Analyzing the benefits of Lean Manufacturing and Value Stream Mapping via simulation: a process sector case study, International Journal of Production Economics, Vol. 107, pp. 223-36.
[12].Introduction to Lean (n.d.). Available from:
http://www.mamtc.com/lean/intro_intro.asp (Accessed 10 May
2010)
[13] McBride, D. The 7 Manufacturing Wastes. Available from:
http://www.emsstrategies.com/dm090203article2.html (Accessed
05 May 2010)
[14] Ohno, T. (1988). Toyota Production System, Productivity
Press, New York, pp. ix
[15] Seth, D., Seth, N. and Goel, D. (2008). Application of Value Stream Mapping for minimization of wastes in the processing side of supply chain of cotton seed oil industry in Indian context, Journal of Manufacturing Technology and Management, Vol. 16
No. 4, pp. 529-50.
IJSER © 2013 http://www.ijser.org