The research paper published by IJSER journal is about Application of Instrumental Neutron Activation Analysis Technique for investigation of air Pollution in Addis Ababa University, Natural and Computational Science College, Ethiopia 1
ISSN 2229-5518
Application of Instrumental Neutron Activation Analysis Technique for investigation of air Pollution in Addis Ababa University, Natural and Computational
Science College, Ethiopia
Awoke Taddesse, A.K. Chaubey, Tilahun Tesfaye and Asres Yehunie
Abstract: Neutron Activation Analysis (NAA) using high resolution gamma-ray spectrometry was used to monitor environmental air pollution in Addis Ababa University, Natural and Computational Science College (Ethiopia) using Biomonitor Lichen. The low neutron flux from our isotope source is compensated by taking relatively long irradiation time and large mass samples. Gamma photon mass absorption correction was made for the relative large mass sample. It was identified that more than 18 air pollutant elements are accumulated in the lichen samples.
Key words: Addis Ababa University Natural and Computational Science College, Air pollution, Biomonitoring Appling
Lichens, Environmental air pollution, INAA, application of low neutron flux from isotopic neutron source
1 INTRODUCTION
Man made environmental pollution has been a hazard since the advancement of science and technology. Global industrialization and human ways of life has put an impact on environment matter of serious concern, especially today that the consequences of human intervention are already evident. Although environment is extremely valuable for people and other organisms living in it, it is also endangered due to human activities, Davis E. [1].
Air and water accept any kind of pollutants produced mainly from industries, domestic or traffic sources. Gaseous pollutants and particulate matter are emitted to the atmosphere.
The air born particulate matter and heavy metals has been recognized as the most significant pollutants of an environment.
The Natural and Computational Science College in Addis
Ababa University, Ethiopia seems to be heavily polluted due
to the gases from laboratory and chemical stores of the Chemistry department. The main cause of air pollution is the poor ventilation system of the laboratory and chemical store. The exhaust gases emitted by the ventilators, fixed nearly of human height, remain all the time in the atmosphere of the area near the store. The other sources may be traffic air pollution which is a series problem in many parts of the city.
2 ENVIRONMENTAL AIR POLLUTION AND BIOMONITOR.
All the chemicals compounds or elements that are released
into the atmosphere are primarily as a result of human activities, and which can cause damage in living organisms, are considered air pollutants, Moriarty F. [2].
The majority of the heavy metals, sulphure and nitrogen compounds that are considered pollutants originate from anthropogenic sources, Pacyna JM & Pacyna EG [3]. Sources of these compounds include forest fires, biological decomposition processes, and waste products from industries
and due to gases released from different stores. The degree
IJSER © 2012 http://www.ijser.org
The research paper published by IJSER journal is about Application of Instrumental Neutron Activation Analysis Technique for investigation of air Pollution in Addis Ababa University, Natural and Computational Science College, Ethiopia 2
ISSN 2229-5518
and extent to which emissions are spread depends on the type of emission source, composition of the emissions and the weather conditions. The majority of the emissions remain close to the source, but some can travel for thousands of kilometers. In general, sulphure and nitrogen compounds
occur in the atmosphere in gaseous form, and heavy metals are attached to particles. Air quality can be monitored by measuring the pollutants directly in the air or in deposition, by constructing models depicting the spread of pollutants, or by using biomonitor, Conti ME & Cecchetti G [4].
Direct measurements provide objective information about the level of pollutants, but they are expensive and there is a risk of contamination when determining low concentrations. The models provide information about extensive areas and they can be used to produce predictions of future air quality. However, their accuracy is dependent on the quality of the data used in constructing the models.
Biomonitors provide information on both the quantity of pollutants and their effect on the occurrence and condition of Biomonitor. Although the methods are fast and inexpensive, they only provide a relatively approximate picture of air quality and the deposition of pollutants.
The term bioindicator (biomonitor) is used to refer to an organism, or a part of it, that depicts the occurrence of pollutants on the basis of specific symptoms, reactions, morphological changes or concentrations, Puckett KJ [5].
There is considerable variation in the use of the terms bioindicator and Biomonitor, but bioindicator generally refers to all organisms that provide information on the environment or the quality of environmental changes, and Biomonitor to organisms that provide quantitative information on the quality of the environment.
Organisms can be classified according to their origin into passive Biomonitor, in which organisms that occurs naturally in the study area are monitored, and active Biomonitor, in which the organisms are brought into the research area under
controlled conditions for a specific period of time.
A good accumulation indicator of air pollutants should meet the certain requirements, Garty J [6].
It should accumulate pollutants from the air in the same way and to the same degree under different conditions. The pollutants should be easily measured and the measurements should provide information about the level of pollutant deposition.
In order to determine the state of the ecosystem in relation to the pollutant under study, the state of the ecosystem in the background area should also be known. The background level is usually considered to be the “natural” level at which emissions have as small an effect as possible.
Mosses and lichens are considered to be best for use as
Biomonitor of air pollutants, Tyler G [7].
Lichen is a symbiotic organism composed of a fungal and algae. The name of the lichen species is given by its fungal partner. The fungal partner benefits by getting sugar from the algae which is synthesized through photosynthesis. The algae partner gets protection as the fungi normally forms the outer surface. This protection is mostly against weather and radiation which helps the algae to have more stable and constant environment.
In this work the epiphytic species is used because of its high sensitivity to air pollution.
Most lichen species obtain their nutrients from wet and dry deposition, Markert BA, Breure AM & Zec [8].
They possess many properties that make them suitable for monitoring purposes. Air pollutants are deposited on lichens in aqueous solution, in gaseous form or attached to particles. The accumulation of pollutants occurs through a number of different mechanisms: as layers of particles or entrapment on the surface of the cells, incorporation into the outer walls of the cells through ion exchange processes, and metabolically controlled passage into the cells [9]. A high proportion of the pollutant load accumulates in lichens through wet deposition.
3 EXPERIMENTAL
3.1 Study and Sample Collection Area.
IJSER © 2012 http://www.ijser.org
The research paper published by IJSER journal is about Application of Instrumental Neutron Activation Analysis Technique for investigation of air Pollution in Addis Ababa University, Natural and Computational Science College, Ethiopia 3
ISSN 2229-5518
The Natural and Computational Science College of Addis Ababa University is located in the center of Addis Ababa, the capital city of Ethiopia. The area near the chemistry department’s old laboratory seems to be polluted due to the gases from laboratory and chemical stores of the department. The study area is shown by Fig 1.
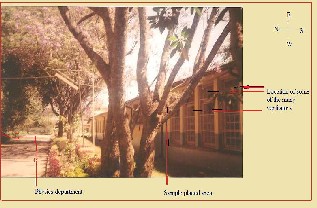
Fig 1. Study area, Addis Ababa University natural and computational Science Colleg chemistry department chemical store and laboratory area
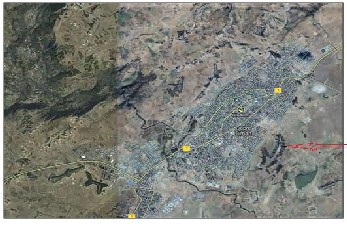
The lichen samples for the monitoring purpose were collected from background place Known as Ansas Mariam artificial forest area. It is located to the eastern side of Debre Berhan city where air pollution at this site is considered to be least amount or none. The background lichen collected area is shown by shown in Fig 2.
Fig 2. Ansas Mariam artificial forest near Debre Birhan city, where the lichen samples are collected for transplantation.
3.2 Materials and Methods
3.2.1 Instrumental Neutron Activation Analysis (INAA) Neutron Activation Analysis (NAA) is a quantitative and qualitative method for the precise determination of a number of major, minor and trace elements in different types of geological, environmental and biological samples. INAA is based on the nuclear reaction between neutrons and target nuclei of a sample material. It is a useful method for the simultaneous determination of a large number of major, minor and trace elements of in ppb-ppm range without chemical separation, Carmen Cristache, Octaviam, G.Duliu & et al [10].
One of the most important advantages of INAA is that most sample matrices appear to be transparent, because the usual constituting elements H, C, O, N, P, and Si hardly form any radioactive isotopes. This makes the method highly sensitive for measuring trace elements, because the main constituents give no signal and do not cause any interference. Because of this, it is also not necessary to do any sample preparation other than size reduction and (in some cases) drying, making the technique non-destructive. The technique also requires only small amounts of sample from milligram to few grams of sample material depending on the neutron fluxes facility.
The quantity of radioactive nuclides produced by activating the samples is determined by measuring the intensity of the characteristic gamma-ray lines in the spectra. As the irradiated samples contain radio nuclides of different half-lives different isotopes can be determined at various time intervals.
INAA can be done using standard method in which the experimental sample is compared with a standard sample (comparator). The intensity of a characteristic gamma-ray line from the elements in the sample is compared with the intensity of the gamma-ray lines from the comparator or standard [11].
The thermal neutron flux ( Φth ) is given by an equation:
IJSER © 2012 http://www.ijser.org
The research paper published by IJSER journal is about Application of Instrumental Neutron Activation Analysis Technique for investigation of air Pollution in Addis Ababa University, Natural and Computational Science College, Ethiopia 4
ISSN 2229-5518

dN
Gamma-ray self absorption by the sample mass was corrected
dt
td
th
I KmN
f 1 e T 1 e tm Ae
using the mixture gamma ray mass absorption equation.
G A
( / g)

2 g
(1)
cm i wi
i cm
(2)
Were, t m -real time measurement, T-irradiation time, t d - transporting time,
G -geometry dependent efficiency of the detector, -
thermal neutron capture
cross-section, - decay constant of product nuclei, A-the atomic weight of the
where µ= total photon mass absorption coefficient for our
mixture
wi = weight fraction of ith element in the mixture
µi = total photon mass absorption coefficient of ith element
The mean value of the gamma ray mass self absorption coefficient was used for the calculation of the actual intensity of the photon. The intensity from the full energy photo peak is
corrected using usual photon intensity mass absorption
element, m- mass of the bombarding element,
activity of the emitted

dN -the
dt
equation.
I(x)=I0exp(-µx) (3)
gamma, NA- Avogadro number, f-the isotopic abundance of the target nuclei
I -the intensity of the gamma –ray line and K is the self absorption of gamma rays in the sample. The same equation is used for both elements in the comparator and unknown elements.
3.2.2 Sources of Errors
The Errors in the measurement are a crucial issue in any experiment. The main sources of uncertainty considered in our INAA are the contribution from counting statistics.
The uncertainty contribution from neutron self-shielding during irradiation was minimized by taking the mean neutron flux falling on the sample. The mean neutron flux was obtained by taking the average flux falling on the standard in front of the sample (maximum Flux) and the flux falling on the standard at the back of the sample (minimum Flux). The counting statistics uncertainty is available from the measurement results as the square root of the measured activity after the back ground is subtracted, as it follows the
Poisson statistics [12].
Where I(x) is the intensity of the photon at thickness x and
I0 the intensity at the upper surface of the sample.
3.2.2 Sample preparation and irradiation.
The collected samples were packed in a polythene bag during transportation. The lichen samples were carefully washed with distilled water to remove soil and dust particles from their surface before their transplantation.
A 20cmx10cmx10cm wooden box was made for placing the samples. The wooden box is covered from the top by plastic materials so that contaminants from supporting trees may not reach the samples by leaching during the rainy season. At the bottom of the boxes a cylindrical shaped water tank, open along its diameter from its top, is fixed for supplying water through a cotton cloth. These samples were placed in a cloth boxes made of silk having area of 1mm2 pores on one side and cotton clothes on the other side.
The pores are used as an inlet for air into the lichen samples and the cotton cloth is used for water transportation into the sample from the water tank.
Two lichen sample boxes were placed in a single wooden box. The wooden box was placed on a tree 2m tall at nearly 3m distance from the store by the side of the road to physics department. The samples were exposed to air for two months
IJSER © 2012 http://www.ijser.org
The research paper published by IJSER journal is about Application of Instrumental Neutron Activation Analysis Technique for investigation of air Pollution in Addis Ababa University, Natural and Computational Science College, Ethiopia 5
ISSN 2229-5518
from 7th, June, 2011 to 6th, August, 2011. One sample was collected at the end of each month.
The lichen samples were oven dried at 800c for 10 h to remove
any moisture content.
The samples were powdered using agate pestle and mortar. The samples were weighted by a sensitive digital Sartorius
standard balance whose sensitivity is 0.0001 g. Sample masses
collected and stored by a computer-based MCA with 4k conversion gain.
The 152Eu gamma source with known activity was used to
calibrate the spectrometer and photo peak detection efficiency of the detector.
The absolute detector efficiencies (ε) were calculated by using
the following expression:
used were in the range of 1-2g. Disk shaped polyethene sample holders having larger cross section were used. They were sealed by a thin tape.
t. P
n

E . N
. t d
0
(4)
The irradiation and counting of samples was done keeping fixed geometry, so that geometry factor gets cancelled while taking the ratio of activity of comparator and unknown sample.
The thermal neutron cross section and isotopic abundance values of the sought elements are taken from data compiled by S.F. Mughabaghab [13] and the gamma emission probability from table of isotopes by Richard B. Firestone [14].
The irradiation facility in our laboratory consists of 2 Ci cylindrical Am-Be source.
The KI standards were also sealed in the same geometry sample holder to be irradiated at the same time with the sample. Two KI standards having equal mass were prepared. The sealed sample was again sealed in between the two standards. The Sample, together with the standards, was irradiated for 3 weeks in Am-Be neutron source for medium and long-lived activation products.
3.2.3 Gamma ray acquisition.
The HPGe detector and gamma spectrometer Canberra System was used. The resolution and relative efficiency of the detector for 1332 keV (Co-60) was determined to be 2 keV and 50 %, respectively.
The detector and preamplifier are placed inside a low- background lead shield and cooled by liquid nitrogen from vertical dipstick cryostat.
The integrated signal processor (model 1510) consists of a
pulse height analysis system to transform pulses, which are
where n is the net area under the full-energy peak of gamma-
ray energy E, t the counting time, Pγ (E) gamma-ray emission probability at energy E, No the activity of the source (Becquerel), λ the decay constant = ln 2/T1/2, T1/2 the half-life of radio nuclide and td the decay time.
The irradiated samples, and comparator standard were counted in identical geometry with respect to the detector. Measurement times were 200–3600 s for short as well as medium-lived activation products and 1–2 h for medium and long lived products. The measurement of the radioactivity of first group isotopes was made within 4 min cooling time after the end of irradiation. On the other hand, for second and third groups of elements, measurements began after 14 hours cooling time.
4 RESULTS AND DISCUSSION
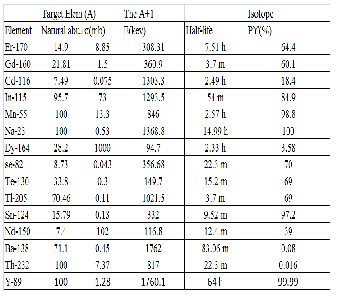
The natural abundance and thermal neutron capture cross section for the parent element and the half life, main gamma energy and absolute gamma ray intensity for the A+1 isotopes analyzed is shown in Table 1.
Table 1
The natural abundance and thermal neutron capture cross section of the parent element and the half life, main gamma energy and absolute gamma ray intensity for the A+1 isotope.
IJSER © 2012 http://www.ijser.org
The research paper published by IJSER journal is about Application of Instrumental Neutron Activation Analysis Technique for investigation of air Pollution in Addis Ababa University, Natural and Computational Science College, Ethiopia 6
ISSN 2229-5518
Some natural radioactive elements were found to be deposited in the lichen samples.
Activity concentrations of the natural radioactive elements found deposited in the lichen samples, 231Th, 212Pb ,235Uand
40K were converted into elemental concentrations of thorium,
uranium and potassium according to the expression [15]:
µgg-1(equivalent to ppm).
Results of elemental concentrations in the lichen samples are given in Table 2.
Table 2
Concentration of elements per two months and per month accumulated in the lichen sample.
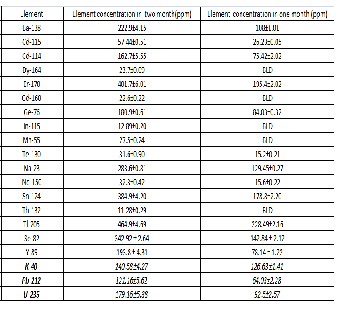
Key: BLD-Below Detection Limit
M E .K
(5)
The eight most significant trace element depositions found in
F E .
E
A . f
AE
A, E
the lichen samples greater than 200 ppm concentration per two months were elements Tl, Er, Sn, Se, Na, K, Ba, Cd and Y
with a concentration of 464.9 ppm,401.7 ppm,384.9 ppm,
A Ci
(6)
342.9 ppm, 283.6 ppm, 240.48 ppm, 222.9 ppm, 220.1 ppm
Y i . i
. M x
and 193.8ppm per two months respectively.
where FΕ is the fraction (concentration) of element E in the sample, ΜΕ, λE, fA,E and AE are the atomic mass (kg mol-1), the decay constant (s-1), the fractional atomic abundance in nature and the measured activity concentration (Bq kg-1), respectively, of the corresponding radionuclide considered (232Th, 212Pb, or 40K).
ΝΑ is the Avogadro’s number (6.023X10²³ atoms mol-1), Ci the activity(Bq) of the isotope E, Yi the gamma yield, ɛi the detector efficiency, Mx the dry mass of the sample analyzed and K is a constant with a value of 1,000,000. Hence,
elemental concentrations are reported in units of
Other significant trace elements detected with higher average deposition concentrations but lower than 200 ppm were Ge, U and Pb .The study showed that the deposition of elements in the lichen samples increases nearly linearly with time. For most of the elements, the deposition found at the end of the second month is nearly twice that found in the first month. Other trace elements detected with average concentrations lower than 100 ppm and greater than 20 ppm were Nd, Te, Mn, Dy and Gd. The study showed that the deposition of elements in the lichen samples increases nearly linearly with
IJSER © 2012 http://www.ijser.org
The research paper published by IJSER journal is about Application of Instrumental Neutron Activation Analysis Technique for investigation of air Pollution in Addis Ababa University, Natural and Computational Science College, Ethiopia 7
ISSN 2229-5518
time. For most of the elements, the deposition found at the end of the second month is nearly twice that found in the first month. The exception to this is for elements Dy, Gd, In, Mn and Th where they are below the detection limit in the sample exposed for first month.
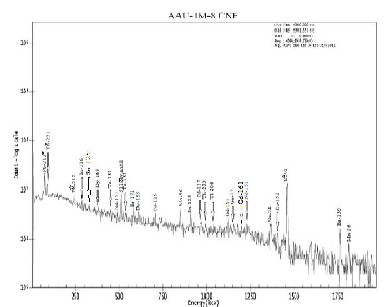
Fig 3. Spectrum collected for a live time of 3600 S
after a decay time of 3h.
The health effects of the three elements obtained from the study is briefly discussed.
Cadmium(Cd) is an element found with a high average value
220.1 ppm in the lichen sample exposed for two months, which is large amount related to its toxicity nature. Certain compounds of cadmium (Cd) are highly toxic to humans. Cadmium is readily taken up by plants. Potential source of cadmium toxicity is the use of commercial sludge for fertilizing in agricultural fields. Some root crops like carrots and some leafy crops like lettuce are able to accumulate more cadmium compared to other plant foods. Grain crops like rice and wheat can accumulate relatively high amounts of cadmium.
The dietary cadmium absorption rate in humans has been estimated at 5 % of its total intake. Cadmium is a normal
constituent of tobacco. The cadmium content in tobacco
ranges between 1-2 ppm dry weights. Approximately 10 % of the inhaled cadmium oxide is deposited in lung tissues, and another 30-40 % is absorbed into systemic blood circulation in smokers. Smokers have 4-5 times higher cadmium levels in blood [16].
Cadmium is a cumulative toxicant and carcinogenic that affects kidneys, generates various toxic effects in the body, disturbs bone metabolism and deforms reproductive tract as well as endocrine system. Increasing intakes of zinc can reduce the renal toxicity of cadmium. An exposure to cadmium increases calcium excretion thus causes skeletal demineralization, probably leading to increases in bone fragility and risk of fractures [17].
Lead(Pb) is the other isotope found deposited in the lichen samples. It is considered as hazardous air pollutant. It is also considered to be toxic. Lead occurs naturally in the environment. However, most lead concentration that is found in the environment is a result of human activities like the application of lead in the gasoline. In car engine lead is burned so that lead oxides and salts will originate. These lead salts enter the environment through the exhaust of the car. Not only lead gasoline causes to raise lead concentration in the environment but also human activities like fuel combustion, industrial processes and solid waste combustion contribute to the lead pollution.
Lead is one of the metals that have the most damaging effects on human health. It can enter human body through uptake of food, air and water. Food such as fruits, vegetables, grains, sea foods soft drinks and wine may contains significant amount of lead. Cigarette smokes also contain small amounts of lead. Lead can cause several unwanted effects like disruption of biosynthesis of hemoglobin and anemia, a rise in blood pressure, kidney damage, and brain damage.
Tin(Sn) is the other element found deposited in the lichen sample. Tin is applied in various organic substances. The organic Tin bonds are the most dangerous forms of Tin for human health. Despite the dangers they are applied in a
IJSER © 2012 http://www.ijser.org
The research paper published by IJSER journal is about Application of Instrumental Neutron Activation Analysis Technique for investigation of air Pollution in Addis Ababa University, Natural and Computational Science College, Ethiopia 8
ISSN 2229-5518
number of industries such as plastic industries, paint industries, and in pesticides.
Humans can absorb tin bonds through food, breathing and through their skin. The uptake of tin has shot and long term effects on humans. The short term effects are eye and skin irritation, headaches, stomachaches, severe sweating and urination problems. The long term effects are depression, liver damage, chromosal damage, brain damage and shortage of red blood cells.
CONCLUSION
In the present study we found the concentrations of U, Tl ,Er, Sn, Na ,Ba and Cd as the major pollutant of the area near the chemistry department laboratory and chemical store. Undoubtedly these elements should come from the busy ventilators which expel gasses from the store. Although Eu is found in large amount, its health effect is not known and may not be considered as air pollutant of the area.
The other pollutants Nd, Te, Mn, Dy and Gd are also determined with relatively high concentration but may not be considered as serious pollutants of the area.
Around this polluted area there are the physics and earth science departments in which instructors and workers have been working for several years, class rooms and other
different offices. In addition it is a usual experience that in front of the laboratory many students are accustomed to eat their lunch. Many people are also using the road near by the emission source frequently. Lastly we recommend that the chemical store and the lab has to be shifted to somewhere where far from the departments and classes.
ACKNOWLEDGMENTS
The authors would like to thank the Physics head Department Dr. Lemi Demiyu for his consistent help in getting the liquid nitrogen which was used to cool our detector and his interest in our progress.
REFERENCES
[1]. E. Davis, (2006). Trends in Environmental Research. New York USA: Nova Science publishers, Inc.
[2]. F. Moriarty (1999), Ecotoxicology - the study of pollutants in ecosystems.
3rd edition. Academic Press, San Diego, 347 p.
[3]. JM Pacyna & EG Pacyna (2001) An assessment of global and regional Emissions of trace metals to the atmosphere from anthropogenic sources worldwide. Environmental Reviews 9: 269-298.
[4]. ME Conti & G Cecchetti (2001) Biological monitoring: lichens as bioindicator of air Pollution assessment – a review.
Environmental Pollution 114: 471-492.
[5]. KJ Puckett (1988) Bryophytes and lichens as monitors of metal deposition. Nash TH III &Wirth V (eds) Lichens, bryophytes and air quality. J. Cramer, Berlin, Stuttgart. Bibliotheca Lichenological 30:
321- 267.
[6]. J. Garty (1993) Lichens as Biomonitors for Heavy Metal Pollution. In: Markert B (ed) Plants as Biomonitors. Indicators for Heavy Metals in the Terrestrial Environment. VCH, Weinheim, p 193-263.
[7]. G. Tyler (1990) Bryophytes and heavy metals: a literature review.
Botanical Journal of the Linnean Society 104: 231-253.
[8]. BA Markert, AM Breure & Zec for Bioindicator/Biomonitoring of the environment. In: Markert BA, Breur AM & Zechmeister HG (eds) Bioindicators and biomonitors. Elsevier, Oxford, p 3-39.
[9]. B .Markert, J. Oehlmann & M. Roth (1997) General aspects of heavy metal monitoring by plants and animals. In: Subramanian KS & Iyengar GV (eds) Environmental Biomonitoring - exposure, assessment and specimen banking. ACS Symposium series 654. American Chemical Society, p19-29.
[10]. Carmen Cristache, Octaviam and G.Duliu. Determination of
IJSER © 2012 http://www.ijser.org
The research paper published by IJSER journal is about Application of Instrumental Neutron Activation Analysis Technique for investigation of air Pollution in Addis Ababa University, Natural and Computational Science College, Ethiopia 9
ISSN 2229-5518
Elemental Content in geological samples. National Institute for Nuclear
Physics and Engineering, Bucharest, Rumania,2007.
[11]. Kwangwon Park and Joung Hae Lee . Determination of Toxic Elements in Polymer Materials Using Instrumental Neutron Activation Analysis, Division of Metrology for Quality Life, Korea Research Institute of Standards and Science, Yuseong-Gu, Daejeon 305-340, Korea,2008
[12]. S. Krane. Introductory Nuclear Physics, Jone Willey & Sons,1987
P. 218-220.
[13]. S.F. Mughabaghab IAEA, Thermal Neutron Capture Cross section, resonance Integrals and G- factors. Brookhaven National laboratory, Upton, NY 11973- 5000, USA,2003
[14]. B. Richard Firestone, Table of Isotopes 8-th edition Berkley, California
CD- ROM,1999.
[15]. Tzortzis and Haralabos Tsertos, Determination of thorium, uranium, and potassium elemental concentrations in surface soils in Cyprus Michalis Department of Physics, University of Cyprus, P.O. Box 20537, 1678
Nicosia, yprus. (Revised version: 8/03/2004)
[16]. J. Tallkvist, Bowlus CL, B. Lonnerdal DMT1 gene expression and cadmium absorption in human absorptive entrecotes.
Toxicol Lett 2001; 122: 171-7.
[17]. X .Wu, T. Jin, Z. Wang, T. Ye, Q. Kong, G. Nordberg Urinary calcium as a biomarker of Renal dysfunction in a general population exposed
to cadmium. J Occup Environ Med 2001; 43: 898-904.
IJSER © 2012 http://www.ijser.org