International Journal of Scientific & Engineering Research, Volume 2, Issue 11, November-2011 1
ISSN 2229-5518
Application of Frictional Modeling In Simulation and Optimization of The Design And Performance Of A Cereal Thresher
Engr. C.O. Osueke (Ph.D)
Abstract - To achieve a productive model, the operation processes need to be modeled, the model have to be properly packaged and the results thereafter should be compared and verified with other conventional models to prove validity. This forms the structure of the cereal thresher model developed. To achieve this, the processes were modeled mathematically using the various thresher and crop parameters (velocity of cylinder, crop feed rate, concave clearance, crop flow rate etc) and in-cooperating the frictional factor. After which the sub- models that characterizes performance was hence developed. The model was packaged using computer aided software based on VISUAL BASIC programming language. Using the model, the performance of the thresher was simulated and hence optimized based on minimum threshing loss. At 15% moisture level, the minimal loss is 11.78%, capacity is 211.52 kg/h and unthreshed grain flow rate of 0.021 kg/s while other performance characteristics are 18m/s, 0.18kg/s, 0.02m. On validation with published data of past researchers, the
model was found generally to fit well, taking R2 values which is highly significant at 0.001.
Index terms - : Simulated, Optimized, Model, Frictional, Performance, Developed, Design
—————————— ——————————
1 INTRODUCTION
he world rate of consumption of grain is becoming a challenge to cereal processors and farmers. Worryingly,
the mean annual increase of world grain production after 1990
is lower than the mean annual increase in world grain
consumption [6]. This means that after 1990, the world is consuming grains at a faster rate than it is produced [6]. This shows that the world population has a major dependency on cereal for survival, which calls for day to day improvement on the threshing process of cereals to meet the ever growing need of consumers. Although limited success lies with the manual method of threshing, it has failed to meet up with this growing demand and is labour intensive leading to a high operating cost [22]. This leaves researchers with the mechanical option for further improvement. The mechanical process is a repeated process of pounding and dragging of the plant (panicle) over a surface or through an aperture. In as much as the mechanical option gives better results, a perfect design would yield much better results/yield. To obtain an improved yield, simulation and optimization package has been attached to threshing process which selects the best machine and crop parameter from a range of combinations to produce better threshing results. Today simulation and optimization are important domains which attract many researchers from several fields and disciplines [21]. Various researchers attained success by proper adjustment of the operating conditions of the threshers and crop parameters.
Vas and Harison 1962 [24] studied the effect of selected mechanical parameters on kernel damage and threshability of wheat. The reported that within the limitations of variety of bulk density, the mechanical parameters causing significant variation in threshability are cylinder speed, concave clearance and feed rate. Chabara 1975 [5] developed and tested an axial
flow thresher on the basis of drawings procured from IRRI (International Rice Research Institute). He found that it could
thresh paddy and wheat quite effectively. He reported that at
500r.p.m, the threshing efficiency was 100% and the feed rate was 710kg/h which resulted to an output of 213kg/hour clean grain. For wheat threshing at 700rpm and 63.5mm peg spacing, threshing efficiency, external damage and separation losses were 99.63, 0.47% and 2.4% respectively. A feed rate of
96kg/h gave 340kg/h clean grain. Ramos (1987) [20] investigated power requirement for threshing rice using locally manufactured axial flow thresher. He studied the effect of feed rate and moisture content on power requirement. He reported that at a feed rate of 1000kg/h, the power requirement is 3.69hp and 18.24hp at a feed rate of 6000kg/h. the increase in power requirement was proposed to be due to an increase in the amount of straw being threshed and crushed per time. He also reported that at a moisture content of 15% and 6000kg/h feed rate, he power requirement is
8.16hp and for 27% moisture content, 20.54hp is required all
for bundled straw. For unbundled straw, he reported that at same feed rate of 6000kg/h and moisture content the power requirement is 5.75hp. also for 16.5% increase in moisture content, the power increased by 0.932 at 6000kg/h feed rate. Dash and Das (1989) [7] developed and evaluated a power operated paddy thresher to study the effect of the peripheral speed and moisture content on thresher capacity and efficiency. They reported that threshing efficiency mostly varied within the range of 94.67 to 98.50% at a peripheral speed of 989.6m/min to 537.2m/min respectively and moisture content of 22%. Then at low moisture content of
13.0%, it was also reported that the capacity increased from
IJSER © 2011 http://www.ijser.org
International Journal of Scientific & Engineering Research, Volume 2, Issue 11, November-2011 2
ISSN 2229-5518
153.07kg/h to 193.28kg/h when the peripheral velocity was varied from 537.2m/min to 989.6m/min. Also they reported that at 16.5% moisture content, the capacity of the thresher ranged from 162kg/h to 193.13kg/h whereas at 13.6% moisture content, it was 159.15kg/h to 183.29kg/h. This shows that a higher capacity can be achieved by threshing the paddy crop at 16.5% moisture content. Behera et al (1990) [1] developed and tested a power operated wheat thresher. They reported that maximum threshing efficiency of 95.3% was obtained at peripheral speed of 102.7m/min (500rpm) at a moisture content of 9.25% and concave clearance of 1.3cm. The minimum threshing efficiency of 87.1% was observed at a peripheral speed of 904.02 m/min. (440 rpm) at moisture content of 14.5% and concave clearance of 1.95cm. They also reported that the capacity was maximum at a peripheral speed of 1030.03m/min (550 rpm), while the concave clearance and moisture content were 1.3cm and 9.25% respectively. The range of capacity was 94.63 kg/h to 115kg/h when the peripheral speed varied from 904.02m/min to 1025m/min. Desta and Mishra [8] developed and conducted performance evaluation of a sorghum. They combined feed rate at three levels (6,8, and 10Kg/min), cylinder-concave clearance at two levels (7 and 11mm) and cylinder speed at three levels (300rpm (17.5m/s), 400rpm (10.1m/s), and 500rpm (12.6m/s)). The result of the performance analysis showed that threshing efficiency increased with an increase in cylinder speed for all feed rates and cylinder concave clearances. The threshing efficiency was found in the range of 98.3% to 99.9%. At the recommended speed of 400 rpm (10.1m/s), the power required for operating the thresher was 4.95KW and the maximum output of the thresher was 162.7Kg/hr.
The friction which occurs within the crop stream and between the beater and crop surface also has a role to play in designing a cereal thresher. The researchers as mentioned above neglected this issue except for Vas and Harrison [24]. According to the frictional model developed by them, an increased rubbing action due to an increase in feed rate to an extent increased threshability. The fact remains that the field application of the various models as mentioned above would not give the same result as proposed. That is to say that much still needs to be done in improving on these models which calls for a proper look into frictional modeling.
This work is meant to develop a model for cereal threshing which in-cooperates frictional considerations with the aid of simulation techniques and hence optimization using computer aided software. To achieve the aim of producing a thresher model that has the proficiency and capacity to meet up with this growing need of cereal consumers, the following objectives were carried out:
Including the friction factor in combination with various machine and crop parameters to produce a robust model.
Varying these parameters at different levels and performing simulations with the use of a computer aided software.
Developing an optimal model based on least threshing loss, unthreshed grain, highest thresher
capacity, and efficiency.
2 MODEL STRUCTURE
To better understand a physical system, the modeling is done in such a way that the layouts are properly established and defined.
A modular structure is adopted for the computer aided software whereby the ―main supervisor‖ is the only main program while others exist as modules and each act as a standalone system. The main advantage of this structure is that is allows each module to be executed independent of others. Since only this module needs to be loaded into the computer random access memory (RAM), the working core requirement of the package is drastically reduced. As shown in figure I, the general structure consists of
Main Supervisor: the overall driving module to which control ultimately returns. It enables the user to access the other modules in the package.
EVTP: Evaluates the thresher performance
SIMOPT: Simulates and optimizes thresher performance
OUTPUT: Displays the result of different combination
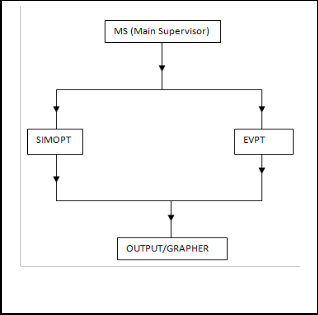
of design parameters, also the optimum machine machine parameters and their corresponding performance data.
Fig 1 Modular structure of the software
IJSER © 2011 http://www.ijser.org
International Journal of Scientific & Engineering Research, Volume 2, Issue 11, November-2011 3
ISSN 2229-5518
The discrete models thus developed are the threshing efficiency model, threshing loss model, unthreshed grain model & capacity model.
3 MODEL DEVELOPMENT
The frictional model is found based on mathematical principles and elucidations of past researchers. Sub-models were erected to further describe the performance of this model. The ideal threshing unit (processor) is one that produces the natural shape and quality of the grain and minimizes grain loss (Miu 1995 [15]; Miu and Kutsbach 2000 [17]).
4 MATHEMATICAL MODELLING OF PROCESSES
There are two major processes that occur within the threshing chamber of a cereal thresher. They are the threshing and separation processes. The mathematical model of these processes is tantamount to the success achieved by the thresher.Before establishing the threshing process model, the frictional model needs to be introduced since it constitutes threshing.
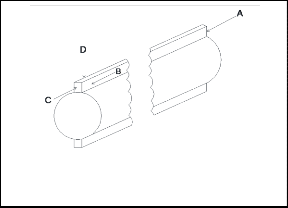
If the threshing cylinder precisely the beater is considered for frictional impact analysis, the detachment of a grain from the panicle takes place at three surfaces (A,C, and D) by frictional impact as shown below (figure 2)
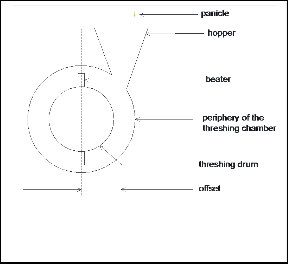
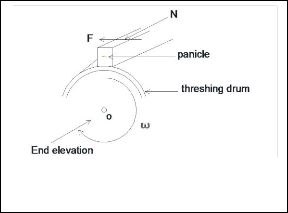
In figure 3, the threshing cylinder rotates about two frictionless points (bearings) and one of these points is labeled O when viewed from the end elevation.
The threshing drum is designed in such a way that panicles are introduced through the hopper into the threshing drum at an offset from the line of center of the threshing drum and falls by gravity as shown in figure 4.
Fig 4 The diagram shows the offset positioning of the hopper on the threshing drum.
Analyzing the threshing process for frictionless impact and considering the normal frictional force at the instant where the panicle is hit by the beater at location point (a,b) which is relative to location point O as shown in figure 5 below.
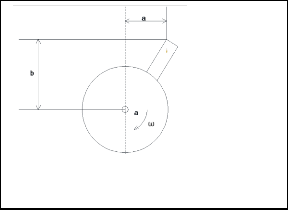
Fig 2 Threshing drum showing the surfaces A,B,C,D
Direct impact occurs at surface B only while frictional impact takes place at the rest surfaces.
Fig 5 Beater with location points a and b
Let be the initial angular velocity of the beater just befor the impact, be the angular velocity immediately after frictional impact and the time taken for impact.
By the impulsive principle,
(1)
Fig 3 Threshing cylinder showing frictionless point O, panicle, normal reaction N, frictional force F and angular velocity of the beater .
IJSER © 2011 http://www.ijser.org
International Journal of Scientific & Engineering Research, Volume 2, Issue 11, November-2011 4
ISSN 2229-5518


Where The beaters moment of inertia about O, and are the normal and frictional force acting on the beater just
(10)
before the point of contact with the rough surface of the panicle.
Following Keller (1986) [14], the unknown time variation of the normal force can be eliminated from the analysis by introducing a monotonically increasing impulse parameter Ƭ,
That is (2) Onward further simplification,

(3)
Assuming that during the impact the tangential component of the reactive force is related to the normal component by the Amontons – Coulomb law of sliding friction, and ignoring the tangential compliance of the colliding bodies, we can write

Ƭ Ƭ (4) Where is the coefficient of kinetic friction between the
panicle and beater surface.
Substituting equation 4 into equation 3, upon integration gives:

Ƭ Ƭ (5)
Introducing the horizontal and vertical velocity components of the contact point during the impact, and ,
equation 10 can be rewritten as:
(11) For the panicle to rebound, of the beater and beater of
the panicle (which is equal or greater than ) have to be of
opposite sign.
Where is the velocity of the panicle after impact with the beater.
The kinetic energy dissipated by the frictional impact is given by

(12) This energy can be cast in the form of the generalized
Thompson – Tait formula [3],[23] i.e,


(13) Indeed from equation 11, one can write

2 so that,
The normal impulse is determined from equation 1 as
(6)

Since and
(14)
In order that in the interval , the coefficient of kinetic friction must be bounded by . if the panicle sticks to the beater after impact. The angular velocity expression can be rewritten in a bilinear form as:


(7) Since is still an unknown quantity in the analysis, we
introduce the coefficient of normal restitution in order to
proceed. By poisson definition, it becomes the ratio of the normal impulses corresponding to restitution and compression phases of the impact, i.e.,

(8) The angular velocity of the beater when the panicle rebound is
related to the incidence angular velocity by

(9) Rewriting the angular velocity during the restitution phase of
the impact in the form of equation 7,

Having established the frictional impact mathematical model,
a proper threshing process model can now be generated.
5 MATHEMATICAL MODELLING OF THE THRESHING PROCESS
The first stage of threshing is that of impact which detaches the grain from straw mat binding (Ndirika 1994 [18]). In order to model the threshing process, it is important to first consider energy transferred to the panicle from the beater. To initiate the analysis, the following assumptions are considered as listed below.
A panicle suffers one impact by beater within the threshing chamber
A panicle travels at same velocity as beater or greater
after impact
The initial velocity of panicle before impact is much
smaller than that of the beater
Mass flow rate of panicle (feed rate) = Q kg/s

Hence in modeling, the rise in kinetic energy of panicle with each impact per unit mass of panicle is equal to , then the
rate of transfer of kinetic energy to the panicle by the beater
IJSER © 2011 http://www.ijser.org
International Journal of Scientific & Engineering Research, Volume 2, Issue 11, November-2011 5
ISSN 2229-5518

(15)
by:
(21)
and energy to dislodge grain from panicle becomes
From these assumptions, rate of detachment of grains becomes,

(16)
Where, drum diameter; concave clearance; bulk density of crop; peripheral velocity of rasp bar; width of thresher; mass feed rate of crop; threshing factor. Gregory [9] Stated that rate of threshing decreases as the probability of hitting unthreshed grain decreases.The mathematical expression is given by:
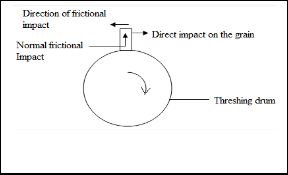
In the analysis of the model, the energy is balanced along the X axis. This implies that the total energy balance along X axis is a summation of energy as a result of direct impact (figure 6)
Figure 6 directions of impact on the threshing drum.
(17)


(22)
Where, unthreshed grain mass; number of impacts; energy needed per area of impact to detach a unit mass of grain; number of bars; threshed grain mass; = minimum energy to cause damage.
Both models did not include moisture content in their crop
characteristic which led to modification, but huynh's model
was adopted for further analysis since it contains required crop characteristics.
The specific energy as a result of direct impact needed for threshing can be considered to be directly proportional to a function of velocity ( , concave clearance ( , bulk density ( ) and feed rate ( i.e,
(23) Using Rayleigh‘s indicial method of dimensional analysis and
further simplification, becomes:
Where is presented in equation 14 as:
(18)

(24)
Conversion of specific energy to energy, equation 24 becomes:


If the initial angular velocity before impact remains the same after impact, then, .
(25)
Therefore equation 18 becomes,
Substituting equation 25 and 20 into equation 17, becomes:

(19)
Since the collision between the grain and the threshing drum is an elastic impact collision, then and .
Substituting these, equation 19 becomes,


(26)
Substituting equation 26 for in equation 16, the mean threshing rate becomes,

(20) Where cylinder width.
The next step now becomes the introduction of the direct
impact model.
Huynh et al [10] stated that the rate of detachment of grains from their bindings is proportional to both the specific energy input to the crop and transmissibility of the energy across the length of the crop mat. The mathematical expression is given


where (27)

6 MATHEMATICAL MODELING OF THE SEPARATION PROCESS
The separation process model is proposed to define
1. The migration of grain from the straw mat
2. The passage of grain through the concave openings
IJSER © 2011 http://www.ijser.org
International Journal of Scientific & Engineering Research, Volume 2, Issue 11, November-2011 6
ISSN 2229-5518
Taking the migration of grain from the straw mat into consideration, the diagram below is used to describe this process.
Fig 7: Migration of grain from straw mat
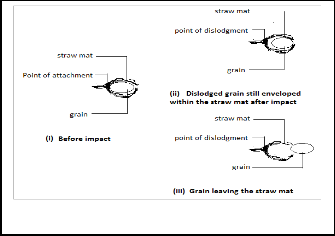
Before impact (figure 7i), unthreshed grains (panicle) flow within the threshing chamber and after impact, the grains are dislodged from the straw mat (figure 7ii). These dislodged grains which are enveloped by the straw mat are subjected to gravity and centrifugal force within the threshing chamber. These forces provide enough momentum to overcome straw mat resistance, thus leading to their downward migration (figure 7iii) towards the concave.
The mean rate of migration for a grain through straw mat length is thus proposed to be


(28)


Where length of straw mat, acceleration due to gravity, constant of proportionality.
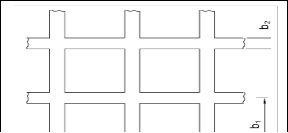
The second which is the passage of grain through the concave opening is possible only if the projection of the grain on the concave surface is within the hole of the concave surface or its failure to pass through the opening only occurs if the grain cannot find the opening within the allowed time in the system.
The probability that grains will reach this separation surface is the same over the separation length as is the probability of free grain passage through the openings of separation surface (Huynh et al., 1982 [10]; Mailander, 1984 [13]; Miu, 1994,
1995[14,15]]; Miu et al., 1997[16]; Kutzbach and Quick, 1999
[12]).
The mean rate of grain separation through the concave opening is given by:

(29)
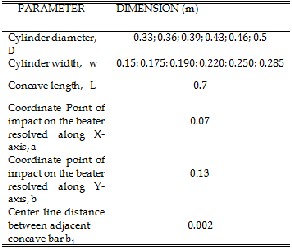
Where centre line distance between rods (mm); rod diameter (mm); center line distance between bar (mm); width of a bar (mm); equivalent diameter of a grain
(mm); ( and are dependent on crop size characteristic)
After these processes were modeled, the various sub-models that form the structure of the main performance model were then established.
6.1 Threshing Efficiency Sub-Model
The threshing efficiency parameter depends on the mean rate of threshing ) and dwell time of panicle within the threshing area.
Considering the dwell time as a function of the concave length, cylinder width, flow rate, bulk density and centerline distance between bars,
To describe the motion, the probability of passage for the
grain and time taken for the grain to pass through a given hole
would be determined and hence the rate of passage of gain
(De Simone et al., (2000) [4]) (30)
through the concave opening would be determined.
The threshing efficiency parameter is given by
According to the screening theory (Wessel, 1967 [25]; Huynh et al, 1982 [10]) It is assumed that a force kernel will pass through an opening of the concave (or cage) if the projection of the kernel on the opening surface is within that area.
Where threshing efficiency.
Substituting equation 27 and 30 into equation 31,
(31)
IJSER © 2011 http://www.ijser.org
International Journal of Scientific & Engineering Research, Volume 2, Issue 11, November-2011 7
ISSN 2229-5518


(32) The moisture content parameter is still found missing in this model and this does not reveal the actual picture of a threshing model. Brown [4], Nura and Pederson [19] reported that density or bulk density of cereals decreases with an increase in grain moisture for only moisture content range of
10-25%. The reason being that at moisture content above 25%
, the starch molecules become saturated and at moisture
content below 10% ( , the starch molecules were dry and inter-molecular spaces are almost contracted and grain approached true density of bone dry material. Since most threshing is done within this moisture content range, the following relationship between bulk density and moisture content was being proposed;

(33) Where moisture content of crop and bulk density of
crop.
Substituting equation 33 for in equation 32, the threshing sub-model becomes,


(34)
1. 6.2 Threshing Loss Sub-Model
The threshing loss sub-model is given by
(35)
3. 6.3 Capacity Sub-Model
The thresher capacity is the amount of threshed grain per unit time separated through the concave openings. It is rated in kg/h.
Theoretically, it depends on the efficiency, flow rate and grain straw ratio.
(39) Thus equations 34, 36, 38 and 39 can be used to predict the
performance of a cereal thresher in terms of velocity of
threshing cylinder, width of thresher, concave clearance, moisture content, centerline distance between bars of concave sieve, volume of void for threshing and feed rate of panicle into the threshing chamber.
7.0 COMPUTER PROGRAMMING OF THE MODEL
The computer aided software for the model package is based on VISUAL BASIC programming language and developed to compute the results of the established sub models from a varying range of machine and crop parameters. VISUAL BASIC was used because it is widely available on microcomputers and the language is well accommodated by most scholars. The result of the sub-models was used to develop the model package.
The design of the model package involved a number of different steps
General design principles for the package
Structure and implementation
Function of various module


2. 6.3 Unthreshed Grain Sub-Model

(36)
The model package is assembled in such a way that it can
perform three different operations.
Run performance characteristic operation such that
the crop and machine parameters are entered individually and
The unthreshed grain model describes the rate at which
unthreshed grains are produced from the system. De simone et al., [4] described this model as a function of threshing
efficiency and flow rate of grains entering the system.
(37) Upon substitution of equation 37 and further simplification,


(38)
Where is the rate of flow of unthreshed grain.
then simulated to view performance results. Using this operation, a parameter is kept constant while others are varied to ascertain its effect on the thresher performance.
Run a task in which crop and machine parameters are
varied and adjusted, a simulation option is selected to output performance results of the individual variations, the results are displayed and finally the optimization option is selected to display the crop and machine parameters that produced the best performance (least )
Process raw data entries whereby one can decide to
determine the performance of any conceived crop and machine parameter. The simulation process is represented by the flow chart shown below (Figure 9).
Based on study and comparison made from works of past researchers, the machine parameters, crop parameters and
IJSER © 2011 http://www.ijser.org
International Journal of Scientific & Engineering Research, Volume 2, Issue 11, November-2011 8
ISSN 2229-5518
constants were chosen. The table below displays the parameters and their range of variations (Table 1, 2, 3).
TABLE 1
MACHINE PARAMETERS AND THEIR RANGE OF
VARIATION
TABLE 2
CROP PARAMETERS AND THEIR VARIATIONS
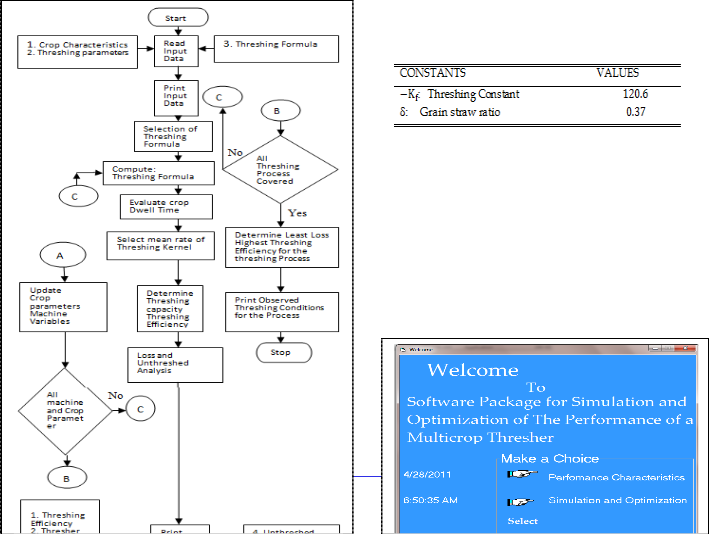
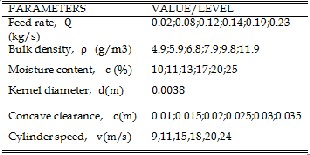
TABLE 3
LIST OF CONSTANTS
8 MODEL APPLICATION/RESULT AND APPLICATION
On establishment of the model structure, introduction of the process sub-models, implementation of the program flow chart and inputing the varying range of parameters alongside constants, the model was run. The screen shots of the model application are shown below.
The screen shots of the model application are shown below
(figure 10, 11, 12, 13):
R © 201 ww.ijser
International Journal of Scientific & Engineering Research, Volume 2, Issue 11, November-2011 9
ISSN 2229-5518
Figure 11 shows the machine and crop parameters for simulation at a moisture content of 15%
Furthermore, the effects of the various machine and crop parameters on threshing efficiency were studied. This is done by varying the parameters whose effect is to be studied at six different levels while the rest are kept constant. The results are presented graphically.
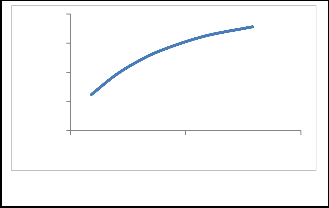
8.1 Effect of Cylinder Velocity on Threshing Efficiency
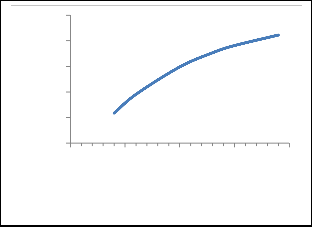
The cylinder speed was found to be directly proportional to the threshing efficiency.
Fig 11 Display of parameters for simulation.
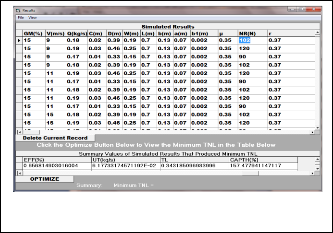
On selection of the ―simulate option‖, the performance characteristics of the model gotten from the various parameter combination is shown below (Figure 12).
100
90
80
70
60
50
5 10 15 20 25
Velocity (m/s)
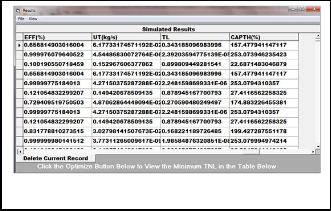
Fig 14 Effect of velocity on threshing efficiency
This can probably be explained on the basis that a higher velocity thinning of the crop material occurs and this gives greater opportunities for threshed materials to penetrate the straw mat.
8.2 Effect of Feed Rate on Threshing Efficiency
The result shows that when feed rate increases, threshing efficiency decreases. Figure 15.
Fig 12 Display of performance characteristics model
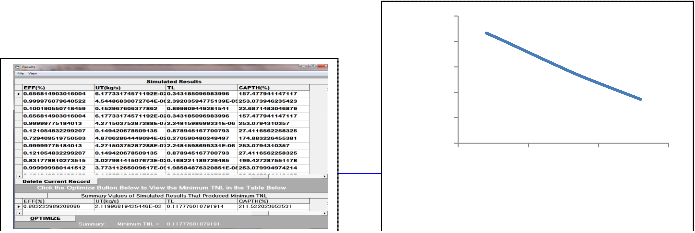
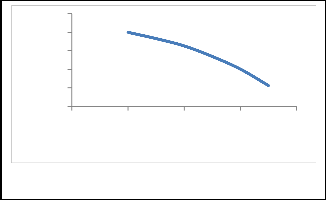
After the selection of the optimization option, the optimal performance characteristics of the model based on minimum threshing loss is shown below (figure 13)
ER © 2011
/www.ijser.o
100
90
80
70
60
50
0.1 0.15 0.2 0.25
Feed rate (Kg/s)
Fig 15 Effect of feed rate on threshing efficiency
International Journal of Scientific & Engineering Research, Volume 2, Issue 11, November-2011 10
ISSN 2229-5518
8.4 Effect of Concave Clearance on Threshing
Efficiency
Decreasing the concave clearance resulted in increased threshing efficiency (figure 17)
The reason being that for a high feed rate, the threshing rate is less and the kernels would take longer time to travel through the mat. Furthermore the concept of energy balance employed by bittner et al, (1968) [2] is expressed by:
Eimpact = Eabsorbed by cushion + Eabsorbed by specimen + Erebound.
Using this equation to explain, it can be deduced that at low feed rate, the energy available at the threshing drum are absorbed by the grains for the removal of the kernel heads
120
100
80
60
40
20
0 0.01 0.02 0.03 0.04
Concave clearance (m)
from the stalks, then as feed rate increases, more grains cluster within the threshing drum which reduces the individual energy absorbed by the grains while increasing the cushioning effect thereby reducing efficiency.
8.3 Effect of Bulk Density on Threshing Eficiency
Increasing the bulk density incresest the threshing efficiency
(figure 16).
Fig 17 Effect of concave clearance on threshing efficiency
Increasing the concave clearance may have decreased the chance of a grain being struck by the beater and decreased the chance of multiple impacts to the grain before it passes from threshing zone.
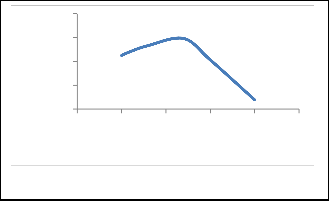
8.5 Effect of Moisture Content on Threshing Efficiency
115
95
75
55
35
100
90
80
70
60
4 9 14
Bulk density (Kg/m3)
Fig 16 Effect of bulk density on threshing efficiency
This might be due to the crop stream between the cylinder and the concave becoming denser, thus providing less cushioning for the grain, since volume flow rate is expressed as feed rate divided by material density
5 10 15 20 25 30
Moisture content (%)
Fig 18 Effect of moisture content on threshing efficiency
Since the best threshing operation is obtained at a moisture content of 18%, it was found that increasing the moisture content resulted in an increasing in threshing efficiency to 18% level and then subsequent reduction.
9 MODEL VERIFICATION
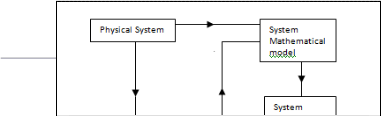
To validate this developed model, it was further compared with results obtained from field application (experimental data) and then results from works of past researchers to prove that the mathematical model developed is at least consistent with published results. The structure of the verification process is shown below (figure 19).
IJSER © 201 http://www.ijser
International Journal of Scientific & Engineering Research, Volume 2, Issue 11, November-2011 11
ISSN 2229-5518
TABLE 5

ANALYSIS OF VARIANCE OF DEVELOPED,DEVELOPED,EXPERIMENTAL AND HUYNH'S MODEL
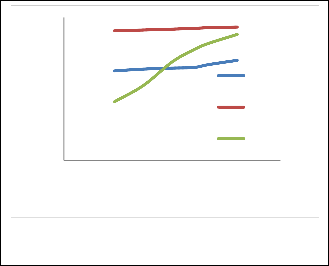
In order to achieve this, these results are studied analytically and statistically and then compared. The data from the respective models are plotted as then analyzed and shown below.
95
85
TABLE 6
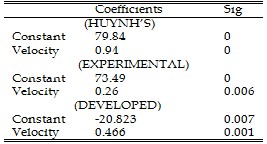
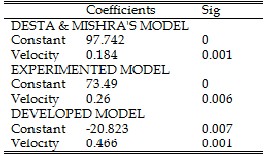
ANALYSIS OF COEFFICIENTS OF DEVELOPED, EXPERIMENTAL AND HUYNH'S MODEL
75 Experimental
65 Model
Huynh's
55 Model
45 Simulated
35 Model
0 10 20 30
VELOCITY (m/s)
Fig 20 Graphical comparison of Huynh's, Simulated and
Experimental Model
A close observation of the comparison as shown in figure 20 above reveals that as velocity increases, the threshing efficiency increases in all model cases. The statistical analysis is shown below.
TABLE 4
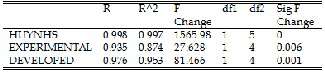
STATISTICAL SUMMARY OF DEVELOPED MODEL, EXPERIMENTED AND HUYNH'S MODEL
From the graphical and statistical analysis, the developed model is reflected by the experimental model in terms of significance value (R2) and similar to that of huynh‘s [10] model which ranks highest followed by the developed and then experimental model. This proves that the developed model is valid using Huynh‘s [10] model as a standard.
TABLE 7
SUMMARY OF STATISTICAL ANALYSIS OF DESTA & MISHRA, EXPERIMENTAL AND DEVELOPED MODEL
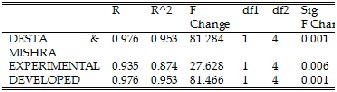
Data set from Desta and Mishra [8] was also used to verify the threshing loss model. When compared with the developed model, the statistical analysis is presented below.
IJSER © 2011 http://www.ijser.org
International Journal of Scientific & Engineering Research, Volume 2, Issue 11, November-2011 12
ISSN 2229-5518
TABLE 8
ANALYSIS OF VARIANCE OF DESTA & MISHRA, EXPERIMENTED AND DEVELPOED MODEL
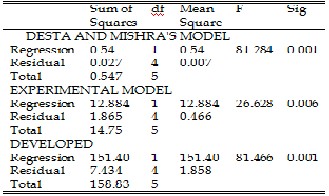
TABLE 9
ANALYSIS OF COEFFICIENTS OF DESTA & MISHRA, EXPERIMENTED AND DEVELOPED MODEL
The statistical comparison shows that the (R2) value of the developed model, Desta and Mishra [8] and experimental model are all in an acceptable range. This goes to further proove that the developed model is valid.
A summary of the comparison of the results obtained from some researchers with the developed model is shown below (table X).
IJSER © 2011 http://www.ijser.org
International Journal of Scientific & Engineering Research, Volume 2, Issue 11, November-2011 13
ISSN 2229-5518
TABLE 10 A
COMPARISON OF THE RESULTS OF VARIOUS MODELS
WITH THAT OF THE DEVELOPED MODEL TABLE 10 B
COMPARISON OF OTHER RESULTS OF VARIOUS
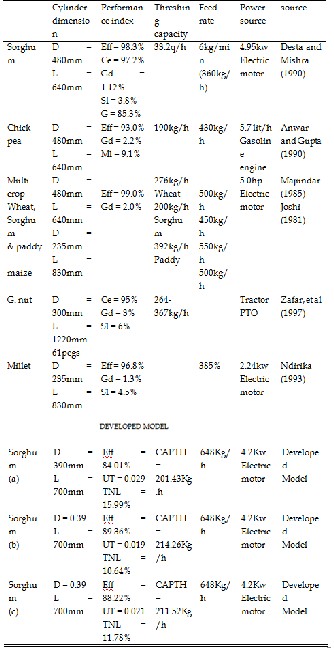
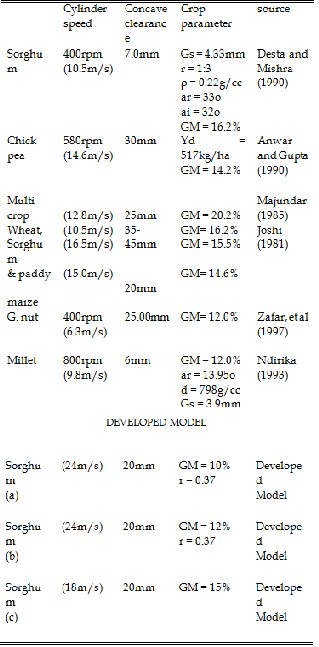 MODELS WITH THAT OF THE DEVELOPED MODEL
10 CONCLUSION
The effect of friction in any mechanical process cannot be over emphasized. The friction that occurs between the beater surfaces contributes to the threshing & separation process.
IJSER © 2011 http://www.ijser.org
International Journal of Scientific & Engineering Research, Volume 2, Issue 11, November-2011 14
ISSN 2229-5518
Based on this, a model was developed to in-cooperate this friction factor. The developed model yielded desired results as expected. The power house of the model is the mathematical models of the threshing & separation process which yielded the various sub-models that characterizes the performance of the model. Many of the previous mathematical models failed to achieve the following.
To include moisture content parameter in the model formulation.
All the models were for combined systems. They have
different models for different cereal types.
To include the frictional factor in the model.
The use computer aided software written in VISUAL BASIC programming language was implored in the model packaging. The model is made to run simulations and optimization using combinations of varying range of machine and crop
parameters. The whole process of this work can be summarized as follows.
Development of sub-models to characterize performance

Mean threshing rate


Threshing efficiency Threshing loss Unthreshed grain
Capacity
Developed a computer aided software for packaging the model
Simulated and optimized the performance to obtain variables for optimum performance
Verified and validated the developed model with other works of past researchers
When compared with works of past researchers and results of past researchers, the model was found generally to fit published data giving R2 values of 0.001 which follows the same trend with that of past researchers. The developed model on further comparison showed that the threshing efficiency increased as the cylinder velocity increases in all
cases.
Having developed and studied this model, it can be said that the model actually fulfilled the aim of producing a thresher model that has the capacity to meet up with the growing need of cereal consumption for which it was initiated.
ACKNOWLEDGEMENT
I am graciously thankful to Prof, E.I.E. Ofodile, Prof, O.C. Iloeje, Dr. N.O. Ibekwe for their immense support towards the actualization of this work. Thanks also to Pastor Felix Aguboshi, head of department, Computer Science, Federal Polytechnic Oko, Anambra State Nigeria for assistance in statistical analysis.
REFERENCES
[1] Behera, B.K., B.K. Dash and D.K. Das 1990. Development and Testing of a Power Operated Wheat Thresher. Mechanization in Asia, Africa and Latin America. Vol. 24 (4): 15 – 21
[2] Bittner, D.R., H.B. Manbeck, and N.N. Mohsenin. 1967. A Method for Evaluation Cushioning Materials used in Mechanical Harvesting and Handling of Fruits and Vegetables. Trans. Of the ASAE 19 (6), 711-714
[3] Brogliaoto, B., 1999, Nonsmooth Mechanics, Springer – Verlag, London, UK
[4] Browne, D.A. 1962. Variation of Bulk Density of Cereals with Moisture content. J. Engineering Research 7, 288 – 299.
[5] Chabara, S.D. 1975. Studies on Threshing of Paddy and Wheat by Axial Flow Thresher. Unpublished .M. Tech. Dissertation, Agric. Engineering Department and Technology, Pantnagar.
[6] Christopher The. (2011). Production and consumption of grains by the world and Malaysia. Retrieved March 2011, from http://www.christopher.com/blog/2011/02/grains_prod_cons/
[7] Dash, S.K. and D.K Das, 1989. Development of a Power-Operated Paddy thresher. mechanization in Asia, Africa and Latin America. 20(3): 37 – 39.
[8] Desta, K and T.N. Mishra, 1990. Development and Performance Evaluation of
a Sorghum Thresher.Mechanization in Asia, Africa and Latin America. 21(3):
33 – 37.
[9] Gregory, J.M., 1988. Combine model for Grain Threshing. J. Mathematical Computer Modeling, 11, 506 – 509.Research Verification (M.E.R.V.). A.S.A.E. Paper No 86 – 5032. St Joseph, MI 49085
[10] Huynh, V.M., T. Powell and .J.N Siddal, 1982. Threshing and separation process: A Mathematical Model. Trans of the A.S.A.E,, 25(1), 65 – 73.
[11] Keller, J.B., 1986, " Ipact with friction, " ASME J Apply. Mech., 53, PP. 1-4,
[12] ] Kutzbach, H.D., Quick, G.R., 1999. Harvesters and Threshers. CIGR Handbook of Agricultural Engineering, vol. III: Plant Production Engineering, pp. 311–347.
[13] Mailander, M., 1984. Development of a dynamic model of a combine harvester in corn. ASAE Paper No. 841588. ASAE, St. Joseph, MI.
[14] Miu, P.I., 1994. Concave separation in a tangential hreshing unit. ASAE Paper
No. 941544. ASAE, St. Joseph, MI
[15] Miu, P.I., 1995. Modelarea procesului de treier la combinele derecoltat cereale (Mathematical Modelling of Threshing Process in Cereal Combine Harvesters), PhD diss. Bucharest:‗Politehnica‘ University of Bucharest, Romania.
[16] Miu, P.I., Beck, F., Kutzbach, H.D., 1997. Mathematical modeling of threshing and separating process in axial threshing units. ASAE Paper No. 971063. ASAE, St. Joseph, MI.
[17] Miu, P.I., Kutzbach, H.D., 2000. Simulation der Dresch- und Trennprozesse in Dreschwerken (Simulation of threshing and separation processes in threshing units). Agrartechnische Forschung Sonderheft 6, 1–7.
[18] Ndirika, V.I.O. 1994. Development and Performance evaluation of a millet thresher. Journal of Agricultural Engineering Technology, 2, 83-88.
IJSER © 2011 http://www.ijser.org
International Journal of Scientific & Engineering Research, Volume 2, Issue 11, November-2011 15
ISSN 2229-5518
[19] Nura Islam and T.T. Pedersen, 1987. Some Physical Properties of Wheat and Paddy and their relationships. Mechanization in Asia, Africa and Latin America, 18(1), 45 – 50.
[20] Ramos, A.B., 1987. An Investigation of Power Requirement for Threshing Rice using Locally Manufactured Axial Flow Thresher. Paper presented at IRRI Feb. 14th Saturday Seminar.
[21] Ruth 2003. Computer Simulation Analysis of Biological and Agricultural
Systems. McGraw-Hill Book Company, New York
[22] Singh, K. and H.C. Joshi, 1979. Axial Flow Thresher. Appropriate Technology
News letter, U.P. India. 2(4): 5 – 6.
[23] Stronge, W.J., 2000, Impact Mechanics, Cambridge University Press, Cambridge.
[24] Vas, F.M. and H.P. Harison, 1969. The Effect of selected Mechanical Threshing Parameters on Kernel Damage and threshibility of Wheat. Canadian Agric. Engineering. 11(2): 88 – 87, 91.
[25] Wessel, J., 1967. Grundlagen des Siebens und Sichtens. Teil II(Fundamentals of screening and winnowing. Part II).Aufbereitungstechnik 13 (4), 167–180.
IJSER © 2011 http://www.ijser.org